SlideShare una empresa de Scribd logo
1 de 9
Descargar para leer sin conexión
Houston Area Single-Family Residential Market by Area for September 2012
Real Estate Data ©2012 Real Estate Center at Texas A and M University and HAR.
Data computations ©2012 Better Homes and Gardens Real Estate Gary Greene
                                                                          Sales                 Sold
                                          Average         Median          Price                 to List             Coop         New            Active            Pending                   Months
Year                      Sales           Price           Price           per Sqft              Price               Sales        Listings       Listings          Sales           DOM       Inventory
Area    1- Atascocita     Sales           Avg Price       Median Price    Sales Price per SQFT Sold to List Price   Coop Sales   New Listings   Active Listings   Pending Sales   DOM       Months Inventory

2011    YTD               1525            $171,840        $148,000        $67                   96%                 84%          3,180          1,289             1,202           90        7.8
2012    YTD               1898            $172,964        $152,700        $68                   97%                 86%          3,130          1,012             1,424           82        5.5
        Difference        373             $1,124          $4,700          $1                    0.01                0.02         -50            -277              222             -8        -2.3
        % Difference      24.46%          0.65%           3.18%           1.49%                 1.04%               2.38%        -1.57%         -21.49%           18.47%          -8.89%    -29.49%


Area    2- East           Sales           Avg Price       Median Price    Sales Price per SQFT Sold to List Price   Coop Sales   New Listings   Active Listings   Pending Sales   DOM       Months Inventory

2011    YTD               1364            $84,216         $80,000         $47                   96%                 76%          2,788          1,245             1,193           84        8.6
2012    YTD               1461            $89,071         $82,000         $49                   96%                 74%          2,411          1,011             1,184           85        6.4
        Difference        97              $4,855          $2,000          $2                    0                   -0.02        -377           -234              -9              1         -2.2
        % Difference      7.11%           5.76%           2.50%           4.26%                 0.00%               -2.63%       -13.52%        -18.80%           -0.75%          1.19%     -25.58%


Area    3- Southeast      Sales           Avg Price       Median Price    Sales Price per SQFT Sold to List Price   Coop Sales   New Listings   Active Listings   Pending Sales   DOM       Months Inventory

2011    YTD               1185            $93,813         $89,900         $53                   95%                 81%          2,145          879               985             89        7.0
2012    YTD               1216            $99,493         $92,500         $55                   96%                 82%          2,007          671               902             76        5.2
        Difference        31              $5,680          $2,600          $2                    0.01                0.01         -138           -208              -83             -13       -1.8
        % Difference      2.62%           6.05%           2.89%           3.77%                 1.05%               1.23%        -6.43%         -23.66%           -8.43%          -14.61%   -25.71%


Area    4- South          Sales           Avg Price       Median Price    Sales Price per SQFT Sold to List Price   Coop Sales   New Listings   Active Listings   Pending Sales   DOM       Months Inventory

2011    YTD               261             $119,776        $81,600         $67                   94%                 73%          637            311               201             88        10.6
2012    YTD               285             $120,404        $82,000         $72                   96%                 74%          586            263               214             92        9.1
        Difference        24              $628            $400            $5                    0.02                0.01         -51            -48               13              4         -1.5
        % Difference      9.20%           0.52%           0.49%           7.46%                 2.13%               1.37%        -8.01%         -15.43%           6.47%           4.55%     -14.15%


Area:   5 - Brazoria      Sales           Avg Price       Median Price    Sales Price per SQFT Sold to List Price   Coop Sales   New Listings   Active Listings   Pending Sales   DOM       Months Inventory

2011    YTD               2004            $167,721        $155,000        $73                   96%                 84%          3,802          1,725             1,435           100       8.5
2012    YTD               2191            $176,891        $164,000        $75                   97%                 86%          3,715          1,315             1,409           85        5.8
        Difference        187             $9,170          $9,000          $2                    0.01                0.02         -87            -410              -26             -15       -2.7
        % Difference      9.33%           5.47%           5.81%           2.74%                 1.04%               2.38%        -2.29%         -23.77%           -1.81%          -15.00%   -31.76%


Area:   6- Pasadena       Sales           Avg Price       Median Price    Sales Price per SQFT Sold to List Price   Coop Sales   New Listings   Active Listings   Pending Sales   DOM       Months Inventory

2011    YTD               780             $109,172        $102,700        $61                   96%                 79%          1,431          599               556             86        7.3
2012    YTD               807             $111,806        $103,000        $62                   97%                 80%          1,359          462               567             81        5.5
        Difference        27              $2,634          $300            $1                    0.01                0.01         -72            -137              11              -5        -1.8
        % Difference      3.46%           2.41%           0.29%           1.64%                 1.04%               1.27%        -5.03%         -22.87%           1.98%           -5.81%    -24.66%


Area:   7- Clear Lake     Sales           Avg Price       Median Price    Sales Price per SQFT Sold to List Price   Coop Sales   New Listings   Active Listings   Pending Sales   DOM       Months Inventory

2011    YTD               1083            $180,792        $155,000        $78                   96%                 81%          2,147          868               664             85        7.8
2012    YTD               1291            $180,107        $152,000        $78                   96%                 83%          2,039          633               664             78        5.0
        Difference        208             -$685           -$3,000         $0                    0                   0.02         -108           -235              0               -7        -2.8
        % Difference      19.21%          -0.38%          -1.94%          0.00%                 0.00%               2.47%        -5.03%         -27.07%           0.00%           -8.24%    -35.90%


Area:   8- Bear Creek     Sales           Avg Price       Median Price    Sales Price per SQFT Sold to List Price   Coop Sales   New Listings   Active Listings   Pending Sales   DOM       Months Inventory

2011    YTD               1342            $162,682        $142,000        $67                   97%                 89%          2,442          810               868             73        5.9
2012    YTD               1435            $167,906        $143,200        $69                   97%                 90%          2,134          535               851             63        3.7
        Difference        93              $5,224          $1,200          $2                    0                   0.01         -308           -275              -17             -10       -2.2
        % Difference      6.93%           3.21%           0.85%           2.99%                 0.00%               1.12%        -12.61%        -33.95%           -1.96%          -13.70%   -37.29%


          Real Estate Data ©2012 Real Estate Center at Texas A and M University and HAR. Data computations ©2012 Better Homes and Gardens Real Estate Gary Greene.
Sales                 Sold
                                          Average         Median          Price                 to List             Coop         New            Active            Pending                   Months
Year    Month               Sales         Price           Price           per Sqft              Price               Sales        Listings       Listings          Sales           DOM       Inventory
Area:   9- The Heights      Sales         Avg Price       Median Price    Sales Price per SQFT Sold to List Price   Coop Sales   New Listings   Active Listings   Pending Sales   DOM       Months Inventory

2011    YTD                 1449          $264,221        $245,000        $144                  96%                 84%          2,885          1,098             778             79        7.4
2012    YTD                 1783          $288,091        $267,000        $153                  98%                 83%          2,697          754               899             69        4.4
        Difference          334           $23,870         $22,000         $9                    0.02                -0.01        -188           -344              121             -10       -3
        % Difference        23.05%        9.03%           8.98%           6.25%                 2.08%               -1.19%       -6.52%         -31.33%           15.55%          -12.66%   -40.54%

        10- Hempstead
Area:   East                Sales         Avg Price       Median Price    Sales Price per SQFT Sold to List Price   Coop Sales   New Listings   Active Listings   Pending Sales   DOM       Months Inventory

2011    YTD                 1221          $169,723        $150,000        $69                   96%                 88%          2,353          836               742             85        6.2
2012    YTD                 1375          $177,732        $159,700        $71                   97%                 91%          2,215          605               751             66        4.4
        Difference          154           $8,009          $9,700          $2                    0.01                0.03         -138           -231              9               -19       -1.8
        % Difference        12.61%        4.72%           6.47%           2.90%                 1.04%               3.41%        -5.86%         -27.63%           1.21%           -22.35%   -29.03%


Area:   11-Near North       Sales         Avg Price       Median Price    Sales Price per SQFT Sold to List Price   Coop Sales   New Listings   Active Listings   Pending Sales   DOM       Months Inventory

2011    YTD                 621           $89,899         $79,900         $48                   96%                 85%          1,119          430               496             80        6.2
2012    YTD                 651           $94,569         $85,000         $50                   96%                 84%          1,039          316               478             73        4.6
        Difference          30            $4,670          $5,100          $2                    0                   -0.01        -80            -114              -18             -7        -1.6
        % Difference        4.83%         5.19%           6.38%           4.17%                 0.00%               -1.18%       -7.15%         -26.51%           -3.63%          -8.75%    -25.81%


Area:   12- North           Sales         Avg Price       Median Price    Sales Price per SQFT Sold to List Price   Coop Sales   New Listings   Active Listings   Pending Sales   DOM       Months Inventory

2011    YTD                 1137          $89,782         $80,000         $46                   97%                 85%          1,967          709               1,011           83        5.8
2012    YTD                 1135          $92,666         $83,000         $47                   97%                 87%          1,737          491               885             71        4.0
        Difference          -2            $2,884          $3,000          $1                    0                   0.02         -230           -218              -126            -12       -1.8
        % Difference        -0.18%        3.21%           3.75%           2.17%                 0.00%               2.35%        -11.69%        -30.75%           -12.46%         -14.46%   -31.03%


Area:   13- Northwest       Sales         Avg Price       Median Price    Sales Price per SQFT Sold to List Price   Coop Sales   New Listings   Active Listings   Pending Sales   DOM       Months Inventory

2011    YTD                 1619          $157,444        $132,500        $60                   96%                 88%          3,149          1,255             1,138           90        7.4
2012    YTD                 1912          $168,723        $139,900        $62                   96%                 88%          3,108          955               1,196           77        5.0
        Difference          293           $11,279         $7,400          $2                    0                   0            -41            -300              58              -13       -2.4
        % Difference        18.10%        7.16%           5.58%           3.33%                 0.00%               0.00%        -1.30%         -23.90%           5.10%           -14.44%   -32.43%

        14- Far
Area:   Northwest           Sales         Avg Price       Median Price    Sales Price per SQFT Sold to List Price   Coop Sales   New Listings   Active Listings   Pending Sales   DOM       Months Inventory

2011    YTD                 1301          $207,026        $156,010        $79                   95%                 89%          2,431          959               813             94        7.3
2012    YTD                 1715          $219,499        $170,000        $82                   96%                 89%          2,627          787               1,016           76        5.0
        Difference          414           $12,473         $13,990         $3                    0.01                0            196            -172              203             -18       -2.3
        % Difference        31.82%        6.02%           8.97%           3.80%                 1.05%               0.00%        8.06%          -17.94%           24.97%          -19.15%   -31.51%

        15-Montgomery
Area:   County Southwest    Sales         Avg Price       Median Price    Sales Price per SQFT Sold to List Price   Coop Sales   New Listings   Active Listings   Pending Sales   DOM       Months Inventory

2011    YTD                 2626          $294,369        $212,140        $106                  96%                 85%          4,826          1,730             1,706           81        6.5
2012    YTD                 2955          $292,129        $228,000        $106                  96%                 85%          4,566          1,303             1,776           68        4.5
        Difference          329           -$2,240         $15,860         $0                    0                   0            -260           -427              70              -13       -2
        % Difference        12.53%        -0.76%          7.48%           0.00%                 0.00%               0.00%        -5.39%         -24.68%           4.10%           -16.05%   -30.77%

        16- Central Inner
Area:   Loop                Sales         Avg Price       Median Price    Sales Price per SQFT Sold to List Price   Coop Sales   New Listings   Active Listings   Pending Sales   DOM       Months Inventory

2011    YTD                 587           $617,447        $415,000        $225                  95%                 80%          1,221          509               217             94        8.5
2012    YTD                 734           $638,092        $420,000        $230                  96%                 84%          1,166          381               334             95        5.6
        Difference          147           $20,645         $5,000          $5                    0.01                0.04         -55            -128              117             1         -2.9
        % Difference        25.04%        3.34%           1.20%           2.22%                 1.05%               5.00%        -4.50%         -25.15%           53.92%          1.06%     -34.12%


          Real Estate Data ©2012 Real Estate Center at Texas A and M University and HAR. Data computations ©2012 Better Homes and Gardens Real Estate Gary Greene.
Sales                 Sold
                                          Average         Median          Price                 to List             Coop         New            Active            Pending                   Months
Year    Month                Sales        Price           Price           per Sqft              Price               Sales        Listings       Listings          Sales           DOM       Inventory
        17-Southwest
Area:   Inner Loop           Sales        Avg Price       Median Price    Sales Price per SQFT Sold to List Price   Coop Sales   New Listings   Active Listings   Pending Sales   DOM       Months Inventory

2011    YTD                  755          $692,178        $620,000        $225                  95%                 85%          1,379          491               189             82        6.1
2012    YTD                  813          $692,225        $645,000        $228                  96%                 82%          1,289          387               252             70        4.7
        Difference           58           $47             $25,000         $3                    0.01                -0.03        -90            -104              63              -12       -1.4
        % Difference         7.68%        0.01%           4.03%           1.33%                 1.05%               -3.53%       -6.53%         -21.18%           33.33%          -14.63%   -22.95%

        18- South
Area:   Central              Sales        Avg Price       Median Price    Sales Price per SQFT Sold to List Price   Coop Sales   New Listings   Active Listings   Pending Sales   DOM       Months Inventory

2011    YTD                  186          $93,823         $75,000         $57                   96%                 83%          305            113               152             81        6.2
2012    YTD                  194          $101,423        $74,500         $59                   97%                 87%          317            83                147             62        4.2
        Difference           8            $7,600          -$500           $2                    0.01                0.04         12             -30               -5              -19       -2.0
        % Difference         4.30%        8.10%           -0.67%          3.51%                 1.04%               4.82%        3.93%          -26.55%           -3.29%          -23.46%   -32.26%

        19- Montgomery
Area:   County Northeast     Sales        Avg Price       Median Price    Sales Price per SQFT Sold to List Price   Coop Sales   New Listings   Active Listings   Pending Sales   DOM       Months Inventory

2011    YTD                  548          $139,433        $115,820        $67                   95%                 78%          1,018          432               429             94        7.1
2012    YTD                  673          $145,445        $116,000        $69                   96%                 76%          1,098          393               446             84        6.0
        Difference           125          $6,012          $180            $2                    0.01                -0.02        80             -39               17              -10       -1.1
        % Difference         22.81%       4.31%           0.16%           2.99%                 1.05%               -2.56%       7.86%          -9.03%            3.96%           -10.64%   -15.49%


Area:   20- Bellaire South   Sales        Avg Price       Median Price    Sales Price per SQFT Sold to List Price   Coop Sales   New Listings   Active Listings   Pending Sales   DOM       Months Inventory

2011    YTD                  616          $179,215        $153,250        $87                   95%                 86%          1,260          440               345             72        6.8
2012    YTD                  750          $195,216        $165,000        $91                   96%                 85%          1,180          331               410             71        4.6
        Difference           134          $16,001         $11,750         $4                    0.01                -0.01        -80            -109              65              -1        -2.2
        % Difference         21.75%       8.93%           7.67%           4.60%                 1.05%               -1.16%       -6.35%         -24.77%           18.84%          -1.39%    -32.35%


Area:   21-Bellaire West     Sales        Avg Price       Median Price    Sales Price per SQFT Sold to List Price   Coop Sales   New Listings   Active Listings   Pending Sales   DOM       Months Inventory

2011    YTD                  154          $110,927        $105,000        $61                   94%                 88%          277            98                105             75        6.0
2012    YTD                  148          $108,088        $105,000        $60                   96%                 80%          266            69                92              49        4.5
        Difference           -6           -$2,839         $0              -$1                   0.02                -0.08        -11            -29               -13             -26       -1.5
        % Difference         -3.90%       -2.56%          0.00%           -1.64%                2.13%               -9.09%       -3.97%         -29.59%           -12.38%         -34.67%   -25.00%

        22 - Central West
Area:                        Sales        Avg Price       Median Price    Sales Price per SQFT Sold to List Price   Coop Sales   New Listings   Active Listings   Pending Sales   DOM       Months Inventory

2011    YTD                  357          $693,216        $490,000        $209                  94%                 85%          730            311               127             106       8.4
2012    YTD                  439          $715,192        $523,500        $212                  94%                 85%          696            235               142             93        5.6
        Difference           82           $21,976         $33,500         $3                    0                   0            -34            -76               15              -13       -2.8
        % Difference         22.97%       3.17%           6.84%           1.44%                 0.00%               0.00%        -4.66%         -24.44%           11.81%          -12.26%   -33.33%


Area:   23- Memorial         Sales        Avg Price       Median Price    Sales Price per SQFT Sold to List Price   Coop Sales   New Listings   Active Listings   Pending Sales   DOM       Months Inventory

2011    YTD                  506          $836,990        $575,000        $225                  95%                 84%          830            259               155             65        5.0
2012    YTD                  510          $955,340        $660,000        $243                  95%                 86%          740            190               163             62        3.6
        Difference           4            $118,350        $85,000         $18                   0                   0.02         -90            -69               8               -3        -1.4
        % Difference         0.79%        14.14%          14.78%          8.00%                 0.00%               2.38%        -10.84%        -26.64%           5.16%           -4.62%    -28.00%

        24 - Spring
Area:   Branch               Sales        Avg Price       Median Price    Sales Price per SQFT Sold to List Price   Coop Sales   New Listings   Active Listings   Pending Sales   DOM       Months Inventory

2011    YTD                  524          $246,477        $172,980        $116                  96%                 86%          1,002          367               268             84        7.0
2012    YTD                  569          $274,564        $185,900        $124                  97%                 88%          910            249               297             70        4.2
        Difference           45           $28,087         $12,920         $8                    0.01                0.02         -92            -118              29              -14       -2.8
        % Difference         8.59%        11.40%          7.47%           6.90%                 1.04%               2.33%        -9.18%         -32.15%           10.82%          -16.67%   -40.00%


          Real Estate Data ©2012 Real Estate Center at Texas A and M University and HAR. Data computations ©2012 Better Homes and Gardens Real Estate Gary Greene.
Sales                 Sold
                                          Average         Median          Price                 to List             Coop         New            Active            Pending                   Months
Year    Month               Sales         Price           Price           per Sqft              Price               Sales        Listings       Listings          Sales           DOM       Inventory
Area:   25- Far West        Sales         Avg Price       Median Price    Sales Price per SQFT Sold to List Price   Coop Sales   New Listings   Active Listings   Pending Sales   DOM       Months Inventory

2011    YTD                 1986          $143,064        $117,000        $63                   96%                 89%          3,401          1,227             1,575           87        5.9
2012    YTD                 2153          $151,585        $124,620        $66                   97%                 89%          3,205          908               1,501           74        4.0
        Difference          167           $8,521          $7,620          $3                    0.01                0            -196           -319              -74             -13       -1.9
        % Difference        8.41%         5.96%           6.51%           4.76%                 1.04%               0.00%        -5.76%         -26.00%           -4.70%          -14.94%   -32.20%


Area:   26- Waller County   Sales         Avg Price       Median Price    Sales Price per SQFT Sold to List Price   Coop Sales   New Listings   Active Listings   Pending Sales   DOM       Months Inventory

2011    YTD                 135           $127,559        $105,000        $65                   95%                 64%          313            152               112             124       10.4
2012    YTD                 135           $145,276        $119,900        $73                   93%                 67%          276            138               96              112       9.5
        Difference          0             $17,717         $14,900         $8                    -0.02               0.03         -37            -14               -16             -12       -0.9
        % Difference        0.00%         13.89%          14.19%          12.31%                -2.11%              4.69%        -11.82%        -9.21%            -14.29%         -9.68%    -8.65%


Area:   28- Alief Area      Sales         Avg Price       Median Price    Sales Price per SQFT Sold to List Price   Coop Sales   New Listings   Active Listings   Pending Sales   DOM       Months Inventory

2011    YTD                 467           $91,820         $80,000         $48                   95%                 88%          816            293               334             80        5.8
2012    YTD                 484           $98,774         $85,000         $51                   96%                 87%          786            234               328             73        4.6
        Difference          17            $6,954          $5,000          $3                    0.01                -0.01        -30            -59               -6              -7        -1.2
        % Difference        3.64%         7.57%           6.25%           6.25%                 1.05%               -1.14%       -3.68%         -20.14%           -1.80%          -8.75%    -20.69%

        29 - Fort Bend -
        Sugar
Area:   Land/Stafford       Sales         Avg Price       Median Price    Sales Price per SQFT Sold to List Price   Coop Sales   New Listings   Active Listings   Pending Sales   DOM       Months Inventory

2011    YTD                 1129          $285,212        $249,000        $97                   94%                 89%          2,141          733               670             76        6.3
2012    YTD                 1334          $282,393        $236,000        $97                   96%                 88%          2,269          567               827             64        4.4
        Difference          205           -$2,819         -$13,000        $0                    0.02                -0.01        128            -166              157             -12       -1.9
        % Difference        18.16%        -0.99%          -5.22%          0.00%                 2.13%               -1.12%       5.98%          -22.65%           23.43%          -15.79%   -30.16%

        30 - Fort Bend
        East - Missouri
Area:   City                Sales         Avg Price       Median Price    Sales Price per SQFT Sold to List Price   Coop Sales   New Listings   Active Listings   Pending Sales   DOM       Months Inventory

2011    YTD                 1055          $224,624        $194,900        $83                   95%                 84%          1,949          754               748             86        7.0
2012    YTD                 1248          $233,710        $210,000        $85                   96%                 86%          2,008          688               820             85        5.5
        Difference          193           $9,086          $15,100         $2                    0.01                0.02         59             -66               72              -1        -1.5
        % Difference        18.29%        4.04%           7.75%           2.41%                 1.05%               2.38%        3.03%          -8.75%            9.63%           -1.16%    -21.43%


Area:   31-West             Sales         Avg Price       Median Price    Sales Price per SQFT Sold to List Price   Coop Sales   New Listings   Active Listings   Pending Sales   DOM       Months Inventory

2011    YTD                 507           $311,984        $232,000        $112                  97%                 89%          1,013          356               304             76        6.4
2012    YTD                 645           $316,884        $234,000        $112                  97%                 86%          981            271               362             64        4.6
        Difference          138           $4,900          $2,000          $0                    0                   -0.03        -32            -85               58              -12       -1.8
        % Difference        27.22%        1.57%           0.86%           0.00%                 0.00%               -3.37%       -3.16%         -23.88%           19.08%          -15.79%   -28.13%

        32- Far
Area:   Northeast           Sales         Avg Price       Median Price    Sales Price per SQFT Sold to List Price   Coop Sales   New Listings   Active Listings   Pending Sales   DOM       Months Inventory

2011    YTD                 767           $212,555        $169,900        $79                   96%                 74%          1,318          491               525             84        6.4
2012    YTD                 842           $217,455        $175,000        $81                   97%                 78%          1,420          423               544             68        5.2
        Difference          75            $4,900          $5,100          $2                    0.01                0.04         102            -68               19              -16       -1.2
        % Difference        9.78%         2.31%           3.00%           2.53%                 1.04%               5.41%        7.74%          -13.85%           3.62%           -19.05%   -18.75%


Area:   33- Galveston       Sales         Avg Price       Median Price    Sales Price per SQFT Sold to List Price   Coop Sales   New Listings   Active Listings   Pending Sales   DOM       Months Inventory

2011    YTD                 2460          $193,488        $161,000        $88                   94%                 77%          5,389          2,726             1,533           107       10.7
2012    YTD                 2896          $197,987        $169,000        $89                   95%                 80%          5,268          2,186             1,690           99        7.6
        Difference          436           $4,499          $8,000          $1                    0.01                0.03         -121           -540              157             -8        -3.1
        % Difference        17.72%        2.33%           4.97%           1.14%                 1.06%               3.90%        -2.25%         -19.81%           10.24%          -7.48%    -28.97%


          Real Estate Data ©2012 Real Estate Center at Texas A and M University and HAR. Data computations ©2012 Better Homes and Gardens Real Estate Gary Greene.
Sales                 Sold
                                          Average         Median          Price                 to List             Coop         New            Active            Pending                   Months
Year    Month              Sales          Price           Price           per Sqft              Price               Sales        Listings       Listings          Sales           DOM       Inventory
        34- Aldine
Area:   Westfield          Sales          Avg Price       Median Price    Sales Price per SQFT Sold to List Price   Coop Sales   New Listings   Active Listings   Pending Sales   DOM       Months Inventory

2011    YTD                179            $68,269         $62,900         $45                   95%                 72%          365            178               137             104       9.2
2012    YTD                185            $67,025         $58,550         $44                   95%                 74%          335            129               143             69        6.9
        Difference         6              -$1,244         -$4,350         -$1                   0                   0.02         -30            -49               6               -35       -2.3
        % Difference       3.35%          -1.82%          -6.92%          -2.22%                0.00%               2.78%        -8.22%         -27.53%           4.38%           -33.65%   -25.00%

        35- Hempstead
Area:   West               Sales          Avg Price       Median Price    Sales Price per SQFT Sold to List Price   Coop Sales   New Listings   Active Listings   Pending Sales   DOM       Months Inventory

2011    YTD                1052           $214,898        $170,110        $78                   96%                 90%          1,786          686               611             98        6.6
2012    YTD                1191           $214,719        $175,900        $79                   96%                 91%          1,864          562               626             76        4.7
        Difference         139            -$179           $5,790          $1                    0                   0.01         78             -124              15              -22       -1.9
        % Difference       13.21%         -0.08%          3.40%           1.28%                 0.00%               1.11%        4.37%          -18.08%           2.45%           -22.45%   -28.79%

        36 - South Katy
Area:   Area               Sales          Avg Price       Median Price    Sales Price per SQFT Sold to List Price   Coop Sales   New Listings   Active Listings   Pending Sales   DOM       Months Inventory

2011    YTD                2249           $275,450        $243,500        $92                   96%                 91%          3,608          1,028             1,337           69        4.5
2012    YTD                2701           $282,761        $252,750        $93                   96%                 91%          3,742          896               1,555           65        3.5
        Difference         452            $7,311          $9,250          $1                    0                   0            134            -132              218             -4        -1
        % Difference       20.10%         2.65%           3.80%           1.09%                 0.00%               0.00%        3.71%          -12.84%           16.31%          -5.80%    -22.22%

        37 - Fort Bend
Area:   West               Sales          Avg Price       Median Price    Sales Price per SQFT Sold to List Price   Coop Sales   New Listings   Active Listings   Pending Sales   DOM       Months Inventory

2011    YTD                1355           $180,311        $155,990        $70                   95%                 90%          2,671          1,046             933             91        7.6
2012    YTD                1677           $178,659        $157,200        $71                   96%                 88%          2,734          838               1,135           83        5.2
        Difference         322            -$1,652         $1,210          $1                    0.01                -0.02        63             -208              202             -8        -2.4
        % Difference       23.76%         -0.92%          0.78%           1.43%                 1.05%               -2.22%       2.36%          -19.89%           21.65%          -8.79%    -31.58%

        38 - Fort Bend
Area:   East               Sales          Avg Price       Median Price    Sales Price per SQFT Sold to List Price   Coop Sales   New Listings   Active Listings   Pending Sales   DOM       Months Inventory

2011    YTD                1055           $169,669        $132,500        $68                   96%                 85%          2,041          795               821             85        7.2
2012    YTD                1200           $184,086        $154,750        $71                   96%                 89%          1,909          574               911             75        4.7
        Difference         145            $14,417         $22,250         $3                    0                   0.04         -132           -221              90              -10       -2.5
        % Difference       13.74%         8.50%           16.79%          4.41%                 0.00%               4.71%        -6.47%         -27.80%           10.96%          -11.76%   -34.72%

        39 - Montgomery
Area:   County Northwest   Sales          Avg Price       Median Price    Sales Price per SQFT Sold to List Price   Coop Sales   New Listings   Active Listings   Pending Sales   DOM       Months Inventory

2011    YTD                818            $250,908        $175,000        $100                  95%                 82%          1,903          937               478             107       10.5
2012    YTD                968            $264,422        $198,390        $104                  95%                 79%          1,964          857               597             104       9.5
        Difference         150            $13,514         $23,390         $4                    0                   -0.03        61             -80               119             -3        -1.0
        % Difference       18.34%         5.39%           13.37%          4.00%                 0.00%               -3.66%       3.21%          -8.54%            24.90%          -2.80%    -9.52%

        40 - Montgomery
Area:   County Southeast   Sales          Avg Price       Median Price    Sales Price per SQFT Sold to List Price   Coop Sales   New Listings   Active Listings   Pending Sales   DOM       Months Inventory

2011    YTD                504            $204,616        $168,000        $82                   95%                 81%          862            383               345             95        7.7
2012    YTD                542            $207,296        $185,000        $84                   96%                 80%          980            363               392             94        6.4
        Difference         38             $2,680          $17,000         $2                    0.01                -0.01        118            -20               47              -1        -1.3
        % Difference       7.54%          1.31%           10.12%          2.44%                 1.05%               -1.23%       13.69%         -5.22%            13.62%          -1.05%    -16.88%

        41 - Montgomery
Area:   County Northwest   Sales          Avg Price       Median Price    Sales Price per SQFT Sold to List Price   Coop Sales   New Listings   Active Listings   Pending Sales   DOM       Months Inventory

2011    YTD                19             $92,232         $75,000         $52                   94%                 74%          43             28                11              105       18.1
2012    YTD                14             $120,050        $85,450         $68                   95%                 43%          33             21                6               78        11.7
        Difference         -5             $27,818         $10,450         $16                   0.01                -0.31        -10            -7                -5              -27       -6.4
        % Difference       -26.32%        30.16%          13.93%          30.77%                1.06%               -41.89%      -23.26%        -25.00%           -45.45%         -25.71%   -35.36%


          Real Estate Data ©2012 Real Estate Center at Texas A and M University and HAR. Data computations ©2012 Better Homes and Gardens Real Estate Gary Greene.
Sales                 Sold
                                          Average         Median          Price                 to List             Coop         New            Active            Pending                   Months
Year    Month                 Sales       Price           Price           per Sqft              Price               Sales        Listings       Listings          Sales           DOM       Inventory

Area:   42 - Liberty County   Sales       Avg Price       Median Price    Sales Price per SQFT Sold to List Price   Coop Sales   New Listings   Active Listings   Pending Sales   DOM       Months Inventory

2011    YTD                   58          $107,466        $70,000         $64                   93%                 40%          207            135               35              139       20.1
2012    YTD                   81          $83,395         $53,000         $55                   93%                 36%          216            135               57              150       20.2
        Difference            23          -$24,071        -$17,000        -$9                   0                   -0.04        9              0                 22              11        0.1
        % Difference          39.66%      -22.40%         -24.29%         -14.06%               0.00%               -10.00%      4.35%          0.00%             62.86%          7.91%     0.50%


Area:   43 - Walker County    Sales       Avg Price       Median Price    Sales Price per SQFT Sold to List Price   Coop Sales   New Listings   Active Listings   Pending Sales   DOM       Months Inventory

2011    YTD                   174         $138,687        $129,200        $74                   95%                 55%          407            206               129             113       11.6
2012    YTD                   201         $124,742        $120,000        $71                   95%                 53%          392            208               133             115       10.5
        Difference            27          -$13,945        -$9,200         -$3                   0                   -0.02        -15            2                 4               2         -1.1
        % Difference          15.52%      -10.06%         -7.12%          -4.05%                0.00%               -3.64%       -3.69%         0.97%             3.10%           1.77%     -9.48%


Area:   44 - Polk County      Sales       Avg Price       Median Price    Sales Price per SQFT Sold to List Price   Coop Sales   New Listings   Active Listings   Pending Sales   DOM       Months Inventory

2011    YTD                   258         $149,629        $118,000        $87                   93%                 60%          586            392               153             151       15.2
2012    YTD                   243         $144,111        $110,000        $83                   91%                 49%          589            388               147             146       15.1
        Difference            -15         -$5,518         -$8,000         -$4                   -0.02               -0.11        3              -4                -6              -5        -0.1
        % Difference          -5.81%      -3.69%          -6.78%          -4.60%                -2.15%              -18.33%      0.51%          -1.02%            -3.92%          -3.31%    -0.66%


Area:   45                    Sales       Avg Price       Median Price    Sales Price per SQFT Sold to List Price   Coop Sales   New Listings   Active Listings   Pending Sales   DOM       Months Inventory

2011    YTD                   10          $61,343         $69,750         $36                   95%                 90%          12             6                 8               53        7.4
2012    YTD                   9           $74,939         $69,000         $47                   97%                 78%          22             5                 10              63        4.6
        Difference            -1          $13,596         -$750           $11                   0.02                -0.12        10             -1                2               10        -2.8
        % Difference          -10.00%     22.16%          -1.08%          30.56%                2.11%               -13.33%      83.33%         -16.67%           25.00%          18.87%    -37.84%


Area:   46                    Sales       Avg Price       Median Price    Sales Price per SQFT Sold to List Price   Coop Sales   New Listings   Active Listings   Pending Sales   DOM       Months Inventory

2011    YTD                   8           $44,987         $39,880         $26                   95%                 50%          7              7                 8               159       12.6
2012    YTD                   9           $66,862         $58,950         $29                   76%                 33%          7              8                 6               134       5.3
        Difference            1           $21,875         $19,070         $3                    -0.19               -0.17        0              1                 -2              -25       -7.3
        % Difference          12.50%      48.63%          47.82%          11.54%                -20.00%             -34.00%      0.00%          14.29%            -25.00%         -15.72%   -57.94%


Area:   47                    Sales       Avg Price       Median Price    Sales Price per SQFT Sold to List Price   Coop Sales   New Listings   Active Listings   Pending Sales   DOM       Months Inventory

2011    YTD                   1           $100,000        $100,000        $56                   100%                100%         0              0                 14              0         0.0
2012    YTD                   2           $77,000         $77,000         $39                   98%                 100%         1              1                 0               38        6.0
        Difference            1           -$23,000        -$23,000        -$17                  -0.02               0            1              1                 -14             38        6
        % Difference          100.00%     -23.00%         -23.00%         -30.36%               -2.00%              0.00%        100.00%        100.00%           n/a             n/a       1200.00%


Area:   48                    Sales       Avg Price       Median Price    Sales Price per SQFT Sold to List Price   Coop Sales   New Listings   Active Listings   Pending Sales   DOM       Months Inventory

2011    YTD                   25          $96,174         $104,000        $54                   93%                 36%          65             42                10              91        14.1
2012    YTD                   27          $87,996         $75,000         $51                   93%                 26%          78             58                18              149       22.6
        Difference            2           -$8,178         -$29,000        -$3                   0                   -0.1         13             16                8               58        8.5
        % Difference          8.00%       -8.50%          -27.88%         -5.56%                0.00%               -27.78%      20.00%         38.10%            80.00%          63.74%    60.28%


Area:   49                    Sales       Avg Price       Median Price    Sales Price per SQFT Sold to List Price   Coop Sales   New Listings   Active Listings   Pending Sales   DOM       Months Inventory

2011    YTD                   11          $95,935         $102,560        $53                   95%                 73%          20             17                13              104       23.4
2012    YTD                   20          $130,477        $118,480        $69                   97%                 50%          29             16                13              79        8.7
        Difference            9           $34,542         $15,920         $16                   0.02                -0.23        9              -1                0               -25       -14.7
        % Difference          81.82%      36.01%          15.52%          30.19%                2.11%               -31.51%      1500.00%       -5.88%            0.00%           -24.04%   -62.82%


Area:   50                    Sales       Avg Price       Median Price    Sales Price per SQFT Sold to List Price   Coop Sales   New Listings   Active Listings   Pending Sales   DOM       Months Inventory

2011    YTD                   14          $48,582         $52,390         $29                   93%                 86%          9              12                16              96        33.3
2012    YTD                   16          $51,766         $53,280         $29                   89%                 81%          9              3                 18              160       1.6
        Difference            2           $3,184          $890            $0                    -0.04               -0.05        0              -9                2               64        -31.7
        % Difference          14.29%      6.55%           1.70%           0.00%                 -4.30%              -5.81%       0.00%          -75.00%           12.50%          66.67%    -95.20%


Area:   51                    Sales       Avg Price       Median Price    Sales Price per SQFT Sold to List Price   Coop Sales   New Listings   Active Listings   Pending Sales   DOM       Months Inventory

2011    YTD                   35          $107,985        $51,200         $45                   91%                 71%          49             23                56              110       6.9
2012    YTD                   48          $83,092         $64,250         $45                   92%                 88%          84             31                57              76        6.2
        Difference            13          -$24,893        $13,050         $14                   0.01                0.17         35             8                 1               -34       -0.7
        % Difference          37.14%      -23.05%         25.49%          0.00%                 1.10%               23.94%       71.43%         34.78%            1.79%           -30.91%   -10.14%


          Real Estate Data ©2012 Real Estate Center at Texas A and M University and HAR. Data computations ©2012 Better Homes and Gardens Real Estate Gary Greene.
Sales                 Sold
                                          Average         Median          Price                 to List             Coop         New            Active            Pending                   Months
Year    Month                 Sales       Price           Price           per Sqft              Price               Sales        Listings       Listings          Sales           DOM       Inventory

Area:   52 - Liberty County   Sales       Avg Price       Median Price    Sales Price per SQFT Sold to List Price   Coop Sales   New Listings   Active Listings   Pending Sales   DOM       Months Inventory

2011    YTD                   236         $85,847         $72,000         $50                   95%                 51%          552            297               205             100       13.2
2012    YTD                   228         $100,776        $84,980         $55                   95%                 55%          541            268               199             116       10.3
        Difference            -8          $14,929         $12,980         $5                    0                   0.04         -11            -29               -6              16        -2.9
        % Difference          -3.39%      17.39%          18.03%          10.00%                0.00%               7.84%        -1.99%         -9.76%            -2.93%          16.00%    -21.97%

        53 - Chambers
Area:   County                Sales       Avg Price       Median Price    Sales Price per SQFT Sold to List Price   Coop Sales   New Listings   Active Listings   Pending Sales   DOM       Months Inventory

2011    YTD                   199         $174,030        $172,900        $77                   97%                 79%          394            209               122             107       9.2
2012    YTD                   236         $185,960        $187,500        $78                   97%                 74%          420            179               146             97        7.5
        Difference            37          $11,930         $14,600         $1                    0                   -0.05        26             -30               24              -10       -1.7
        % Difference          18.59%      6.86%           8.44%           1.30%                 0.00%               -6.33%       6.60%          -14.35%           19.67%          -9.35%    -18.48%


Area:   54                    Sales       Avg Price       Median Price    Sales Price per SQFT Sold to List Price   Coop Sales   New Listings   Active Listings   Pending Sales   DOM       Months Inventory

2011    YTD                   35          $142,914        $123,000        $90                   92%                 54%          141            127               30              116       36.6
2012    YTD                   53          $141,670        $134,000        $97                   93%                 51%          155            135               43              175       27.0
        Difference            18          -$1,244         $11,000         $7                    0.01                -0.03        14             8                 13              59        -9.6
        % Difference          51.43%      -0.87%          8.94%           7.78%                 1.09%               -5.56%       9.93%          6.30%             43.33%          50.86%    -26.23%


Area:   55 - Wharton County   Sales       Avg Price       Median Price    Sales Price per SQFT Sold to List Price   Coop Sales   New Listings   Active Listings   Pending Sales   DOM       Months Inventory

2011    YTD                   89          $96,889         $90,000         $58                   93%                 48%          194            134               62              131       14.3
2012    YTD                   114         $109,423        $92,300         $63                   93%                 43%          210            122               71              121       10.6
        Difference            25          $12,534         $2,300          $5                    0                   -0.05        16             -12               9               -10       -3.7
        % Difference          28.09%      12.94%          2.56%           8.62%                 0.00%               -10.42%      8.25%          -8.96%            14.52%          -7.63%    -25.87%


Area:   56                    Sales       Avg Price       Median Price    Sales Price per SQFT Sold to List Price   Coop Sales   New Listings   Active Listings   Pending Sales   DOM       Months Inventory

2011    YTD                   26          $113,270        $86,000         $60                   88%                 50%          64             43                19              113       12.5
2012    YTD                   27          $109,745        $75,000         $63                   95%                 41%          83             45                16              68        18.2
        Difference            1           -$3,525         -$11,000        $3                    0.07                -0.09        19             2                 -3              -45       5.7
        % Difference          3.85%       -3.11%          -12.79%         5.00%                 7.95%               -18.00%      29.69%         4.65%             -15.79%         -39.82%   45.60%

        57 - Austin County
Area:                         Sales       Avg Price       Median Price    Sales Price per SQFT Sold to List Price   Coop Sales   New Listings   Active Listings   Pending Sales   DOM       Months Inventory

2011    YTD                   89          $141,093        $135,500        $74                   93%                 72%          206            159               65              138       17.1
2012    YTD                   86          $168,230        $154,500        $85                   95%                 63%          202            115               65              135       13.3
        Difference            -3          $27,137         $19,000         $11                   0.02                -0.09        -4             -44               0               -3        -3.8
        % Difference          -3.37%      19.23%          14.02%          14.86%                2.15%               -12.50%      -1.94%         -27.67%           0.00%           -2.17%    -22.22%


Area:   58                    Sales       Avg Price       Median Price    Sales Price per SQFT Sold to List Price   Coop Sales   New Listings   Active Listings   Pending Sales   DOM       Months Inventory

2011    YTD                   58          $158,578        $135,500        $84                   93%                 50%          135            71                28              111       11.2
2012    YTD                   79          $151,475        $139,000        $86                   96%                 70%          146            66                44              81        8.4
        Difference            21          -$7,103         $3,500          $2                    0.03                0.2          11             -5                16              -30       -2.8
        % Difference          36.21%      -4.48%          2.58%           2.38%                 3.23%               40.00%       8.15%          -7.04%            57.14%          -27.03%   -25.00%


Area:   59                    Sales       Avg Price       Median Price    Sales Price per SQFT Sold to List Price   Coop Sales   New Listings   Active Listings   Pending Sales   DOM       Months Inventory

2011    YTD                   5           $127,330        $116,000        $76                   97%                 80%          3              9                 2               82        10.7
2012    YTD                   6           $83,817         $56,500         $60                   96%                 67%          7              6                 3               107       8.0
        Difference            1           -$43,513        -$59,500        -$16                  -0.01               -0.13        4              -3                3               25        -2.7
        % Difference          20.00%      -34.17%         -51.29%         -21.05%               -1.03%              -16.25%      133.33%        -33.33%           300.00%         30.49%    -25.23%


          Real Estate Data ©2012 Real Estate Center at Texas A and M University and HAR. Data computations ©2012 Better Homes and Gardens Real Estate Gary Greene.
Sales                 Sold
                                          Average         Median          Price                 to List             Coop         New            Active            Pending                   Months
Year    Month              Sales          Price           Price           per Sqft              Price               Sales        Listings       Listings          Sales           DOM       Inventory
Area:   60                 Sales          Avg Price       Median Price    Sales Price per SQFT Sold to List Price   Coop Sales   New Listings   Active Listings   Pending Sales   DOM       Months Inventory

2011    YTD                26             $87,023         $70,000         $60                   94%                 58%          89             51                17              152       12.2
2012    YTD                45             $101,926        $55,000         $63                   94%                 40%          117            60                41              123       16.2
        Difference         19             $14,903         -$15,000        $3                    0                   -0.18        28             9                 24              -29       4
        % Difference       73.08%         17.13%          -21.43%         5.00%                 0.00%               -31.03%      31.46%         17.65%            141.18%         -19.08%   32.79%


Area:   61                 Sales          Avg Price       Median Price    Sales Price per SQFT Sold to List Price   Coop Sales   New Listings   Active Listings   Pending Sales   DOM       Months Inventory

2011    YTD                59             $182,532        $154,000        $90                   97%                 80%          105            48                37              81        7.6
2012    YTD                77             $191,006        $156,250        $90                   97%                 90%          150            52                53              96        7.3
        Difference         18             $8,474          $2,250          $0                    0                   0.1          45             4                 16              15        -0.3
        % Difference       30.51%         4.64%           1.46%           0.00%                 0.00%               12.50%       42.86%         8.33%             43.24%          18.52%    -3.95%


Area:   62                 Sales          Avg Price       Median Price    Sales Price per SQFT Sold to List Price   Coop Sales   New Listings   Active Listings   Pending Sales   DOM       Months Inventory

2011    YTD                24             $86,204         $76,500         $53                   95%                 13%          36             22                19              137       8.8
2012    YTD                20             $106,766        $124,250        $60                   94%                 35%          43             18                21              68        6.0
        Difference         -4             $20,562         $47,750         $7                    -1%                 22%          7              -4                2               -69       -2.8
        % Difference       -16.67%        23.85%          62.42%          13.21%                -1.05%              169.23%      19.44%         -18.18%           10.53%          -50.36%   -31.82%


Area:   63                 Sales          Avg Price       Median Price    Sales Price per SQFT Sold to List Price   Coop Sales   New Listings   Active Listings   Pending Sales   DOM       Months Inventory

2011    YTD                20             $103,450        $87,500         $61                   90%                 30%          37             33                15              248       11.6
2012    YTD                13             $125,077        $118,000        $71                   91%                 0%           34             40                11              122       38.7
        Difference         -7             $21,627         $30,500         $10                   0.01                -0.3         -3             7                 -4              -126      27.1
        % Difference       -35.00%        20.91%          34.86%          16.39%                1.11%               -100.00%     -8.11%         21.21%            -26.67%         -50.81%   233.62%

        64 - San Jacinto
Area:   County             Sales          Avg Price       Median Price    Sales Price per SQFT Sold to List Price   Coop Sales   New Listings   Active Listings   Pending Sales   DOM       Months Inventory

2011    YTD                122            $175,062        $116,750        $91                   92%                 50%          295            199               84              160       16.6
2012    YTD                144            $161,540        $115,000        $96                   93%                 56%          342            206               81              134       14.7
        Difference         22             -$13,522        -$1,750         $5                    0.01                0.06         47             7                 -3              -26       -1.9
        % Difference       18.03%         -7.72%          -1.50%          5.49%                 1.09%               12.00%       15.93%         3.52%             -3.57%          -16.25%   -11.45%


Area:   65                 Sales          Avg Price       Median Price    Sales Price per SQFT Sold to List Price   Coop Sales   New Listings   Active Listings   Pending Sales   DOM       Months Inventory

2011    YTD                2              $103,500        $103,500        $90                   94%                 100%         4              9                 2               44        29.5
2012    YTD                3              $194,000        $192,000        $121                  90%                 33%          1              6                 2               196       22.0
        Difference         1              $90,500         $88,500         $31                   -4%                 -67%         -3             -3                0               152       -7.5
        % Difference       50.00%         87.44%          85.51%          34.44%                -4.26%              100%         -75.00%        -33.33%           0.00%           345.45%   -25.42%


Area:   66                 Sales          Avg Price       Median Price    Sales Price per SQFT Sold to List Price   Coop Sales   New Listings   Active Listings   Pending Sales   DOM       Months Inventory

2011    YTD                1              $45,000         $45,000         $21                   94%                 0%           1              1                 12              12        12.0


Area:   67                 Sales          Avg Price       Median Price    Sales Price per SQFT Sold to List Price   Coop Sales   New Listings   Active Listings   Pending Sales   DOM       Months Inventory

2011    YTD                3              $109,833        $88,500         $68                   90%                 33%          1              7                                 126       35.3
2012    YTD                6              $102,792        $61,120         $65                   89%                 0%           2              6                 1               60        15.8
        Difference         3              -$7,041         -$27,380        -$3                   -1%                 -33%         1              -1                1               -66       -19.5
        % Difference       100.00%        -6.41%          -30.94%         -4.41%                -1.11%              -100.00%     100.00%        -14.29%           100.00%         -52.38%   -55.24%


Area:   68                 Sales          Avg Price       Median Price    Sales Price per SQFT Sold to List Price   Coop Sales   New Listings   Active Listings   Pending Sales   DOM       Months Inventory

2011    YTD                1              $47,500         $47,500         $24                   94%                 0%           4                                                113       48.0
2012    YTD                1              $50,000         $50,000         $33                   77%                 0%           1              4                 1               62        16.0
        Difference         0              $2,500          $2,500          $9                    -17%                0%           -3             4                 1               -51       -32
        % Difference       0.00%          5.26%           5.26%           37.50%                -18.09%             0.00%        -75.00%        400.00%           100.00%         -45.13%   -66.67%


Area:   69                 Sales          Avg Price       Median Price    Sales Price per SQFT Sold to List Price   Coop Sales   New Listings   Active Listings   Pending Sales   DOM       Months Inventory

2011    YTD                7              $203,286        $153,000        $143                  91%                 57%          4              13                4               133       19.3
2012    YTD                6              $153,583        $173,750        $72                   91%                 50%          8              12                3               278       19.1
        Difference         -1             -$49,703        $20,750         -$71                  0%                  -7%          4              -1                -1              145       -0.2
        % Difference       -14.29%        -24.45%         13.56%          -49.65%               0.00%               -12.28%      100.00%        -7.69%            -25.00%         109.02%   -1.04%


Area:   70                 Sales          Avg Price       Median Price    Sales Price per SQFT Sold to List Price   Coop Sales   New Listings   Active Listings   Pending Sales   DOM       Months Inventory

2011    YTD                1              $135,000        $135,000        $57                   93%                 100%         1              3                 380             380       36.0
2012    YTD                1              $132,000        $132,000        $80                   101%                0%           6              121               36              121       72.0
        Difference         0              -$3,000         -$3,000         $23                   0.08                -1.00        5              118               -344            -259      36
        % Difference       0.00%          -2.22%          -2.22%          40.35%                8.60%               -100.00%     500.00%        3933.33%          -90.53%         -68.16%   100.00%


          Real Estate Data ©2012 Real Estate Center at Texas A and M University and HAR. Data computations ©2012 Better Homes and Gardens Real Estate Gary Greene.
Sales                 Sold
                                          Average         Median          Price                 to List             Coop         New            Active            Pending                   Months
Year    Month             Sales           Price           Price           per Sqft              Price               Sales        Listings       Listings          Sales           DOM       Inventory
Area:   71                Sales           Avg Price       Median Price    Sales Price per SQFT Sold to List Price   Coop Sales   New Listings   Active Listings   Pending Sales   DOM       Months Inventory

2011    YTD               1               $242,990        $242,990        $69                   100%                100%                                          1               88
2012    YTD               1               $50,000         $50,000         $35                   83%                 0%           1              1                 1               74        12.0
        Difference        0               -$192,990       -$192,990       -$34                  -17%                -100%        1              1                 0               -14       12.0
        % Difference      0.00%           -79.42%         -79.42%         -49.28%               -17.00%             -100.00%     100.00%        100.00%           0.00%           -15.91%   1200.00%


Area:   72                Sales           Avg Price       Median Price    Sales Price per SQFT Sold to List Price   Coop Sales   New Listings   Active Listings   Pending Sales   DOM       Months Inventory

2011    YTD               1               $15,000         $15,000         $10                   52%                 100%         1              7                                 148       14.0
2012    YTD               2               $162,000        $162,000        $42                   92%                 100%         2              1                 8               9
        Difference        1               $147,000        $147,000        $32                   40%                 0%           1              -6                8               -139      -14.0
        % Difference      100.00%         980.00%         980.00%         320.00%               76.92%              0.00%        100.00%        -85.71%           n/a             -93.92%   -100.00%


Area:   73                Sales           Avg Price       Median Price    Sales Price per SQFT Sold to List Price   Coop Sales   New Listings   Active Listings   Pending Sales   DOM       Months Inventory

2011    YTD               2               $303,750        $303,750        $153                  101%                50%          2              5                 1               369       13.5
2012    YTD               2               $149,900        $149,900        $81                   99%                 0%           3              7                                 142       24.5
        Difference        0               -$153,850       -$153,850       -$72                  -2%                 -50%         1              2                 -1              -227      11
        % Difference      0.00%           -50.65%         -50.65%         -47.06%               -1.98%              -100.00%     50.00%         40.00%            -100.00%        -61.52%   81.48%


Area:   74                Sales           Avg Price       Median Price    Sales Price per SQFT Sold to List Price   Coop Sales   New Listings   Active Listings   Pending Sales   DOM       Months Inventory

2012    YTD               1               $90,000         $90,000         $56                   90%                 0%           1              1                 1               91        6.0

Area:   77                Sales           Avg Price       Median Price    Sales Price per SQFT Sold to List Price   Coop Sales   New Listings   Active Listings   Pending Sales   DOM       Months Inventory

2011    YTD               13              $132,615        $105,000        $57                   93%                 69%          8              12                5               57        11.9
2012    YTD               4               $48,175         $48,850         $34                   90%                 0%           2              6                 1               48        5.3
        Difference        -9              -$84,440        -$56,150        -$23                  -3%                 -69%         -6             -6                -4              -9        -6.6
        % Difference      -69.23%         -63.67%         -53.48%         -40.35%               -3.23%              -100.00%     -75.00%        -50.00%           -80.00%         -15.79%   -55.46%


Area:   78                Sales           Avg Price       Median Price    Sales Price per SQFT Sold to List Price   Coop Sales   New Listings   Active Listings   Pending Sales   DOM       Months Inventory

2012    YTD               1               $10,000         $10,000         $5                    53%                 100%         1              2                 2               74        24.0


Area:   79                Sales           Avg Price       Median Price    Sales Price per SQFT Sold to List Price   Coop Sales   New Listings   Active Listings   Pending Sales   DOM       Months Inventory

2011    YTD               1               $70,000         $70,000         $63                   93%                 0%           1              2                 1               75        24.0


          Real Estate Data ©2012 Real Estate Center at Texas A and M University and HAR. Data computations ©2012 Better Homes and Gardens Real Estate Gary Greene.

Más contenido relacionado

La actualidad más candente

La actualidad más candente (20)

Fvreb Sept 2020 Stats
Fvreb Sept 2020 StatsFvreb Sept 2020 Stats
Fvreb Sept 2020 Stats
 
Fraser Valley Real Estate Board Statistics Package Jan 2021
Fraser Valley Real Estate Board Statistics Package Jan 2021Fraser Valley Real Estate Board Statistics Package Jan 2021
Fraser Valley Real Estate Board Statistics Package Jan 2021
 
Fraser Valley Real Estate Board July 2021 Statistics
Fraser Valley Real Estate Board July 2021 Statistics Fraser Valley Real Estate Board July 2021 Statistics
Fraser Valley Real Estate Board July 2021 Statistics
 
Fraser Valley Real Estate Board November 2020 statistics package
Fraser Valley Real Estate Board November 2020 statistics packageFraser Valley Real Estate Board November 2020 statistics package
Fraser Valley Real Estate Board November 2020 statistics package
 
Feb 20 package fvreb
Feb 20 package fvrebFeb 20 package fvreb
Feb 20 package fvreb
 
2012 year end report
2012 year end report2012 year end report
2012 year end report
 
July 2021 Okanagan Statistics
July 2021 Okanagan StatisticsJuly 2021 Okanagan Statistics
July 2021 Okanagan Statistics
 
Fraser Valley Real Estate Board June 2020
Fraser Valley Real Estate Board June 2020 Fraser Valley Real Estate Board June 2020
Fraser Valley Real Estate Board June 2020
 
Fraser Valley Real Estate Board Statistics Package January 2020
Fraser Valley Real Estate Board Statistics Package January 2020 Fraser Valley Real Estate Board Statistics Package January 2020
Fraser Valley Real Estate Board Statistics Package January 2020
 
April 2021 - TRREB Market Report
April 2021 - TRREB Market Report April 2021 - TRREB Market Report
April 2021 - TRREB Market Report
 
Fvreb August 2020 Stats Package
Fvreb August 2020 Stats PackageFvreb August 2020 Stats Package
Fvreb August 2020 Stats Package
 
Fvreb may 2020 stats
Fvreb may 2020 stats Fvreb may 2020 stats
Fvreb may 2020 stats
 
Rebgv stats-pkg-august-2018
Rebgv stats-pkg-august-2018Rebgv stats-pkg-august-2018
Rebgv stats-pkg-august-2018
 
December 2021 Fraser Valley Real Estate Board Statistics
December 2021 Fraser Valley Real Estate Board StatisticsDecember 2021 Fraser Valley Real Estate Board Statistics
December 2021 Fraser Valley Real Estate Board Statistics
 
Manhattan First Quarter 2011 Real Estate Market Report
Manhattan First Quarter 2011 Real Estate Market Report Manhattan First Quarter 2011 Real Estate Market Report
Manhattan First Quarter 2011 Real Estate Market Report
 
Dec 2020 Fraser Valley Real Estate Board Package
Dec 2020 Fraser Valley Real Estate Board PackageDec 2020 Fraser Valley Real Estate Board Package
Dec 2020 Fraser Valley Real Estate Board Package
 
July fvreb stats package
July fvreb stats packageJuly fvreb stats package
July fvreb stats package
 
Dallas Market Update January 2008
Dallas Market Update January 2008Dallas Market Update January 2008
Dallas Market Update January 2008
 
Fvreb aug 2019 stats package
Fvreb aug 2019 stats packageFvreb aug 2019 stats package
Fvreb aug 2019 stats package
 
Chicagoland Quarterly Supply/Demand Report - 7/1/2011
Chicagoland Quarterly Supply/Demand Report - 7/1/2011Chicagoland Quarterly Supply/Demand Report - 7/1/2011
Chicagoland Quarterly Supply/Demand Report - 7/1/2011
 

Destacado

2012 13-calendar
2012 13-calendar2012 13-calendar
2012 13-calendar
Toni Moss
 
Hurricane preparedness
Hurricane preparednessHurricane preparedness
Hurricane preparedness
Toni Moss
 
School District Map
School District MapSchool District Map
School District Map
Toni Moss
 
Hurricane preparednesschecklist
Hurricane preparednesschecklistHurricane preparednesschecklist
Hurricane preparednesschecklist
Toni Moss
 
Power of color
Power of colorPower of color
Power of color
Toni Moss
 

Destacado (7)

2012 13-calendar
2012 13-calendar2012 13-calendar
2012 13-calendar
 
Hurricane preparedness
Hurricane preparednessHurricane preparedness
Hurricane preparedness
 
School District Map
School District MapSchool District Map
School District Map
 
Hurricane preparednesschecklist
Hurricane preparednesschecklistHurricane preparednesschecklist
Hurricane preparednesschecklist
 
Power of color
Power of colorPower of color
Power of color
 
Victorian colors schemes
Victorian colors schemesVictorian colors schemes
Victorian colors schemes
 
Study: The Future of VR, AR and Self-Driving Cars
Study: The Future of VR, AR and Self-Driving CarsStudy: The Future of VR, AR and Self-Driving Cars
Study: The Future of VR, AR and Self-Driving Cars
 

Similar a Houston marketreport sep12_sf

Naa Annual Newspaper Ad Expenditures 09
Naa Annual Newspaper Ad Expenditures 09Naa Annual Newspaper Ad Expenditures 09
Naa Annual Newspaper Ad Expenditures 09
Juan Varela
 
January 2011 Austin Real Estate Market Stats
January 2011 Austin Real Estate Market StatsJanuary 2011 Austin Real Estate Market Stats
January 2011 Austin Real Estate Market Stats
Kristee Leonard
 
February 2011 Austin Real Estate Stats
February 2011 Austin Real Estate StatsFebruary 2011 Austin Real Estate Stats
February 2011 Austin Real Estate Stats
Kristee Leonard
 
Caída Publicidad EEUU 2009
Caída Publicidad EEUU 2009Caída Publicidad EEUU 2009
Caída Publicidad EEUU 2009
Juan Varela
 
Vancouver real estate february 2012 stats package rebgv
Vancouver real estate february 2012 stats package rebgvVancouver real estate february 2012 stats package rebgv
Vancouver real estate february 2012 stats package rebgv
Matt Collinge
 
101842285 july-2012-rebgv-stats-package-adam-scalena
101842285 july-2012-rebgv-stats-package-adam-scalena101842285 july-2012-rebgv-stats-package-adam-scalena
101842285 july-2012-rebgv-stats-package-adam-scalena
vancouverhomesteam
 
Updated Year to Date Comparison
Updated Year to Date ComparisonUpdated Year to Date Comparison
Updated Year to Date Comparison
njhousehelper
 
Spencer Levy - Capital Markets 2.0 - Did We Speak Too Soon?
Spencer Levy - Capital Markets 2.0 - Did We Speak Too Soon?Spencer Levy - Capital Markets 2.0 - Did We Speak Too Soon?
Spencer Levy - Capital Markets 2.0 - Did We Speak Too Soon?
Ryan Slack
 

Similar a Houston marketreport sep12_sf (20)

Houston Market Report July 2010
Houston Market Report July 2010Houston Market Report July 2010
Houston Market Report July 2010
 
Houston Market Report March 2010
Houston Market Report March 2010Houston Market Report March 2010
Houston Market Report March 2010
 
Houston Market Report January 2010
Houston Market Report January 2010Houston Market Report January 2010
Houston Market Report January 2010
 
Houston Market Report May 2010
Houston Market Report May 2010Houston Market Report May 2010
Houston Market Report May 2010
 
Naa Annual Newspaper Ad Expenditures 09
Naa Annual Newspaper Ad Expenditures 09Naa Annual Newspaper Ad Expenditures 09
Naa Annual Newspaper Ad Expenditures 09
 
January 2011 Austin Real Estate Market Stats
January 2011 Austin Real Estate Market StatsJanuary 2011 Austin Real Estate Market Stats
January 2011 Austin Real Estate Market Stats
 
Palm Springs Area Listings Sold By Calendar Quarter (Through March 2010)
Palm Springs Area Listings Sold By Calendar Quarter (Through March 2010)Palm Springs Area Listings Sold By Calendar Quarter (Through March 2010)
Palm Springs Area Listings Sold By Calendar Quarter (Through March 2010)
 
February 2011 Austin Real Estate Stats
February 2011 Austin Real Estate StatsFebruary 2011 Austin Real Estate Stats
February 2011 Austin Real Estate Stats
 
Coldwell Banker C&C Properties Sales Dec 2010
Coldwell Banker C&C Properties Sales Dec 2010Coldwell Banker C&C Properties Sales Dec 2010
Coldwell Banker C&C Properties Sales Dec 2010
 
Vancouver Real Estate December 2012 Stats Package REBGV
Vancouver Real Estate December 2012 Stats Package REBGVVancouver Real Estate December 2012 Stats Package REBGV
Vancouver Real Estate December 2012 Stats Package REBGV
 
REBGV dec 2012 stats package
REBGV dec 2012 stats packageREBGV dec 2012 stats package
REBGV dec 2012 stats package
 
Rebgv june 2012 stats
Rebgv june 2012 statsRebgv june 2012 stats
Rebgv june 2012 stats
 
Caída Publicidad EEUU 2009
Caída Publicidad EEUU 2009Caída Publicidad EEUU 2009
Caída Publicidad EEUU 2009
 
Dalkeith
DalkeithDalkeith
Dalkeith
 
Vancouver real estate february 2012 stats package rebgv
Vancouver real estate february 2012 stats package rebgvVancouver real estate february 2012 stats package rebgv
Vancouver real estate february 2012 stats package rebgv
 
FVREB October 2022 Statistics.pdf
FVREB October 2022 Statistics.pdfFVREB October 2022 Statistics.pdf
FVREB October 2022 Statistics.pdf
 
REBGV Stats Package Oct 2012
REBGV Stats Package Oct 2012REBGV Stats Package Oct 2012
REBGV Stats Package Oct 2012
 
101842285 july-2012-rebgv-stats-package-adam-scalena
101842285 july-2012-rebgv-stats-package-adam-scalena101842285 july-2012-rebgv-stats-package-adam-scalena
101842285 july-2012-rebgv-stats-package-adam-scalena
 
Updated Year to Date Comparison
Updated Year to Date ComparisonUpdated Year to Date Comparison
Updated Year to Date Comparison
 
Spencer Levy - Capital Markets 2.0 - Did We Speak Too Soon?
Spencer Levy - Capital Markets 2.0 - Did We Speak Too Soon?Spencer Levy - Capital Markets 2.0 - Did We Speak Too Soon?
Spencer Levy - Capital Markets 2.0 - Did We Speak Too Soon?
 

Último

BPTP THE AMAARIO For The Royals Of Tomorrow in Sector 37D Gurgaon Dwarka Expr...
BPTP THE AMAARIO For The Royals Of Tomorrow in Sector 37D Gurgaon Dwarka Expr...BPTP THE AMAARIO For The Royals Of Tomorrow in Sector 37D Gurgaon Dwarka Expr...
BPTP THE AMAARIO For The Royals Of Tomorrow in Sector 37D Gurgaon Dwarka Expr...
ApartmentWala1
 
9990771857 Call Girls in Dwarka Sector 6 Delhi (Call Girls) Delhi
9990771857 Call Girls in Dwarka Sector 6 Delhi (Call Girls) Delhi9990771857 Call Girls in Dwarka Sector 6 Delhi (Call Girls) Delhi
9990771857 Call Girls in Dwarka Sector 6 Delhi (Call Girls) Delhi
delhimodel235
 
9990771857 Call Girls in Dwarka Sector 7 Delhi (Call Girls) Delhi
9990771857 Call Girls in Dwarka Sector 7 Delhi (Call Girls) Delhi9990771857 Call Girls in Dwarka Sector 7 Delhi (Call Girls) Delhi
9990771857 Call Girls in Dwarka Sector 7 Delhi (Call Girls) Delhi
delhimodel235
 
9990771857 Call Girls in Dwarka Sector 10 Delhi (Call Girls) Delhi
9990771857 Call Girls in Dwarka Sector 10 Delhi (Call Girls) Delhi9990771857 Call Girls in Dwarka Sector 10 Delhi (Call Girls) Delhi
9990771857 Call Girls in Dwarka Sector 10 Delhi (Call Girls) Delhi
delhimodel235
 
9990771857 Call Girls Dwarka Sector 9 Delhi (Call Girls ) Delhi
9990771857 Call Girls Dwarka Sector 9 Delhi (Call Girls ) Delhi9990771857 Call Girls Dwarka Sector 9 Delhi (Call Girls ) Delhi
9990771857 Call Girls Dwarka Sector 9 Delhi (Call Girls ) Delhi
delhimodel235
 
9990771857 Call Girls in Dwarka Sector 6 Delhi (Call Girls) Delhi
9990771857 Call Girls in Dwarka Sector 6 Delhi (Call Girls) Delhi9990771857 Call Girls in Dwarka Sector 6 Delhi (Call Girls) Delhi
9990771857 Call Girls in Dwarka Sector 6 Delhi (Call Girls) Delhi
delhimodel235
 
9990771857 Call Girls Dwarka Sector 8 Delhi (Call Girls ) Delhi
9990771857 Call Girls  Dwarka Sector 8 Delhi (Call Girls ) Delhi9990771857 Call Girls  Dwarka Sector 8 Delhi (Call Girls ) Delhi
9990771857 Call Girls Dwarka Sector 8 Delhi (Call Girls ) Delhi
delhimodel235
 
9990771857 Call Girls in Dwarka Sector 1 Delhi (Call Girls) Delhi
9990771857 Call Girls in Dwarka Sector 1 Delhi (Call Girls) Delhi9990771857 Call Girls in Dwarka Sector 1 Delhi (Call Girls) Delhi
9990771857 Call Girls in Dwarka Sector 1 Delhi (Call Girls) Delhi
delhimodel235
 

Último (20)

Premium Villa Projects in Sarjapur Road Bengaluru
Premium Villa Projects in Sarjapur Road BengaluruPremium Villa Projects in Sarjapur Road Bengaluru
Premium Villa Projects in Sarjapur Road Bengaluru
 
Greater Vancouver Realtors Statistics Package April 2024
Greater Vancouver Realtors Statistics Package April 2024Greater Vancouver Realtors Statistics Package April 2024
Greater Vancouver Realtors Statistics Package April 2024
 
Kohinoor Teiko Hinjewadi Phase 2 Pune E-Brochure.pdf
Kohinoor Teiko Hinjewadi Phase 2 Pune  E-Brochure.pdfKohinoor Teiko Hinjewadi Phase 2 Pune  E-Brochure.pdf
Kohinoor Teiko Hinjewadi Phase 2 Pune E-Brochure.pdf
 
The Gale at Godrej Park World Hinjewadi Pune Brochure.pdf
The Gale at Godrej Park World Hinjewadi Pune Brochure.pdfThe Gale at Godrej Park World Hinjewadi Pune Brochure.pdf
The Gale at Godrej Park World Hinjewadi Pune Brochure.pdf
 
Nyati Elite NIBM Road Pune E Brochure.pdf
Nyati Elite NIBM Road Pune E Brochure.pdfNyati Elite NIBM Road Pune E Brochure.pdf
Nyati Elite NIBM Road Pune E Brochure.pdf
 
BPTP THE AMAARIO For The Royals Of Tomorrow in Sector 37D Gurgaon Dwarka Expr...
BPTP THE AMAARIO For The Royals Of Tomorrow in Sector 37D Gurgaon Dwarka Expr...BPTP THE AMAARIO For The Royals Of Tomorrow in Sector 37D Gurgaon Dwarka Expr...
BPTP THE AMAARIO For The Royals Of Tomorrow in Sector 37D Gurgaon Dwarka Expr...
 
9990771857 Call Girls in Dwarka Sector 6 Delhi (Call Girls) Delhi
9990771857 Call Girls in Dwarka Sector 6 Delhi (Call Girls) Delhi9990771857 Call Girls in Dwarka Sector 6 Delhi (Call Girls) Delhi
9990771857 Call Girls in Dwarka Sector 6 Delhi (Call Girls) Delhi
 
9990771857 Call Girls in Dwarka Sector 7 Delhi (Call Girls) Delhi
9990771857 Call Girls in Dwarka Sector 7 Delhi (Call Girls) Delhi9990771857 Call Girls in Dwarka Sector 7 Delhi (Call Girls) Delhi
9990771857 Call Girls in Dwarka Sector 7 Delhi (Call Girls) Delhi
 
Rohan Harita Tathawade Pune Brochure.pdf
Rohan Harita Tathawade Pune Brochure.pdfRohan Harita Tathawade Pune Brochure.pdf
Rohan Harita Tathawade Pune Brochure.pdf
 
Purva Soukhyam in Guduvancheri Chennai.pdf
Purva Soukhyam in Guduvancheri Chennai.pdfPurva Soukhyam in Guduvancheri Chennai.pdf
Purva Soukhyam in Guduvancheri Chennai.pdf
 
9990771857 Call Girls in Dwarka Sector 10 Delhi (Call Girls) Delhi
9990771857 Call Girls in Dwarka Sector 10 Delhi (Call Girls) Delhi9990771857 Call Girls in Dwarka Sector 10 Delhi (Call Girls) Delhi
9990771857 Call Girls in Dwarka Sector 10 Delhi (Call Girls) Delhi
 
Ganga Platinum Kharadi Pune brochure.pdf
Ganga Platinum Kharadi Pune brochure.pdfGanga Platinum Kharadi Pune brochure.pdf
Ganga Platinum Kharadi Pune brochure.pdf
 
2k Shot Call girls Karol Bagh Delhi 9205541914
2k Shot Call girls Karol Bagh Delhi 92055419142k Shot Call girls Karol Bagh Delhi 9205541914
2k Shot Call girls Karol Bagh Delhi 9205541914
 
9990771857 Call Girls Dwarka Sector 9 Delhi (Call Girls ) Delhi
9990771857 Call Girls Dwarka Sector 9 Delhi (Call Girls ) Delhi9990771857 Call Girls Dwarka Sector 9 Delhi (Call Girls ) Delhi
9990771857 Call Girls Dwarka Sector 9 Delhi (Call Girls ) Delhi
 
SVN Live 5.6.24 Weekly Property Broadcast
SVN Live 5.6.24 Weekly Property BroadcastSVN Live 5.6.24 Weekly Property Broadcast
SVN Live 5.6.24 Weekly Property Broadcast
 
David Litt Foreclosure Specialist - Your Partner in Real Estate Success
David Litt Foreclosure Specialist - Your Partner in Real Estate SuccessDavid Litt Foreclosure Specialist - Your Partner in Real Estate Success
David Litt Foreclosure Specialist - Your Partner in Real Estate Success
 
9990771857 Call Girls in Dwarka Sector 6 Delhi (Call Girls) Delhi
9990771857 Call Girls in Dwarka Sector 6 Delhi (Call Girls) Delhi9990771857 Call Girls in Dwarka Sector 6 Delhi (Call Girls) Delhi
9990771857 Call Girls in Dwarka Sector 6 Delhi (Call Girls) Delhi
 
Mapusa Beach ( Call Girls ) Goa ✔ 8617370543 ✅ By Goa Call Girls For Pick Up ...
Mapusa Beach ( Call Girls ) Goa ✔ 8617370543 ✅ By Goa Call Girls For Pick Up ...Mapusa Beach ( Call Girls ) Goa ✔ 8617370543 ✅ By Goa Call Girls For Pick Up ...
Mapusa Beach ( Call Girls ) Goa ✔ 8617370543 ✅ By Goa Call Girls For Pick Up ...
 
9990771857 Call Girls Dwarka Sector 8 Delhi (Call Girls ) Delhi
9990771857 Call Girls  Dwarka Sector 8 Delhi (Call Girls ) Delhi9990771857 Call Girls  Dwarka Sector 8 Delhi (Call Girls ) Delhi
9990771857 Call Girls Dwarka Sector 8 Delhi (Call Girls ) Delhi
 
9990771857 Call Girls in Dwarka Sector 1 Delhi (Call Girls) Delhi
9990771857 Call Girls in Dwarka Sector 1 Delhi (Call Girls) Delhi9990771857 Call Girls in Dwarka Sector 1 Delhi (Call Girls) Delhi
9990771857 Call Girls in Dwarka Sector 1 Delhi (Call Girls) Delhi
 

Houston marketreport sep12_sf

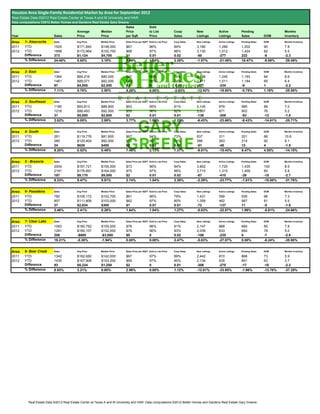
  • 1. Houston Area Single-Family Residential Market by Area for September 2012 Real Estate Data ©2012 Real Estate Center at Texas A and M University and HAR. Data computations ©2012 Better Homes and Gardens Real Estate Gary Greene Sales Sold Average Median Price to List Coop New Active Pending Months Year Sales Price Price per Sqft Price Sales Listings Listings Sales DOM Inventory Area 1- Atascocita Sales Avg Price Median Price Sales Price per SQFT Sold to List Price Coop Sales New Listings Active Listings Pending Sales DOM Months Inventory 2011 YTD 1525 $171,840 $148,000 $67 96% 84% 3,180 1,289 1,202 90 7.8 2012 YTD 1898 $172,964 $152,700 $68 97% 86% 3,130 1,012 1,424 82 5.5 Difference 373 $1,124 $4,700 $1 0.01 0.02 -50 -277 222 -8 -2.3 % Difference 24.46% 0.65% 3.18% 1.49% 1.04% 2.38% -1.57% -21.49% 18.47% -8.89% -29.49% Area 2- East Sales Avg Price Median Price Sales Price per SQFT Sold to List Price Coop Sales New Listings Active Listings Pending Sales DOM Months Inventory 2011 YTD 1364 $84,216 $80,000 $47 96% 76% 2,788 1,245 1,193 84 8.6 2012 YTD 1461 $89,071 $82,000 $49 96% 74% 2,411 1,011 1,184 85 6.4 Difference 97 $4,855 $2,000 $2 0 -0.02 -377 -234 -9 1 -2.2 % Difference 7.11% 5.76% 2.50% 4.26% 0.00% -2.63% -13.52% -18.80% -0.75% 1.19% -25.58% Area 3- Southeast Sales Avg Price Median Price Sales Price per SQFT Sold to List Price Coop Sales New Listings Active Listings Pending Sales DOM Months Inventory 2011 YTD 1185 $93,813 $89,900 $53 95% 81% 2,145 879 985 89 7.0 2012 YTD 1216 $99,493 $92,500 $55 96% 82% 2,007 671 902 76 5.2 Difference 31 $5,680 $2,600 $2 0.01 0.01 -138 -208 -83 -13 -1.8 % Difference 2.62% 6.05% 2.89% 3.77% 1.05% 1.23% -6.43% -23.66% -8.43% -14.61% -25.71% Area 4- South Sales Avg Price Median Price Sales Price per SQFT Sold to List Price Coop Sales New Listings Active Listings Pending Sales DOM Months Inventory 2011 YTD 261 $119,776 $81,600 $67 94% 73% 637 311 201 88 10.6 2012 YTD 285 $120,404 $82,000 $72 96% 74% 586 263 214 92 9.1 Difference 24 $628 $400 $5 0.02 0.01 -51 -48 13 4 -1.5 % Difference 9.20% 0.52% 0.49% 7.46% 2.13% 1.37% -8.01% -15.43% 6.47% 4.55% -14.15% Area: 5 - Brazoria Sales Avg Price Median Price Sales Price per SQFT Sold to List Price Coop Sales New Listings Active Listings Pending Sales DOM Months Inventory 2011 YTD 2004 $167,721 $155,000 $73 96% 84% 3,802 1,725 1,435 100 8.5 2012 YTD 2191 $176,891 $164,000 $75 97% 86% 3,715 1,315 1,409 85 5.8 Difference 187 $9,170 $9,000 $2 0.01 0.02 -87 -410 -26 -15 -2.7 % Difference 9.33% 5.47% 5.81% 2.74% 1.04% 2.38% -2.29% -23.77% -1.81% -15.00% -31.76% Area: 6- Pasadena Sales Avg Price Median Price Sales Price per SQFT Sold to List Price Coop Sales New Listings Active Listings Pending Sales DOM Months Inventory 2011 YTD 780 $109,172 $102,700 $61 96% 79% 1,431 599 556 86 7.3 2012 YTD 807 $111,806 $103,000 $62 97% 80% 1,359 462 567 81 5.5 Difference 27 $2,634 $300 $1 0.01 0.01 -72 -137 11 -5 -1.8 % Difference 3.46% 2.41% 0.29% 1.64% 1.04% 1.27% -5.03% -22.87% 1.98% -5.81% -24.66% Area: 7- Clear Lake Sales Avg Price Median Price Sales Price per SQFT Sold to List Price Coop Sales New Listings Active Listings Pending Sales DOM Months Inventory 2011 YTD 1083 $180,792 $155,000 $78 96% 81% 2,147 868 664 85 7.8 2012 YTD 1291 $180,107 $152,000 $78 96% 83% 2,039 633 664 78 5.0 Difference 208 -$685 -$3,000 $0 0 0.02 -108 -235 0 -7 -2.8 % Difference 19.21% -0.38% -1.94% 0.00% 0.00% 2.47% -5.03% -27.07% 0.00% -8.24% -35.90% Area: 8- Bear Creek Sales Avg Price Median Price Sales Price per SQFT Sold to List Price Coop Sales New Listings Active Listings Pending Sales DOM Months Inventory 2011 YTD 1342 $162,682 $142,000 $67 97% 89% 2,442 810 868 73 5.9 2012 YTD 1435 $167,906 $143,200 $69 97% 90% 2,134 535 851 63 3.7 Difference 93 $5,224 $1,200 $2 0 0.01 -308 -275 -17 -10 -2.2 % Difference 6.93% 3.21% 0.85% 2.99% 0.00% 1.12% -12.61% -33.95% -1.96% -13.70% -37.29% Real Estate Data ©2012 Real Estate Center at Texas A and M University and HAR. Data computations ©2012 Better Homes and Gardens Real Estate Gary Greene.
  • 2. Sales Sold Average Median Price to List Coop New Active Pending Months Year Month Sales Price Price per Sqft Price Sales Listings Listings Sales DOM Inventory Area: 9- The Heights Sales Avg Price Median Price Sales Price per SQFT Sold to List Price Coop Sales New Listings Active Listings Pending Sales DOM Months Inventory 2011 YTD 1449 $264,221 $245,000 $144 96% 84% 2,885 1,098 778 79 7.4 2012 YTD 1783 $288,091 $267,000 $153 98% 83% 2,697 754 899 69 4.4 Difference 334 $23,870 $22,000 $9 0.02 -0.01 -188 -344 121 -10 -3 % Difference 23.05% 9.03% 8.98% 6.25% 2.08% -1.19% -6.52% -31.33% 15.55% -12.66% -40.54% 10- Hempstead Area: East Sales Avg Price Median Price Sales Price per SQFT Sold to List Price Coop Sales New Listings Active Listings Pending Sales DOM Months Inventory 2011 YTD 1221 $169,723 $150,000 $69 96% 88% 2,353 836 742 85 6.2 2012 YTD 1375 $177,732 $159,700 $71 97% 91% 2,215 605 751 66 4.4 Difference 154 $8,009 $9,700 $2 0.01 0.03 -138 -231 9 -19 -1.8 % Difference 12.61% 4.72% 6.47% 2.90% 1.04% 3.41% -5.86% -27.63% 1.21% -22.35% -29.03% Area: 11-Near North Sales Avg Price Median Price Sales Price per SQFT Sold to List Price Coop Sales New Listings Active Listings Pending Sales DOM Months Inventory 2011 YTD 621 $89,899 $79,900 $48 96% 85% 1,119 430 496 80 6.2 2012 YTD 651 $94,569 $85,000 $50 96% 84% 1,039 316 478 73 4.6 Difference 30 $4,670 $5,100 $2 0 -0.01 -80 -114 -18 -7 -1.6 % Difference 4.83% 5.19% 6.38% 4.17% 0.00% -1.18% -7.15% -26.51% -3.63% -8.75% -25.81% Area: 12- North Sales Avg Price Median Price Sales Price per SQFT Sold to List Price Coop Sales New Listings Active Listings Pending Sales DOM Months Inventory 2011 YTD 1137 $89,782 $80,000 $46 97% 85% 1,967 709 1,011 83 5.8 2012 YTD 1135 $92,666 $83,000 $47 97% 87% 1,737 491 885 71 4.0 Difference -2 $2,884 $3,000 $1 0 0.02 -230 -218 -126 -12 -1.8 % Difference -0.18% 3.21% 3.75% 2.17% 0.00% 2.35% -11.69% -30.75% -12.46% -14.46% -31.03% Area: 13- Northwest Sales Avg Price Median Price Sales Price per SQFT Sold to List Price Coop Sales New Listings Active Listings Pending Sales DOM Months Inventory 2011 YTD 1619 $157,444 $132,500 $60 96% 88% 3,149 1,255 1,138 90 7.4 2012 YTD 1912 $168,723 $139,900 $62 96% 88% 3,108 955 1,196 77 5.0 Difference 293 $11,279 $7,400 $2 0 0 -41 -300 58 -13 -2.4 % Difference 18.10% 7.16% 5.58% 3.33% 0.00% 0.00% -1.30% -23.90% 5.10% -14.44% -32.43% 14- Far Area: Northwest Sales Avg Price Median Price Sales Price per SQFT Sold to List Price Coop Sales New Listings Active Listings Pending Sales DOM Months Inventory 2011 YTD 1301 $207,026 $156,010 $79 95% 89% 2,431 959 813 94 7.3 2012 YTD 1715 $219,499 $170,000 $82 96% 89% 2,627 787 1,016 76 5.0 Difference 414 $12,473 $13,990 $3 0.01 0 196 -172 203 -18 -2.3 % Difference 31.82% 6.02% 8.97% 3.80% 1.05% 0.00% 8.06% -17.94% 24.97% -19.15% -31.51% 15-Montgomery Area: County Southwest Sales Avg Price Median Price Sales Price per SQFT Sold to List Price Coop Sales New Listings Active Listings Pending Sales DOM Months Inventory 2011 YTD 2626 $294,369 $212,140 $106 96% 85% 4,826 1,730 1,706 81 6.5 2012 YTD 2955 $292,129 $228,000 $106 96% 85% 4,566 1,303 1,776 68 4.5 Difference 329 -$2,240 $15,860 $0 0 0 -260 -427 70 -13 -2 % Difference 12.53% -0.76% 7.48% 0.00% 0.00% 0.00% -5.39% -24.68% 4.10% -16.05% -30.77% 16- Central Inner Area: Loop Sales Avg Price Median Price Sales Price per SQFT Sold to List Price Coop Sales New Listings Active Listings Pending Sales DOM Months Inventory 2011 YTD 587 $617,447 $415,000 $225 95% 80% 1,221 509 217 94 8.5 2012 YTD 734 $638,092 $420,000 $230 96% 84% 1,166 381 334 95 5.6 Difference 147 $20,645 $5,000 $5 0.01 0.04 -55 -128 117 1 -2.9 % Difference 25.04% 3.34% 1.20% 2.22% 1.05% 5.00% -4.50% -25.15% 53.92% 1.06% -34.12% Real Estate Data ©2012 Real Estate Center at Texas A and M University and HAR. Data computations ©2012 Better Homes and Gardens Real Estate Gary Greene.
  • 3. Sales Sold Average Median Price to List Coop New Active Pending Months Year Month Sales Price Price per Sqft Price Sales Listings Listings Sales DOM Inventory 17-Southwest Area: Inner Loop Sales Avg Price Median Price Sales Price per SQFT Sold to List Price Coop Sales New Listings Active Listings Pending Sales DOM Months Inventory 2011 YTD 755 $692,178 $620,000 $225 95% 85% 1,379 491 189 82 6.1 2012 YTD 813 $692,225 $645,000 $228 96% 82% 1,289 387 252 70 4.7 Difference 58 $47 $25,000 $3 0.01 -0.03 -90 -104 63 -12 -1.4 % Difference 7.68% 0.01% 4.03% 1.33% 1.05% -3.53% -6.53% -21.18% 33.33% -14.63% -22.95% 18- South Area: Central Sales Avg Price Median Price Sales Price per SQFT Sold to List Price Coop Sales New Listings Active Listings Pending Sales DOM Months Inventory 2011 YTD 186 $93,823 $75,000 $57 96% 83% 305 113 152 81 6.2 2012 YTD 194 $101,423 $74,500 $59 97% 87% 317 83 147 62 4.2 Difference 8 $7,600 -$500 $2 0.01 0.04 12 -30 -5 -19 -2.0 % Difference 4.30% 8.10% -0.67% 3.51% 1.04% 4.82% 3.93% -26.55% -3.29% -23.46% -32.26% 19- Montgomery Area: County Northeast Sales Avg Price Median Price Sales Price per SQFT Sold to List Price Coop Sales New Listings Active Listings Pending Sales DOM Months Inventory 2011 YTD 548 $139,433 $115,820 $67 95% 78% 1,018 432 429 94 7.1 2012 YTD 673 $145,445 $116,000 $69 96% 76% 1,098 393 446 84 6.0 Difference 125 $6,012 $180 $2 0.01 -0.02 80 -39 17 -10 -1.1 % Difference 22.81% 4.31% 0.16% 2.99% 1.05% -2.56% 7.86% -9.03% 3.96% -10.64% -15.49% Area: 20- Bellaire South Sales Avg Price Median Price Sales Price per SQFT Sold to List Price Coop Sales New Listings Active Listings Pending Sales DOM Months Inventory 2011 YTD 616 $179,215 $153,250 $87 95% 86% 1,260 440 345 72 6.8 2012 YTD 750 $195,216 $165,000 $91 96% 85% 1,180 331 410 71 4.6 Difference 134 $16,001 $11,750 $4 0.01 -0.01 -80 -109 65 -1 -2.2 % Difference 21.75% 8.93% 7.67% 4.60% 1.05% -1.16% -6.35% -24.77% 18.84% -1.39% -32.35% Area: 21-Bellaire West Sales Avg Price Median Price Sales Price per SQFT Sold to List Price Coop Sales New Listings Active Listings Pending Sales DOM Months Inventory 2011 YTD 154 $110,927 $105,000 $61 94% 88% 277 98 105 75 6.0 2012 YTD 148 $108,088 $105,000 $60 96% 80% 266 69 92 49 4.5 Difference -6 -$2,839 $0 -$1 0.02 -0.08 -11 -29 -13 -26 -1.5 % Difference -3.90% -2.56% 0.00% -1.64% 2.13% -9.09% -3.97% -29.59% -12.38% -34.67% -25.00% 22 - Central West Area: Sales Avg Price Median Price Sales Price per SQFT Sold to List Price Coop Sales New Listings Active Listings Pending Sales DOM Months Inventory 2011 YTD 357 $693,216 $490,000 $209 94% 85% 730 311 127 106 8.4 2012 YTD 439 $715,192 $523,500 $212 94% 85% 696 235 142 93 5.6 Difference 82 $21,976 $33,500 $3 0 0 -34 -76 15 -13 -2.8 % Difference 22.97% 3.17% 6.84% 1.44% 0.00% 0.00% -4.66% -24.44% 11.81% -12.26% -33.33% Area: 23- Memorial Sales Avg Price Median Price Sales Price per SQFT Sold to List Price Coop Sales New Listings Active Listings Pending Sales DOM Months Inventory 2011 YTD 506 $836,990 $575,000 $225 95% 84% 830 259 155 65 5.0 2012 YTD 510 $955,340 $660,000 $243 95% 86% 740 190 163 62 3.6 Difference 4 $118,350 $85,000 $18 0 0.02 -90 -69 8 -3 -1.4 % Difference 0.79% 14.14% 14.78% 8.00% 0.00% 2.38% -10.84% -26.64% 5.16% -4.62% -28.00% 24 - Spring Area: Branch Sales Avg Price Median Price Sales Price per SQFT Sold to List Price Coop Sales New Listings Active Listings Pending Sales DOM Months Inventory 2011 YTD 524 $246,477 $172,980 $116 96% 86% 1,002 367 268 84 7.0 2012 YTD 569 $274,564 $185,900 $124 97% 88% 910 249 297 70 4.2 Difference 45 $28,087 $12,920 $8 0.01 0.02 -92 -118 29 -14 -2.8 % Difference 8.59% 11.40% 7.47% 6.90% 1.04% 2.33% -9.18% -32.15% 10.82% -16.67% -40.00% Real Estate Data ©2012 Real Estate Center at Texas A and M University and HAR. Data computations ©2012 Better Homes and Gardens Real Estate Gary Greene.
  • 4. Sales Sold Average Median Price to List Coop New Active Pending Months Year Month Sales Price Price per Sqft Price Sales Listings Listings Sales DOM Inventory Area: 25- Far West Sales Avg Price Median Price Sales Price per SQFT Sold to List Price Coop Sales New Listings Active Listings Pending Sales DOM Months Inventory 2011 YTD 1986 $143,064 $117,000 $63 96% 89% 3,401 1,227 1,575 87 5.9 2012 YTD 2153 $151,585 $124,620 $66 97% 89% 3,205 908 1,501 74 4.0 Difference 167 $8,521 $7,620 $3 0.01 0 -196 -319 -74 -13 -1.9 % Difference 8.41% 5.96% 6.51% 4.76% 1.04% 0.00% -5.76% -26.00% -4.70% -14.94% -32.20% Area: 26- Waller County Sales Avg Price Median Price Sales Price per SQFT Sold to List Price Coop Sales New Listings Active Listings Pending Sales DOM Months Inventory 2011 YTD 135 $127,559 $105,000 $65 95% 64% 313 152 112 124 10.4 2012 YTD 135 $145,276 $119,900 $73 93% 67% 276 138 96 112 9.5 Difference 0 $17,717 $14,900 $8 -0.02 0.03 -37 -14 -16 -12 -0.9 % Difference 0.00% 13.89% 14.19% 12.31% -2.11% 4.69% -11.82% -9.21% -14.29% -9.68% -8.65% Area: 28- Alief Area Sales Avg Price Median Price Sales Price per SQFT Sold to List Price Coop Sales New Listings Active Listings Pending Sales DOM Months Inventory 2011 YTD 467 $91,820 $80,000 $48 95% 88% 816 293 334 80 5.8 2012 YTD 484 $98,774 $85,000 $51 96% 87% 786 234 328 73 4.6 Difference 17 $6,954 $5,000 $3 0.01 -0.01 -30 -59 -6 -7 -1.2 % Difference 3.64% 7.57% 6.25% 6.25% 1.05% -1.14% -3.68% -20.14% -1.80% -8.75% -20.69% 29 - Fort Bend - Sugar Area: Land/Stafford Sales Avg Price Median Price Sales Price per SQFT Sold to List Price Coop Sales New Listings Active Listings Pending Sales DOM Months Inventory 2011 YTD 1129 $285,212 $249,000 $97 94% 89% 2,141 733 670 76 6.3 2012 YTD 1334 $282,393 $236,000 $97 96% 88% 2,269 567 827 64 4.4 Difference 205 -$2,819 -$13,000 $0 0.02 -0.01 128 -166 157 -12 -1.9 % Difference 18.16% -0.99% -5.22% 0.00% 2.13% -1.12% 5.98% -22.65% 23.43% -15.79% -30.16% 30 - Fort Bend East - Missouri Area: City Sales Avg Price Median Price Sales Price per SQFT Sold to List Price Coop Sales New Listings Active Listings Pending Sales DOM Months Inventory 2011 YTD 1055 $224,624 $194,900 $83 95% 84% 1,949 754 748 86 7.0 2012 YTD 1248 $233,710 $210,000 $85 96% 86% 2,008 688 820 85 5.5 Difference 193 $9,086 $15,100 $2 0.01 0.02 59 -66 72 -1 -1.5 % Difference 18.29% 4.04% 7.75% 2.41% 1.05% 2.38% 3.03% -8.75% 9.63% -1.16% -21.43% Area: 31-West Sales Avg Price Median Price Sales Price per SQFT Sold to List Price Coop Sales New Listings Active Listings Pending Sales DOM Months Inventory 2011 YTD 507 $311,984 $232,000 $112 97% 89% 1,013 356 304 76 6.4 2012 YTD 645 $316,884 $234,000 $112 97% 86% 981 271 362 64 4.6 Difference 138 $4,900 $2,000 $0 0 -0.03 -32 -85 58 -12 -1.8 % Difference 27.22% 1.57% 0.86% 0.00% 0.00% -3.37% -3.16% -23.88% 19.08% -15.79% -28.13% 32- Far Area: Northeast Sales Avg Price Median Price Sales Price per SQFT Sold to List Price Coop Sales New Listings Active Listings Pending Sales DOM Months Inventory 2011 YTD 767 $212,555 $169,900 $79 96% 74% 1,318 491 525 84 6.4 2012 YTD 842 $217,455 $175,000 $81 97% 78% 1,420 423 544 68 5.2 Difference 75 $4,900 $5,100 $2 0.01 0.04 102 -68 19 -16 -1.2 % Difference 9.78% 2.31% 3.00% 2.53% 1.04% 5.41% 7.74% -13.85% 3.62% -19.05% -18.75% Area: 33- Galveston Sales Avg Price Median Price Sales Price per SQFT Sold to List Price Coop Sales New Listings Active Listings Pending Sales DOM Months Inventory 2011 YTD 2460 $193,488 $161,000 $88 94% 77% 5,389 2,726 1,533 107 10.7 2012 YTD 2896 $197,987 $169,000 $89 95% 80% 5,268 2,186 1,690 99 7.6 Difference 436 $4,499 $8,000 $1 0.01 0.03 -121 -540 157 -8 -3.1 % Difference 17.72% 2.33% 4.97% 1.14% 1.06% 3.90% -2.25% -19.81% 10.24% -7.48% -28.97% Real Estate Data ©2012 Real Estate Center at Texas A and M University and HAR. Data computations ©2012 Better Homes and Gardens Real Estate Gary Greene.
  • 5. Sales Sold Average Median Price to List Coop New Active Pending Months Year Month Sales Price Price per Sqft Price Sales Listings Listings Sales DOM Inventory 34- Aldine Area: Westfield Sales Avg Price Median Price Sales Price per SQFT Sold to List Price Coop Sales New Listings Active Listings Pending Sales DOM Months Inventory 2011 YTD 179 $68,269 $62,900 $45 95% 72% 365 178 137 104 9.2 2012 YTD 185 $67,025 $58,550 $44 95% 74% 335 129 143 69 6.9 Difference 6 -$1,244 -$4,350 -$1 0 0.02 -30 -49 6 -35 -2.3 % Difference 3.35% -1.82% -6.92% -2.22% 0.00% 2.78% -8.22% -27.53% 4.38% -33.65% -25.00% 35- Hempstead Area: West Sales Avg Price Median Price Sales Price per SQFT Sold to List Price Coop Sales New Listings Active Listings Pending Sales DOM Months Inventory 2011 YTD 1052 $214,898 $170,110 $78 96% 90% 1,786 686 611 98 6.6 2012 YTD 1191 $214,719 $175,900 $79 96% 91% 1,864 562 626 76 4.7 Difference 139 -$179 $5,790 $1 0 0.01 78 -124 15 -22 -1.9 % Difference 13.21% -0.08% 3.40% 1.28% 0.00% 1.11% 4.37% -18.08% 2.45% -22.45% -28.79% 36 - South Katy Area: Area Sales Avg Price Median Price Sales Price per SQFT Sold to List Price Coop Sales New Listings Active Listings Pending Sales DOM Months Inventory 2011 YTD 2249 $275,450 $243,500 $92 96% 91% 3,608 1,028 1,337 69 4.5 2012 YTD 2701 $282,761 $252,750 $93 96% 91% 3,742 896 1,555 65 3.5 Difference 452 $7,311 $9,250 $1 0 0 134 -132 218 -4 -1 % Difference 20.10% 2.65% 3.80% 1.09% 0.00% 0.00% 3.71% -12.84% 16.31% -5.80% -22.22% 37 - Fort Bend Area: West Sales Avg Price Median Price Sales Price per SQFT Sold to List Price Coop Sales New Listings Active Listings Pending Sales DOM Months Inventory 2011 YTD 1355 $180,311 $155,990 $70 95% 90% 2,671 1,046 933 91 7.6 2012 YTD 1677 $178,659 $157,200 $71 96% 88% 2,734 838 1,135 83 5.2 Difference 322 -$1,652 $1,210 $1 0.01 -0.02 63 -208 202 -8 -2.4 % Difference 23.76% -0.92% 0.78% 1.43% 1.05% -2.22% 2.36% -19.89% 21.65% -8.79% -31.58% 38 - Fort Bend Area: East Sales Avg Price Median Price Sales Price per SQFT Sold to List Price Coop Sales New Listings Active Listings Pending Sales DOM Months Inventory 2011 YTD 1055 $169,669 $132,500 $68 96% 85% 2,041 795 821 85 7.2 2012 YTD 1200 $184,086 $154,750 $71 96% 89% 1,909 574 911 75 4.7 Difference 145 $14,417 $22,250 $3 0 0.04 -132 -221 90 -10 -2.5 % Difference 13.74% 8.50% 16.79% 4.41% 0.00% 4.71% -6.47% -27.80% 10.96% -11.76% -34.72% 39 - Montgomery Area: County Northwest Sales Avg Price Median Price Sales Price per SQFT Sold to List Price Coop Sales New Listings Active Listings Pending Sales DOM Months Inventory 2011 YTD 818 $250,908 $175,000 $100 95% 82% 1,903 937 478 107 10.5 2012 YTD 968 $264,422 $198,390 $104 95% 79% 1,964 857 597 104 9.5 Difference 150 $13,514 $23,390 $4 0 -0.03 61 -80 119 -3 -1.0 % Difference 18.34% 5.39% 13.37% 4.00% 0.00% -3.66% 3.21% -8.54% 24.90% -2.80% -9.52% 40 - Montgomery Area: County Southeast Sales Avg Price Median Price Sales Price per SQFT Sold to List Price Coop Sales New Listings Active Listings Pending Sales DOM Months Inventory 2011 YTD 504 $204,616 $168,000 $82 95% 81% 862 383 345 95 7.7 2012 YTD 542 $207,296 $185,000 $84 96% 80% 980 363 392 94 6.4 Difference 38 $2,680 $17,000 $2 0.01 -0.01 118 -20 47 -1 -1.3 % Difference 7.54% 1.31% 10.12% 2.44% 1.05% -1.23% 13.69% -5.22% 13.62% -1.05% -16.88% 41 - Montgomery Area: County Northwest Sales Avg Price Median Price Sales Price per SQFT Sold to List Price Coop Sales New Listings Active Listings Pending Sales DOM Months Inventory 2011 YTD 19 $92,232 $75,000 $52 94% 74% 43 28 11 105 18.1 2012 YTD 14 $120,050 $85,450 $68 95% 43% 33 21 6 78 11.7 Difference -5 $27,818 $10,450 $16 0.01 -0.31 -10 -7 -5 -27 -6.4 % Difference -26.32% 30.16% 13.93% 30.77% 1.06% -41.89% -23.26% -25.00% -45.45% -25.71% -35.36% Real Estate Data ©2012 Real Estate Center at Texas A and M University and HAR. Data computations ©2012 Better Homes and Gardens Real Estate Gary Greene.
  • 6. Sales Sold Average Median Price to List Coop New Active Pending Months Year Month Sales Price Price per Sqft Price Sales Listings Listings Sales DOM Inventory Area: 42 - Liberty County Sales Avg Price Median Price Sales Price per SQFT Sold to List Price Coop Sales New Listings Active Listings Pending Sales DOM Months Inventory 2011 YTD 58 $107,466 $70,000 $64 93% 40% 207 135 35 139 20.1 2012 YTD 81 $83,395 $53,000 $55 93% 36% 216 135 57 150 20.2 Difference 23 -$24,071 -$17,000 -$9 0 -0.04 9 0 22 11 0.1 % Difference 39.66% -22.40% -24.29% -14.06% 0.00% -10.00% 4.35% 0.00% 62.86% 7.91% 0.50% Area: 43 - Walker County Sales Avg Price Median Price Sales Price per SQFT Sold to List Price Coop Sales New Listings Active Listings Pending Sales DOM Months Inventory 2011 YTD 174 $138,687 $129,200 $74 95% 55% 407 206 129 113 11.6 2012 YTD 201 $124,742 $120,000 $71 95% 53% 392 208 133 115 10.5 Difference 27 -$13,945 -$9,200 -$3 0 -0.02 -15 2 4 2 -1.1 % Difference 15.52% -10.06% -7.12% -4.05% 0.00% -3.64% -3.69% 0.97% 3.10% 1.77% -9.48% Area: 44 - Polk County Sales Avg Price Median Price Sales Price per SQFT Sold to List Price Coop Sales New Listings Active Listings Pending Sales DOM Months Inventory 2011 YTD 258 $149,629 $118,000 $87 93% 60% 586 392 153 151 15.2 2012 YTD 243 $144,111 $110,000 $83 91% 49% 589 388 147 146 15.1 Difference -15 -$5,518 -$8,000 -$4 -0.02 -0.11 3 -4 -6 -5 -0.1 % Difference -5.81% -3.69% -6.78% -4.60% -2.15% -18.33% 0.51% -1.02% -3.92% -3.31% -0.66% Area: 45 Sales Avg Price Median Price Sales Price per SQFT Sold to List Price Coop Sales New Listings Active Listings Pending Sales DOM Months Inventory 2011 YTD 10 $61,343 $69,750 $36 95% 90% 12 6 8 53 7.4 2012 YTD 9 $74,939 $69,000 $47 97% 78% 22 5 10 63 4.6 Difference -1 $13,596 -$750 $11 0.02 -0.12 10 -1 2 10 -2.8 % Difference -10.00% 22.16% -1.08% 30.56% 2.11% -13.33% 83.33% -16.67% 25.00% 18.87% -37.84% Area: 46 Sales Avg Price Median Price Sales Price per SQFT Sold to List Price Coop Sales New Listings Active Listings Pending Sales DOM Months Inventory 2011 YTD 8 $44,987 $39,880 $26 95% 50% 7 7 8 159 12.6 2012 YTD 9 $66,862 $58,950 $29 76% 33% 7 8 6 134 5.3 Difference 1 $21,875 $19,070 $3 -0.19 -0.17 0 1 -2 -25 -7.3 % Difference 12.50% 48.63% 47.82% 11.54% -20.00% -34.00% 0.00% 14.29% -25.00% -15.72% -57.94% Area: 47 Sales Avg Price Median Price Sales Price per SQFT Sold to List Price Coop Sales New Listings Active Listings Pending Sales DOM Months Inventory 2011 YTD 1 $100,000 $100,000 $56 100% 100% 0 0 14 0 0.0 2012 YTD 2 $77,000 $77,000 $39 98% 100% 1 1 0 38 6.0 Difference 1 -$23,000 -$23,000 -$17 -0.02 0 1 1 -14 38 6 % Difference 100.00% -23.00% -23.00% -30.36% -2.00% 0.00% 100.00% 100.00% n/a n/a 1200.00% Area: 48 Sales Avg Price Median Price Sales Price per SQFT Sold to List Price Coop Sales New Listings Active Listings Pending Sales DOM Months Inventory 2011 YTD 25 $96,174 $104,000 $54 93% 36% 65 42 10 91 14.1 2012 YTD 27 $87,996 $75,000 $51 93% 26% 78 58 18 149 22.6 Difference 2 -$8,178 -$29,000 -$3 0 -0.1 13 16 8 58 8.5 % Difference 8.00% -8.50% -27.88% -5.56% 0.00% -27.78% 20.00% 38.10% 80.00% 63.74% 60.28% Area: 49 Sales Avg Price Median Price Sales Price per SQFT Sold to List Price Coop Sales New Listings Active Listings Pending Sales DOM Months Inventory 2011 YTD 11 $95,935 $102,560 $53 95% 73% 20 17 13 104 23.4 2012 YTD 20 $130,477 $118,480 $69 97% 50% 29 16 13 79 8.7 Difference 9 $34,542 $15,920 $16 0.02 -0.23 9 -1 0 -25 -14.7 % Difference 81.82% 36.01% 15.52% 30.19% 2.11% -31.51% 1500.00% -5.88% 0.00% -24.04% -62.82% Area: 50 Sales Avg Price Median Price Sales Price per SQFT Sold to List Price Coop Sales New Listings Active Listings Pending Sales DOM Months Inventory 2011 YTD 14 $48,582 $52,390 $29 93% 86% 9 12 16 96 33.3 2012 YTD 16 $51,766 $53,280 $29 89% 81% 9 3 18 160 1.6 Difference 2 $3,184 $890 $0 -0.04 -0.05 0 -9 2 64 -31.7 % Difference 14.29% 6.55% 1.70% 0.00% -4.30% -5.81% 0.00% -75.00% 12.50% 66.67% -95.20% Area: 51 Sales Avg Price Median Price Sales Price per SQFT Sold to List Price Coop Sales New Listings Active Listings Pending Sales DOM Months Inventory 2011 YTD 35 $107,985 $51,200 $45 91% 71% 49 23 56 110 6.9 2012 YTD 48 $83,092 $64,250 $45 92% 88% 84 31 57 76 6.2 Difference 13 -$24,893 $13,050 $14 0.01 0.17 35 8 1 -34 -0.7 % Difference 37.14% -23.05% 25.49% 0.00% 1.10% 23.94% 71.43% 34.78% 1.79% -30.91% -10.14% Real Estate Data ©2012 Real Estate Center at Texas A and M University and HAR. Data computations ©2012 Better Homes and Gardens Real Estate Gary Greene.
  • 7. Sales Sold Average Median Price to List Coop New Active Pending Months Year Month Sales Price Price per Sqft Price Sales Listings Listings Sales DOM Inventory Area: 52 - Liberty County Sales Avg Price Median Price Sales Price per SQFT Sold to List Price Coop Sales New Listings Active Listings Pending Sales DOM Months Inventory 2011 YTD 236 $85,847 $72,000 $50 95% 51% 552 297 205 100 13.2 2012 YTD 228 $100,776 $84,980 $55 95% 55% 541 268 199 116 10.3 Difference -8 $14,929 $12,980 $5 0 0.04 -11 -29 -6 16 -2.9 % Difference -3.39% 17.39% 18.03% 10.00% 0.00% 7.84% -1.99% -9.76% -2.93% 16.00% -21.97% 53 - Chambers Area: County Sales Avg Price Median Price Sales Price per SQFT Sold to List Price Coop Sales New Listings Active Listings Pending Sales DOM Months Inventory 2011 YTD 199 $174,030 $172,900 $77 97% 79% 394 209 122 107 9.2 2012 YTD 236 $185,960 $187,500 $78 97% 74% 420 179 146 97 7.5 Difference 37 $11,930 $14,600 $1 0 -0.05 26 -30 24 -10 -1.7 % Difference 18.59% 6.86% 8.44% 1.30% 0.00% -6.33% 6.60% -14.35% 19.67% -9.35% -18.48% Area: 54 Sales Avg Price Median Price Sales Price per SQFT Sold to List Price Coop Sales New Listings Active Listings Pending Sales DOM Months Inventory 2011 YTD 35 $142,914 $123,000 $90 92% 54% 141 127 30 116 36.6 2012 YTD 53 $141,670 $134,000 $97 93% 51% 155 135 43 175 27.0 Difference 18 -$1,244 $11,000 $7 0.01 -0.03 14 8 13 59 -9.6 % Difference 51.43% -0.87% 8.94% 7.78% 1.09% -5.56% 9.93% 6.30% 43.33% 50.86% -26.23% Area: 55 - Wharton County Sales Avg Price Median Price Sales Price per SQFT Sold to List Price Coop Sales New Listings Active Listings Pending Sales DOM Months Inventory 2011 YTD 89 $96,889 $90,000 $58 93% 48% 194 134 62 131 14.3 2012 YTD 114 $109,423 $92,300 $63 93% 43% 210 122 71 121 10.6 Difference 25 $12,534 $2,300 $5 0 -0.05 16 -12 9 -10 -3.7 % Difference 28.09% 12.94% 2.56% 8.62% 0.00% -10.42% 8.25% -8.96% 14.52% -7.63% -25.87% Area: 56 Sales Avg Price Median Price Sales Price per SQFT Sold to List Price Coop Sales New Listings Active Listings Pending Sales DOM Months Inventory 2011 YTD 26 $113,270 $86,000 $60 88% 50% 64 43 19 113 12.5 2012 YTD 27 $109,745 $75,000 $63 95% 41% 83 45 16 68 18.2 Difference 1 -$3,525 -$11,000 $3 0.07 -0.09 19 2 -3 -45 5.7 % Difference 3.85% -3.11% -12.79% 5.00% 7.95% -18.00% 29.69% 4.65% -15.79% -39.82% 45.60% 57 - Austin County Area: Sales Avg Price Median Price Sales Price per SQFT Sold to List Price Coop Sales New Listings Active Listings Pending Sales DOM Months Inventory 2011 YTD 89 $141,093 $135,500 $74 93% 72% 206 159 65 138 17.1 2012 YTD 86 $168,230 $154,500 $85 95% 63% 202 115 65 135 13.3 Difference -3 $27,137 $19,000 $11 0.02 -0.09 -4 -44 0 -3 -3.8 % Difference -3.37% 19.23% 14.02% 14.86% 2.15% -12.50% -1.94% -27.67% 0.00% -2.17% -22.22% Area: 58 Sales Avg Price Median Price Sales Price per SQFT Sold to List Price Coop Sales New Listings Active Listings Pending Sales DOM Months Inventory 2011 YTD 58 $158,578 $135,500 $84 93% 50% 135 71 28 111 11.2 2012 YTD 79 $151,475 $139,000 $86 96% 70% 146 66 44 81 8.4 Difference 21 -$7,103 $3,500 $2 0.03 0.2 11 -5 16 -30 -2.8 % Difference 36.21% -4.48% 2.58% 2.38% 3.23% 40.00% 8.15% -7.04% 57.14% -27.03% -25.00% Area: 59 Sales Avg Price Median Price Sales Price per SQFT Sold to List Price Coop Sales New Listings Active Listings Pending Sales DOM Months Inventory 2011 YTD 5 $127,330 $116,000 $76 97% 80% 3 9 2 82 10.7 2012 YTD 6 $83,817 $56,500 $60 96% 67% 7 6 3 107 8.0 Difference 1 -$43,513 -$59,500 -$16 -0.01 -0.13 4 -3 3 25 -2.7 % Difference 20.00% -34.17% -51.29% -21.05% -1.03% -16.25% 133.33% -33.33% 300.00% 30.49% -25.23% Real Estate Data ©2012 Real Estate Center at Texas A and M University and HAR. Data computations ©2012 Better Homes and Gardens Real Estate Gary Greene.
  • 8. Sales Sold Average Median Price to List Coop New Active Pending Months Year Month Sales Price Price per Sqft Price Sales Listings Listings Sales DOM Inventory Area: 60 Sales Avg Price Median Price Sales Price per SQFT Sold to List Price Coop Sales New Listings Active Listings Pending Sales DOM Months Inventory 2011 YTD 26 $87,023 $70,000 $60 94% 58% 89 51 17 152 12.2 2012 YTD 45 $101,926 $55,000 $63 94% 40% 117 60 41 123 16.2 Difference 19 $14,903 -$15,000 $3 0 -0.18 28 9 24 -29 4 % Difference 73.08% 17.13% -21.43% 5.00% 0.00% -31.03% 31.46% 17.65% 141.18% -19.08% 32.79% Area: 61 Sales Avg Price Median Price Sales Price per SQFT Sold to List Price Coop Sales New Listings Active Listings Pending Sales DOM Months Inventory 2011 YTD 59 $182,532 $154,000 $90 97% 80% 105 48 37 81 7.6 2012 YTD 77 $191,006 $156,250 $90 97% 90% 150 52 53 96 7.3 Difference 18 $8,474 $2,250 $0 0 0.1 45 4 16 15 -0.3 % Difference 30.51% 4.64% 1.46% 0.00% 0.00% 12.50% 42.86% 8.33% 43.24% 18.52% -3.95% Area: 62 Sales Avg Price Median Price Sales Price per SQFT Sold to List Price Coop Sales New Listings Active Listings Pending Sales DOM Months Inventory 2011 YTD 24 $86,204 $76,500 $53 95% 13% 36 22 19 137 8.8 2012 YTD 20 $106,766 $124,250 $60 94% 35% 43 18 21 68 6.0 Difference -4 $20,562 $47,750 $7 -1% 22% 7 -4 2 -69 -2.8 % Difference -16.67% 23.85% 62.42% 13.21% -1.05% 169.23% 19.44% -18.18% 10.53% -50.36% -31.82% Area: 63 Sales Avg Price Median Price Sales Price per SQFT Sold to List Price Coop Sales New Listings Active Listings Pending Sales DOM Months Inventory 2011 YTD 20 $103,450 $87,500 $61 90% 30% 37 33 15 248 11.6 2012 YTD 13 $125,077 $118,000 $71 91% 0% 34 40 11 122 38.7 Difference -7 $21,627 $30,500 $10 0.01 -0.3 -3 7 -4 -126 27.1 % Difference -35.00% 20.91% 34.86% 16.39% 1.11% -100.00% -8.11% 21.21% -26.67% -50.81% 233.62% 64 - San Jacinto Area: County Sales Avg Price Median Price Sales Price per SQFT Sold to List Price Coop Sales New Listings Active Listings Pending Sales DOM Months Inventory 2011 YTD 122 $175,062 $116,750 $91 92% 50% 295 199 84 160 16.6 2012 YTD 144 $161,540 $115,000 $96 93% 56% 342 206 81 134 14.7 Difference 22 -$13,522 -$1,750 $5 0.01 0.06 47 7 -3 -26 -1.9 % Difference 18.03% -7.72% -1.50% 5.49% 1.09% 12.00% 15.93% 3.52% -3.57% -16.25% -11.45% Area: 65 Sales Avg Price Median Price Sales Price per SQFT Sold to List Price Coop Sales New Listings Active Listings Pending Sales DOM Months Inventory 2011 YTD 2 $103,500 $103,500 $90 94% 100% 4 9 2 44 29.5 2012 YTD 3 $194,000 $192,000 $121 90% 33% 1 6 2 196 22.0 Difference 1 $90,500 $88,500 $31 -4% -67% -3 -3 0 152 -7.5 % Difference 50.00% 87.44% 85.51% 34.44% -4.26% 100% -75.00% -33.33% 0.00% 345.45% -25.42% Area: 66 Sales Avg Price Median Price Sales Price per SQFT Sold to List Price Coop Sales New Listings Active Listings Pending Sales DOM Months Inventory 2011 YTD 1 $45,000 $45,000 $21 94% 0% 1 1 12 12 12.0 Area: 67 Sales Avg Price Median Price Sales Price per SQFT Sold to List Price Coop Sales New Listings Active Listings Pending Sales DOM Months Inventory 2011 YTD 3 $109,833 $88,500 $68 90% 33% 1 7 126 35.3 2012 YTD 6 $102,792 $61,120 $65 89% 0% 2 6 1 60 15.8 Difference 3 -$7,041 -$27,380 -$3 -1% -33% 1 -1 1 -66 -19.5 % Difference 100.00% -6.41% -30.94% -4.41% -1.11% -100.00% 100.00% -14.29% 100.00% -52.38% -55.24% Area: 68 Sales Avg Price Median Price Sales Price per SQFT Sold to List Price Coop Sales New Listings Active Listings Pending Sales DOM Months Inventory 2011 YTD 1 $47,500 $47,500 $24 94% 0% 4 113 48.0 2012 YTD 1 $50,000 $50,000 $33 77% 0% 1 4 1 62 16.0 Difference 0 $2,500 $2,500 $9 -17% 0% -3 4 1 -51 -32 % Difference 0.00% 5.26% 5.26% 37.50% -18.09% 0.00% -75.00% 400.00% 100.00% -45.13% -66.67% Area: 69 Sales Avg Price Median Price Sales Price per SQFT Sold to List Price Coop Sales New Listings Active Listings Pending Sales DOM Months Inventory 2011 YTD 7 $203,286 $153,000 $143 91% 57% 4 13 4 133 19.3 2012 YTD 6 $153,583 $173,750 $72 91% 50% 8 12 3 278 19.1 Difference -1 -$49,703 $20,750 -$71 0% -7% 4 -1 -1 145 -0.2 % Difference -14.29% -24.45% 13.56% -49.65% 0.00% -12.28% 100.00% -7.69% -25.00% 109.02% -1.04% Area: 70 Sales Avg Price Median Price Sales Price per SQFT Sold to List Price Coop Sales New Listings Active Listings Pending Sales DOM Months Inventory 2011 YTD 1 $135,000 $135,000 $57 93% 100% 1 3 380 380 36.0 2012 YTD 1 $132,000 $132,000 $80 101% 0% 6 121 36 121 72.0 Difference 0 -$3,000 -$3,000 $23 0.08 -1.00 5 118 -344 -259 36 % Difference 0.00% -2.22% -2.22% 40.35% 8.60% -100.00% 500.00% 3933.33% -90.53% -68.16% 100.00% Real Estate Data ©2012 Real Estate Center at Texas A and M University and HAR. Data computations ©2012 Better Homes and Gardens Real Estate Gary Greene.
  • 9. Sales Sold Average Median Price to List Coop New Active Pending Months Year Month Sales Price Price per Sqft Price Sales Listings Listings Sales DOM Inventory Area: 71 Sales Avg Price Median Price Sales Price per SQFT Sold to List Price Coop Sales New Listings Active Listings Pending Sales DOM Months Inventory 2011 YTD 1 $242,990 $242,990 $69 100% 100% 1 88 2012 YTD 1 $50,000 $50,000 $35 83% 0% 1 1 1 74 12.0 Difference 0 -$192,990 -$192,990 -$34 -17% -100% 1 1 0 -14 12.0 % Difference 0.00% -79.42% -79.42% -49.28% -17.00% -100.00% 100.00% 100.00% 0.00% -15.91% 1200.00% Area: 72 Sales Avg Price Median Price Sales Price per SQFT Sold to List Price Coop Sales New Listings Active Listings Pending Sales DOM Months Inventory 2011 YTD 1 $15,000 $15,000 $10 52% 100% 1 7 148 14.0 2012 YTD 2 $162,000 $162,000 $42 92% 100% 2 1 8 9 Difference 1 $147,000 $147,000 $32 40% 0% 1 -6 8 -139 -14.0 % Difference 100.00% 980.00% 980.00% 320.00% 76.92% 0.00% 100.00% -85.71% n/a -93.92% -100.00% Area: 73 Sales Avg Price Median Price Sales Price per SQFT Sold to List Price Coop Sales New Listings Active Listings Pending Sales DOM Months Inventory 2011 YTD 2 $303,750 $303,750 $153 101% 50% 2 5 1 369 13.5 2012 YTD 2 $149,900 $149,900 $81 99% 0% 3 7 142 24.5 Difference 0 -$153,850 -$153,850 -$72 -2% -50% 1 2 -1 -227 11 % Difference 0.00% -50.65% -50.65% -47.06% -1.98% -100.00% 50.00% 40.00% -100.00% -61.52% 81.48% Area: 74 Sales Avg Price Median Price Sales Price per SQFT Sold to List Price Coop Sales New Listings Active Listings Pending Sales DOM Months Inventory 2012 YTD 1 $90,000 $90,000 $56 90% 0% 1 1 1 91 6.0 Area: 77 Sales Avg Price Median Price Sales Price per SQFT Sold to List Price Coop Sales New Listings Active Listings Pending Sales DOM Months Inventory 2011 YTD 13 $132,615 $105,000 $57 93% 69% 8 12 5 57 11.9 2012 YTD 4 $48,175 $48,850 $34 90% 0% 2 6 1 48 5.3 Difference -9 -$84,440 -$56,150 -$23 -3% -69% -6 -6 -4 -9 -6.6 % Difference -69.23% -63.67% -53.48% -40.35% -3.23% -100.00% -75.00% -50.00% -80.00% -15.79% -55.46% Area: 78 Sales Avg Price Median Price Sales Price per SQFT Sold to List Price Coop Sales New Listings Active Listings Pending Sales DOM Months Inventory 2012 YTD 1 $10,000 $10,000 $5 53% 100% 1 2 2 74 24.0 Area: 79 Sales Avg Price Median Price Sales Price per SQFT Sold to List Price Coop Sales New Listings Active Listings Pending Sales DOM Months Inventory 2011 YTD 1 $70,000 $70,000 $63 93% 0% 1 2 1 75 24.0 Real Estate Data ©2012 Real Estate Center at Texas A and M University and HAR. Data computations ©2012 Better Homes and Gardens Real Estate Gary Greene.