SlideShare una empresa de Scribd logo
1 de 12
Descargar para leer sin conexión
1
Dept of Computer Science & Engineering, CEM

                                          Dead locks
       Some IO media, such as disks are easily sharable. Multiple processes could be using
the same disk drive for reading & writing.
       But we cannot do the same for certain IO media such as a tape drive or a printer. So
they have to be allocated for only one process exclusively. Because of its non-sharable
nature, the user process has to request for the entire device explicitly and the Operating
system has to allocate these IO devices accordingly. Only when the user process gives up a
device explicitly, the Operating system can take it back and add it into the free pool.
       Lets us imagine two processes, PA and PB running simultaneously. Half way through,
PA requests the Operating system for a file on the tape drive, and PB requests the Operating
system for the printer. Let us assume that both the requests are granted. After a while PA
request for the printer without giving up the Tape drive. Simultaneously PB requests the tape
drive without giving up the control of printer. In this situation both the process cannot
proceed. PA will wait until PB releases the printer. But that can happen only if PB can
proceeds further and finish off its processing with the printer. And this can happen only if PB
gets the same drive that PA is holding. PB can get the tape drive only if PA can proceed
further and completes its work with the tape drive. That cannot happen too, unless PA gets
the printer which PB is holding. This situation is called ‘deadlock’.


Definition :In a multiprogramming environment, several processes may compete for a finite
number of resources. When a process requests resources and if the resources are not
available at that time, the process enters in a wait state. Waiting processes may never again
change its state, because the resource they have requested are held by other waiting
processes. This situation is called ‘deadlock’.

Graphical Representation of Deadlock

To represent the relation ship between processes and resources, a certain graphical notation
is used.

                                                                        P1
                   R1
                                        Fig A

                   R2                                                   P2
                                        Fig B


                                                                             Prepared by Shine N Das
2
Dept of Computer Science & Engineering, CEM


In the above figure rectangular boxes as resources named R1 & R2 and circles are processes
P1 & P2. The arrow shows the relationship.
        In fig(a), Resources R1 is allocated to process P1 or in other wards P1 holds R1. In fig
(b), processes P2 want Resource R2, but it has not yet got yet. It is waiting for it. The moment
it gets the resources, the direction of the arrows will change.
        These graphs are called Direct Resource Allocation Graph (DRAG).
Let us imagine a typical scenario for the deadlock.
   •    P1 holds R1 but demands R2.
   •    P2 holds R2 but demands R1.
   If we draw a DRAG for this situation it will look like


                                   P1

           R1                                                R2
                                    P2


       This is a closed loop, and this situation is called “circular wait” condition.
The same DRAG can also be drawn as shown


                       P1                            P2


                         R1                           R2


        If we start from any node and follow all the arrows, we must return to the original
node. That is what makes it a circular wait or deadlock situation.

Conditions for deadlock to occur
There are certain conditions that must be true for a deadlock to occur. Deadlock is a situation
where a process is waiting for another process, which is waiting for another process etc.
Until finally a process in the chain is waiting for the original process- ie, there is a cycle of
                                                                            Prepared by Shine N Das
3
Dept of Computer Science & Engineering, CEM

processes where each one is waiting for the next one. If the processes are deadlocked, it is
logically impossible for any of them to proceed since they are waiting for each other.


Four necessary conditions for the deadlocks are :


   1. Mutual Exclusion: Resources must be allocated to processes at any time in an
       exclusive manner and not on a shared basis.
   2. Hold and Wait: A process can hold one resource and request another.
   3. Circular Wait: A situation can arise in which process P1 holds resource R1 while it
       requests resource R2, process P2 holds R2 while it request resource R1.
   4. Non-Preemption: If a process holds certain resources no other process should be able
       to take them away from it forcibly.


   There are three strategies for dealing with deadlocks
   Prevention: Place restrictions on resource request so that deadlocks cannot occur
   Avoidance: Plan ahead so that you never get into a situation where deadlock is
   inevitable.
   Detection & Recovery: Detect when deadlock has occurred and recover from it.


   I. Deadlock prevention
       Deadlock requires the four conditions. If we can prevent anyone of these conditions
   from occurring, we can prevent deadlock.
   1) Allowing Preemption: - If we can preempt resources, then deadlock is not possible.
       All resources can be preempted.
   2) Avoiding Mutual Exclusion: - If every resource in the systems were sharable by
       multiple processes, deadlock would never occur. However, such sharing is
       impracticable in a tape drive, plotter or a printer, which cannot be shared among
       several processes. At best, what one can do is to use the spooling techniques for the
       printer, where all the printing requests are handled by a separate program when the
       spooler is holding the printers.
   3) Avoiding Hold & Wait: - If a process acquires all of the resources at one time, then it
       will never be in situation where it is holding a resource and waiting for another
       resource. This will prevent deadlock.

                                                                        Prepared by Shine N Das
4
Dept of Computer Science & Engineering, CEM

                  This situation works and is used in some situation, but it can lead to
           insufficient use of resources. Suppose you have a long process that use a tape drive
           for the first 10 minutes and then a CD drive for a few seconds. If you have to acquire
           them both at the same time, then you will be holding the CD drive for 10 minutes
           without using it.
    There are two disadvantages: -
    (i)        Resource utilization may be low: - Since many of the resources may be allocated
               but unused for a long period.
    (ii)       Starvation: - A process that need several popular resources may have to wait
               indefinitely, because at least one of the resources that needs is always allocated
               to some other processes.
   4) Avoiding the circular wait condition: - Circular wait can be eliminated in several
           ways. One way is to have a rule saying that a process is entitled only to a single
           resource at any moment. It needs a second one; it must release the first one.
                  Another way to avoid the circular wait is to provide a global numbering of all
           the resources.
                  eg:- 1) Printer
                       2) Plotter
                       3) Tape drive
                       4) CD ROM Drive


    Now the rule is this: process can request resources whenever they want to, but all
    requests must be made in numerical order. A process may request first a printer, and
    then a tape drive, but may not request first a plotter and a printer.
           With this rule, the resource allocation graph can never have cycles.

                 A                  B                  Processes


                  i                 j                  Resources


We can get deadlock only if A requests resource j and B requests resource i . Assuming i and
j are distinct resources, they will have different numbers. If i > j then A is not allowed to
requests j . If i < j then B is not allowed to request i. Either way, deadlock is impossible.

                                                                            Prepared by Shine N Das
5
Dept of Computer Science & Engineering, CEM


   II. Detection & Recovery


   Detection of deadlock
          We will follow a method to detect a deadlock where there are multiple instances for a
   resource time. The operating system has to treat each resource separately, regardless of
   the time. The operating system in this case, could do the following to detect a deadlock:
   i)        Number all processes as P0,P1…..PN.
   ii)       Number each resource using a meaningful coding scheme. For instance the first
             character could always be “R” denoting a resource. The second character could
             denote the resource type (0=Tape, 1=Printer…etc) and the third character denotes
             the resource number or an instance within the type. (Eg. R00, R01, R02…could
             denote different tape drive of the same type R10, R11, R12…could be different
             printers.)
   iii)      The operating system maintains two tables as shown below. One is a resource
             wise table giving resource type, resource number, allocation status, the process to
             which it is allocated and the process that are waiting for it.
                 Resource Resource            Status        Process to which Waiting
                 Type       Number                          allocated             Process
                            R00               Free          --                    --
                 Tape
                            R01               Allocated     P1                    --
                 (0)
                            R02               Allocated     P2                    P3, P4
                 Printer    R10               Allocated     P1                    P5
                 (1)
                            R20               Allocated     P5                    P1, P2
                 Plotter
                            R21               Free          --                    --
                 (2)
                            R23               Allocated     P4                    P2, P5


                                        Resource wise Table


          Another table is the process wise table giving for each process, the resource held by it
and the resources it is waiting for.


                                                                              Prepared by Shine N Das
6
Dept of Computer Science & Engineering, CEM

                  Process        Allocated             Resource the process
                  Number         Resources             is waiting for
                  P0             --                    --
                  P1             R01, R10              R20
                  P2             R02                   R20
                  P3             --                    R02
                  P4             R23                   R02
                  P5             R20                   R10, R23
                                 Process wise Table


   iv)      At anytime the OS can use this table to detect a circular wait or a deadlock.
            Whenever a resource is demanded by the process, before actually allocating it, the
            OS could use the following algorithm to see the allocation can potentially lead to
            a deadlock or not.
Algorithm
   Step1: Go through the resource wise table one by one (R00, R01,..Etc)
   Step2: Ignore entries for free resources (R00, R21)
   Step3: For each entries access the process with a resource is allocated (resource R01 is
   allocated for process P1)
                                                             P1


                                                            R01

   Step4: Access the process wise table for the process obtained in step3. (P1 in this case)
   Step5: From the process wise table obtain the waiting process for the process obtained in
   step3. (P1 is waiting for R20)

                                                 P1


                                                 R01                   R20


   Step6: Check the process that is allocated for R20 (e.g. P5)

                                            P1                    P5


                                            R01                   R20

                                                                              Prepared by Shine N Das
7
Dept of Computer Science & Engineering, CEM


   Step7: Check the waiting resources for P5 in the process wise table (e.g. R10, R23)
   Step8: The process list now contains P1&P5 and the resource list contain R01, R10, R20 and
   R23 for the process P1&P5. This is a circular wait situation and hence a deadlock has been
   detected. (P1→R20→P5→R10→P1)

                                                    P1           P5


                                      R10           R01         R20         R23


   Deadlock Recovery.
       Deadlock recovery becomes more complex due to the fact that some processes
   definitely loss something in the bargain. Basically there are two approaches to solve this
   problem. Suspending a process or killing it.
   1) Suspend / Resume a process: -
       In this method, a process is selected based on a variety of criteria (low priority,
       for instance) and it is suspended for a long time. The resources are reclaimed from
       the suspended process and then allocated to other process that is waiting for them.
       When one of the waiting processes gets over, the original suspended process is
       resumed.
       This scheme has several problems in its implementation:
       1) Not all OS support the suspend/resume operations due to the overheads involved
           in maintaining so many more PCB chains.
       2) This strategy cannot e used in any online or real time systems, because, the
           response time of some processes then becomes unpredictable, and clearly this is
           unacceptable.
       3) Suspend / Resume operations are not easy to manage physically /
           programmatically for this purpose.


       Imagine that a tape is read half way through and then a process holding the tape drive
       is suspended. The operator will have to dismount that tape, mount the new tape for
       the new process to which the tape drive is now to be allocated. After this new process

                                                                          Prepared by Shine N Das
8
Dept of Computer Science & Engineering, CEM

       is over, when the old processes resumed, the tape for the original process will have to
       be mounted and is to be positional exactly.


       4) Killing the process:
               The OS decides to kill a process and reclaim all its resources after ensuring
       that such action will solve the deadlock. This solution is simple; but involves loss of
       at least one process.
               Solution of a process to be killed again depends on the scheduling policy and
       the processes priority. It is safest to kill a lowest priority process, which has just
       begun, so that the loss is not very heavy.


III. Dead lock avoidance
       Deadlock prevention is concerned with imposing certain restrictions on the
environment or processes, so that deadlocks can never occur. But the OS aims at avoiding a
deadlock rather than preventing one. Deadlock avoidance is concerned with starting with an
environment, where a deadlock is theoretically possible, but by applying some algorithm in
the OS, a dead lock can be avoided.


Bankers Algorithm
       The Banker’s algorithm is the best known of the avoidance strategies. The strategy is
modeled after the lending policies employed in a banking system. A bank has a limited
amount of funds- resources- that can be lend to different borrowers- processes. To
accommodate borrowers, the bank may extend a line of credit to its customer. The line of
credit is the maximum claim for resources by the customer.


       If the customer borrows some portion of the line of the credit and then requests
additional funds, the first amount borrowed will be paid back to the bank only if the
additional funds are loaned. At the same time the loan dept looks at the funds allocated to all
customers and the hire amount that can be requested by each customer.
       The figure below shows the resource allocation graph for the processes. The Banker’s
Algorithm maintains two matrices on a dynamic basis. Matrix A is for resources allocated to
different processes and Matrix B for the resources still needed by different processes. The


                                                                            Prepared by Shine N Das
9
Dept of Computer Science & Engineering, CEM

resources could be needed one after another or simultaneously. The OS has no way of
knowing this.


                         P0                   P1                   P2
                                                                                     P3


                   Tape drives                         Printers                    Plotters


                    Current Allocation                         Outstanding Request
    Process         R1           R2         R3                 R1       R2           R3
                    Tapes        Printers   Plotters           Tapes    Printers     Plotters
         P0              2            0            0                1        0                0

         P1              0            1            0                1        1                0

         P2              1            2            1                2        1                1

         P3              1            0            1                1        1                1


                               Matrix A                                      Matrix B
                               Resources                                     Resources
                                assigned                                      required

                              Vectors
                              Total resources (T) = 543
                              Held resources (H) = 432
                              Free resources (F)           = 111


           Matrix A shows that process P0 is holding 2 tape drives at a given time at the same
movement, P1 is holding 1 printer and so on. If we add these figures vertically we get a
vector of held resources (H) = 432.
         This says that at a given moment, total resources held by various processes are 4
Tape drives, 3 printers and 4 plotters. By the same logic figure show the vector for the Total
Resources (T) is 543. This means that in the whole system 5 Tape drives 4 Printers and 3

                                                                                   Prepared by Shine N Das
10
Dept of Computer Science & Engineering, CEM

Plotters. These resources are made known to the OS in the time of system generation. By
subtracting H from T columnwise we get a vector (F) of Free Resources = 111. This means
that the resources available to the OS for further allocation are: 1 Tape drive 1 printer & 1
Plotter.
            Matrix B gives, additional resources that are expected to be in due course during the
execution of these processes. For instance, P2 will require 2 tape drives, 1 printer and 1
plotter in addition to the resources already held by it. It means P2 requires, 1+2 =3 tape
drives, 2+1 = 3 printers and 1+1= 2 plotters. If the vector of all resources required by the
processes is less than the vector (T) for each of the resources (eg: 332 < 543) there will not
be any deadlock. However if that is not so, a deadlock has to be avoided.
Banker’s Algorithm
Step 1: - Each process declares the total required resources to the OS at the beginning. The
OS puts these figures in Matrix B (resources required for completion) against each process.
For a newly created process the rows in Matrix A is fully zero because no resources are yet
assigned for that process.
      Eg: At the beginning of process P2, the figures for the rows for P2 in matrix A will be
all 0, and those in Matrix will be 3,3 and 2.
Step 2: - When a process requests the OS for a resource, the OS finds out whether the
resource is free and whether it can be allocated by using the vector F. if it can be allocated,
the OS does so, and updates matrix A by adding 1 to the appropriate slot. It simultaneously
subtract 1 from the corresponding slot of matrix B
           Eg: - if the OS allocates tape drive to processP2, the rows for P2 in the matrix A will
become 1,0,0 and rows with Matrix B will correspondingly become 2,3and 2.
Step 3: - Whenever a process makes a request to OS for any resource, before making the
actual allocation, it makes an imaginary allocation using bankers algorithm to ensure that
there need not be a deadlock. The OS actually allocates the resource only after ensuring this.
If it finds that there can be a deadlock after imaginary allocation, it postpones the decision to
allocate that resource.
           During the imaginary allocation the OS conclude about the safe and unsafe state in
the following manner.
           It looks at vector F and each row of the Matrix B. It compares them on a vector to
vector basis ie, within the vector, it compares each digit separately to conclude whether all
the resources that a process is going to need to complete are available at this point or not.

                                                                            Prepared by Shine N Das
11
Dept of Computer Science & Engineering, CEM

       Eg: - Figure shows F= 111. If the OS decides to allocate all needed resources to P0, it
compares 111 with 100, (111> 100), on a vector basis, and P0 can go for completion.
Similarly the OS decided to allocate resources to P1. P1 can complete (111 >100) etc. the
rows for P2 is 211, therefore P2 cannot complete unless there is one more tape drive is
available (111 < 211).
       For each request for any resources by a process the operating system goes through
all these trial or imaginary allocations and updations, and if it finds that after the trial
allocation, the state of the system would be ‘safe’, it does ahead and makes an allocation in
real sense.


Example 1
       Suppose process P1 requests for 1 tape drive when the resources allocated to various
processes are given in the fig. The OS has to decide whether to grant this request or not.
The Bankers Algorithm proceeds to determine this as follows.
   •   If a tape drive is allocated to P1, F will become 011 and the resources still required
       for P1 in matrix B will become 010.
   •   If P1 is given all the resources it needs to complete, the rows for assigned resources
       of P1 in matrix A will become 120 and after this allocation F will become 001.
   •   At the end of the execution of P1, all the resources used by P1 will become free and F
       will become 120 + 001 =121. we can now erase the row P1 from both the matrices
       indicating that this is how the matrices will look if P1 is granted its first request.
   •   We repeat the same step with other rows. For instance now F=121. Therefore the OS
       will have sufficient resources to complete either P0 or P3 but not P2. Let us take P0,
       assuming that all the required resources are allocated to P0 one by one. The rows for
       P0 in matrix A become 300 and matrix B becomes 000. F at this point becomes
       121 – 100 = 021. If P0 is now allocated to completion, all the resources held by P0
       will be returned to F and F becomes 021 + 300 = 321.
   •   Now either P2 or P3 can be chosen for this ‘trial allocation’. Let us assume that P3 is
       allocated. The recourse required by P3 are111. Therefore after trial allocation, rows of
       P3 in Matrix A becomes 212 and Matrix B becomes 000. The value of F become now
       321 – 111 = 210. After the process completion the resources are returned back to F
       and F becomes 210 + 212 = 422.

                                                                            Prepared by Shine N Das
12
Dept of Computer Science & Engineering, CEM

   •   At the end P2 will be allocated and completed. At this point resources allocated to P2
       is 332, and F would be 422 – 211. In the end, resources will be returned to the free
       pool. Therefore F = 322 + 211 = 543. This is the same as the total resource vector T
       that are known to the system.


                                                                       Prepared by Shine N Das

Más contenido relacionado

La actualidad más candente

Advanced Operating System- Introduction
Advanced Operating System- IntroductionAdvanced Operating System- Introduction
Advanced Operating System- IntroductionDebasis Das
 
Deadlock Avoidance - OS
Deadlock Avoidance - OSDeadlock Avoidance - OS
Deadlock Avoidance - OSMsAnita2
 
deadlock handling
deadlock handlingdeadlock handling
deadlock handlingSuraj Kumar
 
Operating Systems - "Chapter 5 Process Synchronization"
Operating Systems - "Chapter 5 Process Synchronization"Operating Systems - "Chapter 5 Process Synchronization"
Operating Systems - "Chapter 5 Process Synchronization"Ra'Fat Al-Msie'deen
 
Deadlocks in operating system
Deadlocks in operating systemDeadlocks in operating system
Deadlocks in operating systemMidhun Sankar
 
Critical section problem in operating system.
Critical section problem in operating system.Critical section problem in operating system.
Critical section problem in operating system.MOHIT DADU
 
DeadLock in Operating-Systems
DeadLock in Operating-SystemsDeadLock in Operating-Systems
DeadLock in Operating-SystemsVenkata Sreeram
 
Difference Program vs Process vs Thread
Difference Program vs Process vs ThreadDifference Program vs Process vs Thread
Difference Program vs Process vs Threadjeetendra mandal
 
Deadlock management
Deadlock managementDeadlock management
Deadlock managementAhmed kasim
 
Distributed Transactions(flat and nested) and Atomic Commit Protocols
Distributed Transactions(flat and nested) and Atomic Commit ProtocolsDistributed Transactions(flat and nested) and Atomic Commit Protocols
Distributed Transactions(flat and nested) and Atomic Commit ProtocolsSachin Chauhan
 

La actualidad más candente (20)

Advanced Operating System- Introduction
Advanced Operating System- IntroductionAdvanced Operating System- Introduction
Advanced Operating System- Introduction
 
Deadlock Avoidance - OS
Deadlock Avoidance - OSDeadlock Avoidance - OS
Deadlock Avoidance - OS
 
deadlock handling
deadlock handlingdeadlock handling
deadlock handling
 
Operating Systems - "Chapter 5 Process Synchronization"
Operating Systems - "Chapter 5 Process Synchronization"Operating Systems - "Chapter 5 Process Synchronization"
Operating Systems - "Chapter 5 Process Synchronization"
 
Deadlock Prevention
Deadlock PreventionDeadlock Prevention
Deadlock Prevention
 
CS6401 OPERATING SYSTEMS Unit 2
CS6401 OPERATING SYSTEMS Unit 2CS6401 OPERATING SYSTEMS Unit 2
CS6401 OPERATING SYSTEMS Unit 2
 
Processes and threads
Processes and threadsProcesses and threads
Processes and threads
 
Deadlocks in operating system
Deadlocks in operating systemDeadlocks in operating system
Deadlocks in operating system
 
Semaphore
SemaphoreSemaphore
Semaphore
 
Chapter 7 - Deadlocks
Chapter 7 - DeadlocksChapter 7 - Deadlocks
Chapter 7 - Deadlocks
 
Deadlock
DeadlockDeadlock
Deadlock
 
Critical section problem in operating system.
Critical section problem in operating system.Critical section problem in operating system.
Critical section problem in operating system.
 
DeadLock in Operating-Systems
DeadLock in Operating-SystemsDeadLock in Operating-Systems
DeadLock in Operating-Systems
 
Difference Program vs Process vs Thread
Difference Program vs Process vs ThreadDifference Program vs Process vs Thread
Difference Program vs Process vs Thread
 
Deadlock
DeadlockDeadlock
Deadlock
 
Paging and segmentation
Paging and segmentationPaging and segmentation
Paging and segmentation
 
File system structure
File system structureFile system structure
File system structure
 
Deadlock management
Deadlock managementDeadlock management
Deadlock management
 
Distributed DBMS - Unit 5 - Semantic Data Control
Distributed DBMS - Unit 5 - Semantic Data ControlDistributed DBMS - Unit 5 - Semantic Data Control
Distributed DBMS - Unit 5 - Semantic Data Control
 
Distributed Transactions(flat and nested) and Atomic Commit Protocols
Distributed Transactions(flat and nested) and Atomic Commit ProtocolsDistributed Transactions(flat and nested) and Atomic Commit Protocols
Distributed Transactions(flat and nested) and Atomic Commit Protocols
 

Similar a Dead Lock In Operating Systems

Similar a Dead Lock In Operating Systems (20)

Section07-Deadlocks (1).ppt
Section07-Deadlocks (1).pptSection07-Deadlocks (1).ppt
Section07-Deadlocks (1).ppt
 
An brief introduction to Deadlocks in OS
An brief introduction to Deadlocks in OSAn brief introduction to Deadlocks in OS
An brief introduction to Deadlocks in OS
 
Deadlocks
DeadlocksDeadlocks
Deadlocks
 
Section07-Deadlocks.pdf
Section07-Deadlocks.pdfSection07-Deadlocks.pdf
Section07-Deadlocks.pdf
 
Chapter5_Deadlock.pptx
Chapter5_Deadlock.pptxChapter5_Deadlock.pptx
Chapter5_Deadlock.pptx
 
Deadlocks
 Deadlocks Deadlocks
Deadlocks
 
Deadlocks 160928121516-160928183232
Deadlocks 160928121516-160928183232Deadlocks 160928121516-160928183232
Deadlocks 160928121516-160928183232
 
Ch 4 deadlock
Ch 4 deadlockCh 4 deadlock
Ch 4 deadlock
 
Operating system Deadlock
Operating system DeadlockOperating system Deadlock
Operating system Deadlock
 
Dead Lock
Dead LockDead Lock
Dead Lock
 
OS Module-3 (2).pptx
OS Module-3 (2).pptxOS Module-3 (2).pptx
OS Module-3 (2).pptx
 
Mch7 deadlock
Mch7 deadlockMch7 deadlock
Mch7 deadlock
 
9 deadlock
9 deadlock9 deadlock
9 deadlock
 
Deadlock Detection Algorithm
Deadlock Detection AlgorithmDeadlock Detection Algorithm
Deadlock Detection Algorithm
 
FP 202 Chapter 2 - Part 3
FP 202 Chapter 2 - Part 3FP 202 Chapter 2 - Part 3
FP 202 Chapter 2 - Part 3
 
Deadlock
DeadlockDeadlock
Deadlock
 
Deadlock
DeadlockDeadlock
Deadlock
 
Deadlocks
DeadlocksDeadlocks
Deadlocks
 
Sucet os module_3_notes
Sucet os module_3_notesSucet os module_3_notes
Sucet os module_3_notes
 
Lecture5
Lecture5Lecture5
Lecture5
 

Último

Z Score,T Score, Percential Rank and Box Plot Graph
Z Score,T Score, Percential Rank and Box Plot GraphZ Score,T Score, Percential Rank and Box Plot Graph
Z Score,T Score, Percential Rank and Box Plot GraphThiyagu K
 
Sanyam Choudhary Chemistry practical.pdf
Sanyam Choudhary Chemistry practical.pdfSanyam Choudhary Chemistry practical.pdf
Sanyam Choudhary Chemistry practical.pdfsanyamsingh5019
 
Contemporary philippine arts from the regions_PPT_Module_12 [Autosaved] (1).pptx
Contemporary philippine arts from the regions_PPT_Module_12 [Autosaved] (1).pptxContemporary philippine arts from the regions_PPT_Module_12 [Autosaved] (1).pptx
Contemporary philippine arts from the regions_PPT_Module_12 [Autosaved] (1).pptxRoyAbrique
 
Introduction to AI in Higher Education_draft.pptx
Introduction to AI in Higher Education_draft.pptxIntroduction to AI in Higher Education_draft.pptx
Introduction to AI in Higher Education_draft.pptxpboyjonauth
 
Software Engineering Methodologies (overview)
Software Engineering Methodologies (overview)Software Engineering Methodologies (overview)
Software Engineering Methodologies (overview)eniolaolutunde
 
Advanced Views - Calendar View in Odoo 17
Advanced Views - Calendar View in Odoo 17Advanced Views - Calendar View in Odoo 17
Advanced Views - Calendar View in Odoo 17Celine George
 
URLs and Routing in the Odoo 17 Website App
URLs and Routing in the Odoo 17 Website AppURLs and Routing in the Odoo 17 Website App
URLs and Routing in the Odoo 17 Website AppCeline George
 
Paris 2024 Olympic Geographies - an activity
Paris 2024 Olympic Geographies - an activityParis 2024 Olympic Geographies - an activity
Paris 2024 Olympic Geographies - an activityGeoBlogs
 
“Oh GOSH! Reflecting on Hackteria's Collaborative Practices in a Global Do-It...
“Oh GOSH! Reflecting on Hackteria's Collaborative Practices in a Global Do-It...“Oh GOSH! Reflecting on Hackteria's Collaborative Practices in a Global Do-It...
“Oh GOSH! Reflecting on Hackteria's Collaborative Practices in a Global Do-It...Marc Dusseiller Dusjagr
 
POINT- BIOCHEMISTRY SEM 2 ENZYMES UNIT 5.pptx
POINT- BIOCHEMISTRY SEM 2 ENZYMES UNIT 5.pptxPOINT- BIOCHEMISTRY SEM 2 ENZYMES UNIT 5.pptx
POINT- BIOCHEMISTRY SEM 2 ENZYMES UNIT 5.pptxSayali Powar
 
Interactive Powerpoint_How to Master effective communication
Interactive Powerpoint_How to Master effective communicationInteractive Powerpoint_How to Master effective communication
Interactive Powerpoint_How to Master effective communicationnomboosow
 
CARE OF CHILD IN INCUBATOR..........pptx
CARE OF CHILD IN INCUBATOR..........pptxCARE OF CHILD IN INCUBATOR..........pptx
CARE OF CHILD IN INCUBATOR..........pptxGaneshChakor2
 
Q4-W6-Restating Informational Text Grade 3
Q4-W6-Restating Informational Text Grade 3Q4-W6-Restating Informational Text Grade 3
Q4-W6-Restating Informational Text Grade 3JemimahLaneBuaron
 
Separation of Lanthanides/ Lanthanides and Actinides
Separation of Lanthanides/ Lanthanides and ActinidesSeparation of Lanthanides/ Lanthanides and Actinides
Separation of Lanthanides/ Lanthanides and ActinidesFatimaKhan178732
 
Mastering the Unannounced Regulatory Inspection
Mastering the Unannounced Regulatory InspectionMastering the Unannounced Regulatory Inspection
Mastering the Unannounced Regulatory InspectionSafetyChain Software
 
Measures of Central Tendency: Mean, Median and Mode
Measures of Central Tendency: Mean, Median and ModeMeasures of Central Tendency: Mean, Median and Mode
Measures of Central Tendency: Mean, Median and ModeThiyagu K
 
18-04-UA_REPORT_MEDIALITERAСY_INDEX-DM_23-1-final-eng.pdf
18-04-UA_REPORT_MEDIALITERAСY_INDEX-DM_23-1-final-eng.pdf18-04-UA_REPORT_MEDIALITERAСY_INDEX-DM_23-1-final-eng.pdf
18-04-UA_REPORT_MEDIALITERAСY_INDEX-DM_23-1-final-eng.pdfssuser54595a
 
BASLIQ CURRENT LOOKBOOK LOOKBOOK(1) (1).pdf
BASLIQ CURRENT LOOKBOOK  LOOKBOOK(1) (1).pdfBASLIQ CURRENT LOOKBOOK  LOOKBOOK(1) (1).pdf
BASLIQ CURRENT LOOKBOOK LOOKBOOK(1) (1).pdfSoniaTolstoy
 

Último (20)

Z Score,T Score, Percential Rank and Box Plot Graph
Z Score,T Score, Percential Rank and Box Plot GraphZ Score,T Score, Percential Rank and Box Plot Graph
Z Score,T Score, Percential Rank and Box Plot Graph
 
Sanyam Choudhary Chemistry practical.pdf
Sanyam Choudhary Chemistry practical.pdfSanyam Choudhary Chemistry practical.pdf
Sanyam Choudhary Chemistry practical.pdf
 
Contemporary philippine arts from the regions_PPT_Module_12 [Autosaved] (1).pptx
Contemporary philippine arts from the regions_PPT_Module_12 [Autosaved] (1).pptxContemporary philippine arts from the regions_PPT_Module_12 [Autosaved] (1).pptx
Contemporary philippine arts from the regions_PPT_Module_12 [Autosaved] (1).pptx
 
Introduction to AI in Higher Education_draft.pptx
Introduction to AI in Higher Education_draft.pptxIntroduction to AI in Higher Education_draft.pptx
Introduction to AI in Higher Education_draft.pptx
 
Software Engineering Methodologies (overview)
Software Engineering Methodologies (overview)Software Engineering Methodologies (overview)
Software Engineering Methodologies (overview)
 
Advanced Views - Calendar View in Odoo 17
Advanced Views - Calendar View in Odoo 17Advanced Views - Calendar View in Odoo 17
Advanced Views - Calendar View in Odoo 17
 
Mattingly "AI & Prompt Design: The Basics of Prompt Design"
Mattingly "AI & Prompt Design: The Basics of Prompt Design"Mattingly "AI & Prompt Design: The Basics of Prompt Design"
Mattingly "AI & Prompt Design: The Basics of Prompt Design"
 
URLs and Routing in the Odoo 17 Website App
URLs and Routing in the Odoo 17 Website AppURLs and Routing in the Odoo 17 Website App
URLs and Routing in the Odoo 17 Website App
 
Paris 2024 Olympic Geographies - an activity
Paris 2024 Olympic Geographies - an activityParis 2024 Olympic Geographies - an activity
Paris 2024 Olympic Geographies - an activity
 
“Oh GOSH! Reflecting on Hackteria's Collaborative Practices in a Global Do-It...
“Oh GOSH! Reflecting on Hackteria's Collaborative Practices in a Global Do-It...“Oh GOSH! Reflecting on Hackteria's Collaborative Practices in a Global Do-It...
“Oh GOSH! Reflecting on Hackteria's Collaborative Practices in a Global Do-It...
 
POINT- BIOCHEMISTRY SEM 2 ENZYMES UNIT 5.pptx
POINT- BIOCHEMISTRY SEM 2 ENZYMES UNIT 5.pptxPOINT- BIOCHEMISTRY SEM 2 ENZYMES UNIT 5.pptx
POINT- BIOCHEMISTRY SEM 2 ENZYMES UNIT 5.pptx
 
Interactive Powerpoint_How to Master effective communication
Interactive Powerpoint_How to Master effective communicationInteractive Powerpoint_How to Master effective communication
Interactive Powerpoint_How to Master effective communication
 
CARE OF CHILD IN INCUBATOR..........pptx
CARE OF CHILD IN INCUBATOR..........pptxCARE OF CHILD IN INCUBATOR..........pptx
CARE OF CHILD IN INCUBATOR..........pptx
 
Q4-W6-Restating Informational Text Grade 3
Q4-W6-Restating Informational Text Grade 3Q4-W6-Restating Informational Text Grade 3
Q4-W6-Restating Informational Text Grade 3
 
Separation of Lanthanides/ Lanthanides and Actinides
Separation of Lanthanides/ Lanthanides and ActinidesSeparation of Lanthanides/ Lanthanides and Actinides
Separation of Lanthanides/ Lanthanides and Actinides
 
Mastering the Unannounced Regulatory Inspection
Mastering the Unannounced Regulatory InspectionMastering the Unannounced Regulatory Inspection
Mastering the Unannounced Regulatory Inspection
 
Measures of Central Tendency: Mean, Median and Mode
Measures of Central Tendency: Mean, Median and ModeMeasures of Central Tendency: Mean, Median and Mode
Measures of Central Tendency: Mean, Median and Mode
 
INDIA QUIZ 2024 RLAC DELHI UNIVERSITY.pptx
INDIA QUIZ 2024 RLAC DELHI UNIVERSITY.pptxINDIA QUIZ 2024 RLAC DELHI UNIVERSITY.pptx
INDIA QUIZ 2024 RLAC DELHI UNIVERSITY.pptx
 
18-04-UA_REPORT_MEDIALITERAСY_INDEX-DM_23-1-final-eng.pdf
18-04-UA_REPORT_MEDIALITERAСY_INDEX-DM_23-1-final-eng.pdf18-04-UA_REPORT_MEDIALITERAСY_INDEX-DM_23-1-final-eng.pdf
18-04-UA_REPORT_MEDIALITERAСY_INDEX-DM_23-1-final-eng.pdf
 
BASLIQ CURRENT LOOKBOOK LOOKBOOK(1) (1).pdf
BASLIQ CURRENT LOOKBOOK  LOOKBOOK(1) (1).pdfBASLIQ CURRENT LOOKBOOK  LOOKBOOK(1) (1).pdf
BASLIQ CURRENT LOOKBOOK LOOKBOOK(1) (1).pdf
 

Dead Lock In Operating Systems

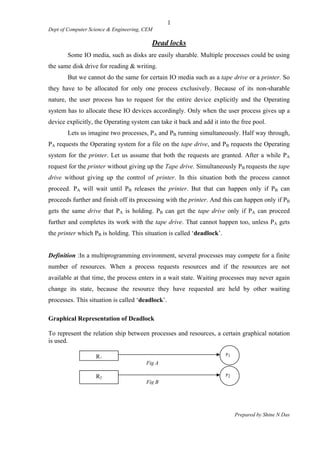
  • 1. 1 Dept of Computer Science & Engineering, CEM Dead locks Some IO media, such as disks are easily sharable. Multiple processes could be using the same disk drive for reading & writing. But we cannot do the same for certain IO media such as a tape drive or a printer. So they have to be allocated for only one process exclusively. Because of its non-sharable nature, the user process has to request for the entire device explicitly and the Operating system has to allocate these IO devices accordingly. Only when the user process gives up a device explicitly, the Operating system can take it back and add it into the free pool. Lets us imagine two processes, PA and PB running simultaneously. Half way through, PA requests the Operating system for a file on the tape drive, and PB requests the Operating system for the printer. Let us assume that both the requests are granted. After a while PA request for the printer without giving up the Tape drive. Simultaneously PB requests the tape drive without giving up the control of printer. In this situation both the process cannot proceed. PA will wait until PB releases the printer. But that can happen only if PB can proceeds further and finish off its processing with the printer. And this can happen only if PB gets the same drive that PA is holding. PB can get the tape drive only if PA can proceed further and completes its work with the tape drive. That cannot happen too, unless PA gets the printer which PB is holding. This situation is called ‘deadlock’. Definition :In a multiprogramming environment, several processes may compete for a finite number of resources. When a process requests resources and if the resources are not available at that time, the process enters in a wait state. Waiting processes may never again change its state, because the resource they have requested are held by other waiting processes. This situation is called ‘deadlock’. Graphical Representation of Deadlock To represent the relation ship between processes and resources, a certain graphical notation is used. P1 R1 Fig A R2 P2 Fig B Prepared by Shine N Das
  • 2. 2 Dept of Computer Science & Engineering, CEM In the above figure rectangular boxes as resources named R1 & R2 and circles are processes P1 & P2. The arrow shows the relationship. In fig(a), Resources R1 is allocated to process P1 or in other wards P1 holds R1. In fig (b), processes P2 want Resource R2, but it has not yet got yet. It is waiting for it. The moment it gets the resources, the direction of the arrows will change. These graphs are called Direct Resource Allocation Graph (DRAG). Let us imagine a typical scenario for the deadlock. • P1 holds R1 but demands R2. • P2 holds R2 but demands R1. If we draw a DRAG for this situation it will look like P1 R1 R2 P2 This is a closed loop, and this situation is called “circular wait” condition. The same DRAG can also be drawn as shown P1 P2 R1 R2 If we start from any node and follow all the arrows, we must return to the original node. That is what makes it a circular wait or deadlock situation. Conditions for deadlock to occur There are certain conditions that must be true for a deadlock to occur. Deadlock is a situation where a process is waiting for another process, which is waiting for another process etc. Until finally a process in the chain is waiting for the original process- ie, there is a cycle of Prepared by Shine N Das
  • 3. 3 Dept of Computer Science & Engineering, CEM processes where each one is waiting for the next one. If the processes are deadlocked, it is logically impossible for any of them to proceed since they are waiting for each other. Four necessary conditions for the deadlocks are : 1. Mutual Exclusion: Resources must be allocated to processes at any time in an exclusive manner and not on a shared basis. 2. Hold and Wait: A process can hold one resource and request another. 3. Circular Wait: A situation can arise in which process P1 holds resource R1 while it requests resource R2, process P2 holds R2 while it request resource R1. 4. Non-Preemption: If a process holds certain resources no other process should be able to take them away from it forcibly. There are three strategies for dealing with deadlocks Prevention: Place restrictions on resource request so that deadlocks cannot occur Avoidance: Plan ahead so that you never get into a situation where deadlock is inevitable. Detection & Recovery: Detect when deadlock has occurred and recover from it. I. Deadlock prevention Deadlock requires the four conditions. If we can prevent anyone of these conditions from occurring, we can prevent deadlock. 1) Allowing Preemption: - If we can preempt resources, then deadlock is not possible. All resources can be preempted. 2) Avoiding Mutual Exclusion: - If every resource in the systems were sharable by multiple processes, deadlock would never occur. However, such sharing is impracticable in a tape drive, plotter or a printer, which cannot be shared among several processes. At best, what one can do is to use the spooling techniques for the printer, where all the printing requests are handled by a separate program when the spooler is holding the printers. 3) Avoiding Hold & Wait: - If a process acquires all of the resources at one time, then it will never be in situation where it is holding a resource and waiting for another resource. This will prevent deadlock. Prepared by Shine N Das
  • 4. 4 Dept of Computer Science & Engineering, CEM This situation works and is used in some situation, but it can lead to insufficient use of resources. Suppose you have a long process that use a tape drive for the first 10 minutes and then a CD drive for a few seconds. If you have to acquire them both at the same time, then you will be holding the CD drive for 10 minutes without using it. There are two disadvantages: - (i) Resource utilization may be low: - Since many of the resources may be allocated but unused for a long period. (ii) Starvation: - A process that need several popular resources may have to wait indefinitely, because at least one of the resources that needs is always allocated to some other processes. 4) Avoiding the circular wait condition: - Circular wait can be eliminated in several ways. One way is to have a rule saying that a process is entitled only to a single resource at any moment. It needs a second one; it must release the first one. Another way to avoid the circular wait is to provide a global numbering of all the resources. eg:- 1) Printer 2) Plotter 3) Tape drive 4) CD ROM Drive Now the rule is this: process can request resources whenever they want to, but all requests must be made in numerical order. A process may request first a printer, and then a tape drive, but may not request first a plotter and a printer. With this rule, the resource allocation graph can never have cycles. A B Processes i j Resources We can get deadlock only if A requests resource j and B requests resource i . Assuming i and j are distinct resources, they will have different numbers. If i > j then A is not allowed to requests j . If i < j then B is not allowed to request i. Either way, deadlock is impossible. Prepared by Shine N Das
  • 5. 5 Dept of Computer Science & Engineering, CEM II. Detection & Recovery Detection of deadlock We will follow a method to detect a deadlock where there are multiple instances for a resource time. The operating system has to treat each resource separately, regardless of the time. The operating system in this case, could do the following to detect a deadlock: i) Number all processes as P0,P1…..PN. ii) Number each resource using a meaningful coding scheme. For instance the first character could always be “R” denoting a resource. The second character could denote the resource type (0=Tape, 1=Printer…etc) and the third character denotes the resource number or an instance within the type. (Eg. R00, R01, R02…could denote different tape drive of the same type R10, R11, R12…could be different printers.) iii) The operating system maintains two tables as shown below. One is a resource wise table giving resource type, resource number, allocation status, the process to which it is allocated and the process that are waiting for it. Resource Resource Status Process to which Waiting Type Number allocated Process R00 Free -- -- Tape R01 Allocated P1 -- (0) R02 Allocated P2 P3, P4 Printer R10 Allocated P1 P5 (1) R20 Allocated P5 P1, P2 Plotter R21 Free -- -- (2) R23 Allocated P4 P2, P5 Resource wise Table Another table is the process wise table giving for each process, the resource held by it and the resources it is waiting for. Prepared by Shine N Das
  • 6. 6 Dept of Computer Science & Engineering, CEM Process Allocated Resource the process Number Resources is waiting for P0 -- -- P1 R01, R10 R20 P2 R02 R20 P3 -- R02 P4 R23 R02 P5 R20 R10, R23 Process wise Table iv) At anytime the OS can use this table to detect a circular wait or a deadlock. Whenever a resource is demanded by the process, before actually allocating it, the OS could use the following algorithm to see the allocation can potentially lead to a deadlock or not. Algorithm Step1: Go through the resource wise table one by one (R00, R01,..Etc) Step2: Ignore entries for free resources (R00, R21) Step3: For each entries access the process with a resource is allocated (resource R01 is allocated for process P1) P1 R01 Step4: Access the process wise table for the process obtained in step3. (P1 in this case) Step5: From the process wise table obtain the waiting process for the process obtained in step3. (P1 is waiting for R20) P1 R01 R20 Step6: Check the process that is allocated for R20 (e.g. P5) P1 P5 R01 R20 Prepared by Shine N Das
  • 7. 7 Dept of Computer Science & Engineering, CEM Step7: Check the waiting resources for P5 in the process wise table (e.g. R10, R23) Step8: The process list now contains P1&P5 and the resource list contain R01, R10, R20 and R23 for the process P1&P5. This is a circular wait situation and hence a deadlock has been detected. (P1→R20→P5→R10→P1) P1 P5 R10 R01 R20 R23 Deadlock Recovery. Deadlock recovery becomes more complex due to the fact that some processes definitely loss something in the bargain. Basically there are two approaches to solve this problem. Suspending a process or killing it. 1) Suspend / Resume a process: - In this method, a process is selected based on a variety of criteria (low priority, for instance) and it is suspended for a long time. The resources are reclaimed from the suspended process and then allocated to other process that is waiting for them. When one of the waiting processes gets over, the original suspended process is resumed. This scheme has several problems in its implementation: 1) Not all OS support the suspend/resume operations due to the overheads involved in maintaining so many more PCB chains. 2) This strategy cannot e used in any online or real time systems, because, the response time of some processes then becomes unpredictable, and clearly this is unacceptable. 3) Suspend / Resume operations are not easy to manage physically / programmatically for this purpose. Imagine that a tape is read half way through and then a process holding the tape drive is suspended. The operator will have to dismount that tape, mount the new tape for the new process to which the tape drive is now to be allocated. After this new process Prepared by Shine N Das
  • 8. 8 Dept of Computer Science & Engineering, CEM is over, when the old processes resumed, the tape for the original process will have to be mounted and is to be positional exactly. 4) Killing the process: The OS decides to kill a process and reclaim all its resources after ensuring that such action will solve the deadlock. This solution is simple; but involves loss of at least one process. Solution of a process to be killed again depends on the scheduling policy and the processes priority. It is safest to kill a lowest priority process, which has just begun, so that the loss is not very heavy. III. Dead lock avoidance Deadlock prevention is concerned with imposing certain restrictions on the environment or processes, so that deadlocks can never occur. But the OS aims at avoiding a deadlock rather than preventing one. Deadlock avoidance is concerned with starting with an environment, where a deadlock is theoretically possible, but by applying some algorithm in the OS, a dead lock can be avoided. Bankers Algorithm The Banker’s algorithm is the best known of the avoidance strategies. The strategy is modeled after the lending policies employed in a banking system. A bank has a limited amount of funds- resources- that can be lend to different borrowers- processes. To accommodate borrowers, the bank may extend a line of credit to its customer. The line of credit is the maximum claim for resources by the customer. If the customer borrows some portion of the line of the credit and then requests additional funds, the first amount borrowed will be paid back to the bank only if the additional funds are loaned. At the same time the loan dept looks at the funds allocated to all customers and the hire amount that can be requested by each customer. The figure below shows the resource allocation graph for the processes. The Banker’s Algorithm maintains two matrices on a dynamic basis. Matrix A is for resources allocated to different processes and Matrix B for the resources still needed by different processes. The Prepared by Shine N Das
  • 9. 9 Dept of Computer Science & Engineering, CEM resources could be needed one after another or simultaneously. The OS has no way of knowing this. P0 P1 P2 P3 Tape drives Printers Plotters Current Allocation Outstanding Request Process R1 R2 R3 R1 R2 R3 Tapes Printers Plotters Tapes Printers Plotters P0 2 0 0 1 0 0 P1 0 1 0 1 1 0 P2 1 2 1 2 1 1 P3 1 0 1 1 1 1 Matrix A Matrix B Resources Resources assigned required Vectors Total resources (T) = 543 Held resources (H) = 432 Free resources (F) = 111 Matrix A shows that process P0 is holding 2 tape drives at a given time at the same movement, P1 is holding 1 printer and so on. If we add these figures vertically we get a vector of held resources (H) = 432. This says that at a given moment, total resources held by various processes are 4 Tape drives, 3 printers and 4 plotters. By the same logic figure show the vector for the Total Resources (T) is 543. This means that in the whole system 5 Tape drives 4 Printers and 3 Prepared by Shine N Das
  • 10. 10 Dept of Computer Science & Engineering, CEM Plotters. These resources are made known to the OS in the time of system generation. By subtracting H from T columnwise we get a vector (F) of Free Resources = 111. This means that the resources available to the OS for further allocation are: 1 Tape drive 1 printer & 1 Plotter. Matrix B gives, additional resources that are expected to be in due course during the execution of these processes. For instance, P2 will require 2 tape drives, 1 printer and 1 plotter in addition to the resources already held by it. It means P2 requires, 1+2 =3 tape drives, 2+1 = 3 printers and 1+1= 2 plotters. If the vector of all resources required by the processes is less than the vector (T) for each of the resources (eg: 332 < 543) there will not be any deadlock. However if that is not so, a deadlock has to be avoided. Banker’s Algorithm Step 1: - Each process declares the total required resources to the OS at the beginning. The OS puts these figures in Matrix B (resources required for completion) against each process. For a newly created process the rows in Matrix A is fully zero because no resources are yet assigned for that process. Eg: At the beginning of process P2, the figures for the rows for P2 in matrix A will be all 0, and those in Matrix will be 3,3 and 2. Step 2: - When a process requests the OS for a resource, the OS finds out whether the resource is free and whether it can be allocated by using the vector F. if it can be allocated, the OS does so, and updates matrix A by adding 1 to the appropriate slot. It simultaneously subtract 1 from the corresponding slot of matrix B Eg: - if the OS allocates tape drive to processP2, the rows for P2 in the matrix A will become 1,0,0 and rows with Matrix B will correspondingly become 2,3and 2. Step 3: - Whenever a process makes a request to OS for any resource, before making the actual allocation, it makes an imaginary allocation using bankers algorithm to ensure that there need not be a deadlock. The OS actually allocates the resource only after ensuring this. If it finds that there can be a deadlock after imaginary allocation, it postpones the decision to allocate that resource. During the imaginary allocation the OS conclude about the safe and unsafe state in the following manner. It looks at vector F and each row of the Matrix B. It compares them on a vector to vector basis ie, within the vector, it compares each digit separately to conclude whether all the resources that a process is going to need to complete are available at this point or not. Prepared by Shine N Das
  • 11. 11 Dept of Computer Science & Engineering, CEM Eg: - Figure shows F= 111. If the OS decides to allocate all needed resources to P0, it compares 111 with 100, (111> 100), on a vector basis, and P0 can go for completion. Similarly the OS decided to allocate resources to P1. P1 can complete (111 >100) etc. the rows for P2 is 211, therefore P2 cannot complete unless there is one more tape drive is available (111 < 211). For each request for any resources by a process the operating system goes through all these trial or imaginary allocations and updations, and if it finds that after the trial allocation, the state of the system would be ‘safe’, it does ahead and makes an allocation in real sense. Example 1 Suppose process P1 requests for 1 tape drive when the resources allocated to various processes are given in the fig. The OS has to decide whether to grant this request or not. The Bankers Algorithm proceeds to determine this as follows. • If a tape drive is allocated to P1, F will become 011 and the resources still required for P1 in matrix B will become 010. • If P1 is given all the resources it needs to complete, the rows for assigned resources of P1 in matrix A will become 120 and after this allocation F will become 001. • At the end of the execution of P1, all the resources used by P1 will become free and F will become 120 + 001 =121. we can now erase the row P1 from both the matrices indicating that this is how the matrices will look if P1 is granted its first request. • We repeat the same step with other rows. For instance now F=121. Therefore the OS will have sufficient resources to complete either P0 or P3 but not P2. Let us take P0, assuming that all the required resources are allocated to P0 one by one. The rows for P0 in matrix A become 300 and matrix B becomes 000. F at this point becomes 121 – 100 = 021. If P0 is now allocated to completion, all the resources held by P0 will be returned to F and F becomes 021 + 300 = 321. • Now either P2 or P3 can be chosen for this ‘trial allocation’. Let us assume that P3 is allocated. The recourse required by P3 are111. Therefore after trial allocation, rows of P3 in Matrix A becomes 212 and Matrix B becomes 000. The value of F become now 321 – 111 = 210. After the process completion the resources are returned back to F and F becomes 210 + 212 = 422. Prepared by Shine N Das
  • 12. 12 Dept of Computer Science & Engineering, CEM • At the end P2 will be allocated and completed. At this point resources allocated to P2 is 332, and F would be 422 – 211. In the end, resources will be returned to the free pool. Therefore F = 322 + 211 = 543. This is the same as the total resource vector T that are known to the system. Prepared by Shine N Das