Net Lease Big Box Report
•
1 recomendación•487 vistas

Net lease big box report from The Boulder Group

Recomendados
Recomendados
Más contenido relacionado
Similar a Net Lease Big Box Report
Similar a Net Lease Big Box Report (20)
Más de The Boulder Group
Más de The Boulder Group (20)
Último
Último (20)
Net Lease Big Box Report
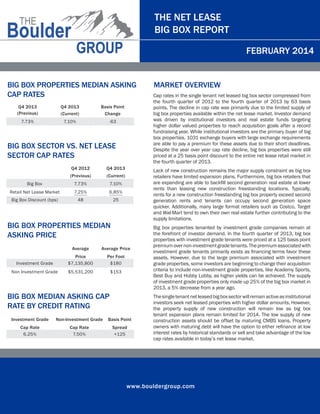
- 1. THE NET LEASE BIG BOX REPORT FEBRUARY 2014 BIG BOX PROPERTIES MEDIAN ASKING CAP RATES Q4 2013 (Previous) Q4 2013 (Current) Basis Point Change 7.73% 7.10% -63 BIG BOX SECTOR VS. NET LEASE SECTOR CAP RATES Q4 2012 Q4 2013 (Previous) (Current) Big Box 7.73% 7.10% Retail Net Lease Market 7.25% 6.85% Big Box Discount (bps) 48 25 Average Average Price Investment Grade Price $7,135,800 Per Foot $180 Non Investment Grade $5,531,200 $153 BIG BOX MEDIAN ASKING CAP RATE BY CREDIT RATING Cap rates in the single tenant net leased big box sector compressed from the fourth quarter of 2012 to the fourth quarter of 2013 by 63 basis points. The decline in cap rate was primarily due to the limited supply of big box properties available within the net lease market. Investor demand was driven by institutional investors and real estate funds targeting higher dollar valued properties to reach acquisition goals after a record fundraising year. While institutional investors are the primary buyer of big box properties, 1031 exchange buyers with large exchange requirements are able to pay a premium for these assets due to their short deadlines. Despite the year over year cap rate decline, big box properties were still priced at a 25 basis point discount to the entire net lease retail market in the fourth quarter of 2013. Lack of new construction remains the major supply constraint as big box retailers have limited expansion plans. Furthermore, big box retailers that are expanding are able to backfill second generation real estate at lower rents than leasing new construction freestanding locations. Typically, rents for a new construction freestanding big box property exceed second generation rents and tenants can occupy second generation space quicker. Additionally, many large format retailers such as Costco, Target and Wal-Mart tend to own their own real estate further contributing to the supply limitations. BIG BOX PROPERTIES MEDIAN ASKING PRICE MARKET OVERVIEW Investment Grade Non-Investment Grade Basis Point Cap Rate 6.25% Cap Rate 7.50% Spread +125 Big box properties tenanted by investment grade companies remain at the forefront of investor demand. In the fourth quarter of 2013, big box properties with investment grade tenants were priced at a 125 basis point premium over non-investment grade tenants. The premium associated with investment grade tenants primarily exists as financing terms favor these assets. However, due to the large premium associated with investment grade properties, some investors are beginning to change their acquisition criteria to include non-investment grade properties, like Academy Sports, Best Buy and Hobby Lobby, as higher yields can be achieved. The supply of investment grade properties only made up 25% of the big box market in 2013, a 5% decrease from a year ago. The single tenant net leased big box sector will remain active as institutional investors seek net leased properties with higher dollar amounts. However, the property supply of new construction will remain low as big box tenant expansion plans remain limited for 2014. The low supply of new construction assets should be offset by maturing CMBS loans. Property owners with maturing debt will have the option to either refinance at low interest rates by historical standards or sell and take advantage of the low cap rates available in today’s net lease market. www.bouldergroup.com
- 2. THE NET LEASE BIG BOX REPORT FEBRUARY 2014 MEDIAN ASKING CAP RATE BY SQUARE FOOTAGE SF Range Cap Rate 20,000-40,000 7.05% 52% Mid Box 40,000-80,000 7.18% Over 80,000 7.58% Percentage of Market Junior Big Box MEDIAN ASKING CAP RATE BY LEASE TERM REMAINING Non Investment Grade 16-20 5.80% 6.74% 32% 11-15 5.98% 7.50% 15% 6-10 6.42% 7.65% 5 & Under Large Format Investment Grade 6.90% 8.25% Years Remaining BIG BOX MEDIAN ASKING CAP RATE BY REGION 6.63% 7.35% 7.50% T AS E TH OR N WEST MOUNTAIN MIDWEST SOUTH 8.00% 7.25% www.bouldergroup.com
- 3. THE NET LEASE BIG BOX REPORT FEBRUARY 2014 SELECTED BIG BOX CLOSED TRANSACTIONS IN 2013 Sale Date Mar-13 Sep-13 May-13 Sep-13 Mar-13 Jan-13 Dec-13 Dec-13 May-13 Sep-13 Sep-13 Dec-13 Nov-13 Oct-13 Tenant Mariano's Sam's Club Wal-Mart Supercenter LA Fitness Dick's Sporting Goods Home Depot Kohl's hhgregg Academy Sports Best Buy PetSmart Aldi Dollar General Market Gander Mountain City Palatine Lone Tree Valdosta Royal Oak Eugene Henderson Avondale Boca Raton Valdosta Alpharetta Seattle Addison Fresno Peoria State IL CO GA MI OR NV AZ FL GA GA WA IL CA IL Price $22,674,642 $17,617,000 $15,100,000 $14,142,856 $13,725,000 $13,500,000 $10,600,000 $10,100,000 $9,790,000 $8,150,000 $7,200,000 $5,475,000 $4,200,000 $3,600,000 Price Per SF $324 $136 $84 $314 $228 $132 $119 $243 $137 $180 $276 $198 $208 $116 Cap Rate 6.57% 6.25% 5.60% 7.00% 7.42% 7.96% 6.55% 7.96% 7.51% 8.98% 7.55% 5.81% 6.77% 8.90% Lease Term Remaining 19 6 13 17 13 5 10 8 15 6 5 15 14 6 COMPANY COMPARISON Tenant 24 Hour Fitness Academy Sports Bed Bath & Beyond Best Buy BJ's Wholesale Dick’s Sporting Goods Gander Mountain Hobby Lobby Kmart Kohl's Kroger La Fitness Lowe's Petco PetSmart Ross Shopko Sports Authority Sprouts Farmers Market Staples The Home Depot Wal-Mart Whole Foods Total Number Credit of Stores Rating 400+ B 170+ Not Rated 1,000+ BBB+ 1,055 BB 200 B525 Not Rated 131 Not Rated 561 Not Rated 1,221 CCC+ 1,158 BBB+ 2,424 BBB 500+ Not Rated 1,750 A970 B 1,192 BB+ 1,037 A332 Not Rated 460 B150 BB1,575 BBB 2,248 A 11,137 AA 365 BBB- Market Cap Private Private $13 B $8 B Private $6 B Private Private $4 B $10 B $18 B Private $50 B Private $6 B $14 B Private Private $5 B $8 B $111 B $239 B $18 B FOR MORE INFORMATION AUTHOR John Feeney | Research Director john@bouldergroup.com CONTRIBUTORS Randy Blankstein | President rblank@bouldergroup.com Jimmy Goodman | Partner jimmy@bouldergroup.com Zach Wright| Research Analyst zach@bouldergroup.com © 2014. The Boulder Group. Information herein has been obtained from databases owned and maintained by The Boulder Group as well as third party sources. We have not verified the information and we make no guarantee, warranty or representation about it. This information is provided for general illustrative purposes and not for any specific recommendation or purpose nor under any circumstances shall any of the above information be deemed legal advice or counsel. Reliance on this information is at the risk of the reader and The Boulder Group expressly disclaims any liability arising from the use of such information. This information is designed exclusively for use by The Boulder Group clients and cannot be reproduced, retransmitted or distributed without the express written consent of The Boulder Group. www.bouldergroup.com