Показники інфляції в Євросоюзі та зоні євро в січні 2017 року
•
1 recomendación•3,567 vistas

Показники інфляції в Євросоюзі та зоні євро в січні 2017 року

Recomendados
Recomendados
Más contenido relacionado
Destacado
Destacado (7)
Similar a Показники інфляції в Євросоюзі та зоні євро в січні 2017 року
Similar a Показники інфляції в Євросоюзі та зоні євро в січні 2017 року (20)
Más de tsnua
Más de tsnua (20)
Último
Último (20)
Показники інфляції в Євросоюзі та зоні євро в січні 2017 року
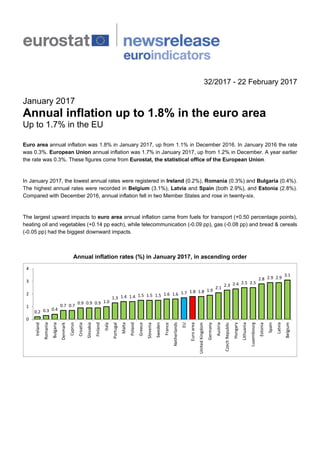
- 1. 32/2017 - 22 February 2017 January 2017 Annual inflation up to 1.8% in the euro area Up to 1.7% in the EU Euro area annual inflation was 1.8% in January 2017, up from 1.1% in December 2016. In January 2016 the rate was 0.3%. European Union annual inflation was 1.7% in January 2017, up from 1.2% in December. A year earlier the rate was 0.3%. These figures come from Eurostat, the statistical office of the European Union. In January 2017, the lowest annual rates were registered in Ireland (0.2%), Romania (0.3%) and Bulgaria (0.4%). The highest annual rates were recorded in Belgium (3.1%), Latvia and Spain (both 2.9%), and Estonia (2.8%). Compared with December 2016, annual inflation fell in two Member States and rose in twenty-six. The largest upward impacts to euro area annual inflation came from fuels for transport (+0.50 percentage points), heating oil and vegetables (+0.14 pp each), while telecommunication (-0.09 pp), gas (-0.08 pp) and bread & cereals (-0.05 pp) had the biggest downward impacts. Annual inflation rates (%) in January 2017, in ascending order 0.2 0.3 0.4 0.7 0.7 0.9 0.9 0.9 1.0 1.3 1.4 1.4 1.5 1.5 1.5 1.6 1.6 1.7 1.8 1.8 1.9 2.1 2.3 2.4 2.5 2.5 2.8 2.9 2.9 3.1 0 1 2 3 4 Ireland Romania Bulgaria Denmark Cyprus Croatia Slovakia Finland Italy Portugal Malta Poland Greece Slovenia Sweden France Netherlands EU Euroarea UnitedKingdom Germany Austria CzechRepublic Hungary Lithuania Luxembourg Estonia Spain Latvia Belgium
- 2. Inflation rates (%) measured by HICP Annual rate Monthly rate Jan 16 Aug 16 Sep 16 Oct 16 Nov 16 Dec 16 Jan 17 Jan 17 Euro area 0.3 0.2 0.4 0.5 0.6 1.1 1.8 -0.8 EU 0.3 0.3 0.4 0.5 0.6 1.2 1.7 -0.6 Belgium 1.8 2.0 1.8 1.9 1.7 2.2 3.1 -0.9 Bulgaria -0.4 -1.1 -1.1 -1.0 -0.8 -0.5 0.4p 0.7p Czech Republic 0.5 0.6 0.5 0.8 1.6 2.1 2.3 0.8 Denmark 0.4 0.0 -0.3 0.1 0.1 0.3 0.7 -0.1 Germany 0.4 0.3 0.5 0.7 0.7 1.7 1.9 -0.8 Estonia 0.1 1.1 1.7 1.0 1.4 2.4 2.8 0.3 Ireland 0.0 -0.4 -0.3 -0.4 -0.2 -0.2 0.2 -0.5 Greece -0.1 0.4 -0.1 0.6 -0.2 0.3 1.5 -0.5 Spain -0.4 -0.3 0.0 0.5 0.5 1.4 2.9 -1.0 France 0.3 0.4 0.5 0.5 0.7 0.8 1.6 -0.3 Croatia -0.2 -1.5 -0.7 -0.3 0.2 0.7 0.9 -0.2 Italy 0.4 -0.1 0.1 -0.1 0.1 0.5 1.0 -1.7 Cyprus -1.1 -0.6 -0.4 -1.0 -0.8 0.1 0.7 -0.8 Latvia -0.3 -0.1 0.5 1.1 1.2 2.1 2.9 0.1 Lithuania 0.7 0.5 0.6 0.7 1.1 2.0 2.5 0.2 Luxembourg 0.5 -0.2 0.3 0.7 0.6 1.6 2.5 -0.6 Hungary 1.0 -0.1 0.7 1.1 1.1 1.8 2.4 0.4 Malta 0.8 1.0 0.9 0.5 0.8 1.0 1.4 -1.1 Netherlands 0.2 0.1 -0.1 0.3 0.4 0.7 1.6p -0.6p Austria 1.4 0.6 1.1 1.4 1.5 1.6 2.1 -0.6 Poland -0.3 -0.5 -0.2 0.1 0.2 0.9 1.4 0.3 Portugal 0.7 0.8 0.7 1.1 0.5 0.9 1.3 -0.7 Romania -1.5 0.3 -0.1 0.1 -0.2 -0.1 0.3 -0.1 Slovenia -0.8 -0.2 0.2 0.7 0.7 0.6 1.5 -0.4 Slovakia -0.6 -0.8 -0.5 -0.3 -0.2 0.2 0.9 0.3 Finland 0.0 0.5 0.5 0.6 0.6 1.1 0.9 -0.7 Sweden 1.3 1.2 0.8 1.1 1.3 1.7 1.5 -0.8 United Kingdom 0.3 0.6 1.0 0.9 1.2 1.6 1.8 -0.5 Iceland 1.1 0.7 1.1 0.3 0.6 -0.1 -0.6 -1.2 Norway 3.1 4.5 4.1 4.1 3.9 3.8 2.9 -0.4 Switzerland -1.5 0.0 -0.3 -0.3 -0.2 -0.2 0.3 -0.2 The source dataset is available here. p = provisional Annual inflation (%) in the euro area and European Union -1 0 1 2 3 4 5 Jan Apr Jul Oct Jan Apr Jul Oct Jan Apr Jul Oct Jan Apr Jul Oct Jan Apr Jul Oct Jan Apr Jul Oct Jan Apr Jul Oct Jan Apr Jul Oct Jan Apr Jul Oct Jan 2008 2009 2010 2011 2012 2013 2014 2015 2016 2017 Euro area EU
- 3. Euro area inflation rates (%), selected aggregates Weight (‰) Annual rate Monthly rate 2017 Jan 16 Aug 16 Sep 16 Oct 16 Nov 16 Dec 16 Jan 17 Jan 17 All-items HICP 1000.0 0.3 0.2 0.4 0.5 0.6 1.1 1.8 -0.8 All-items excluding: > energy 904.7 1.0 0.9 0.8 0.7 0.8 1.0 1.1 -1.2 > energy, unprocessed food 829.5 1.0 0.8 0.8 0.7 0.8 0.9 0.9 -1.4 > energy, food, alcohol & tobacco 708.8 1.0 0.8 0.8 0.8 0.8 0.9 0.9 -1.7 > energy, seasonal food 864.3 0.9 0.7 0.7 0.7 0.8 0.9 0.9 -1.4 > tobacco 976.3 0.3 0.2 0.4 0.5 0.5 1.1 1.7 -0.9 Food, alcohol & tobacco 195.9 1.0 1.3 0.7 0.4 0.7 1.2 1.8 0.7 > processed food, alcohol & tobacco 120.8 0.8 0.5 0.5 0.5 0.7 0.7 0.7 0.2 > unprocessed food 75.1 1.4 2.5 1.1 0.2 0.7 2.1 3.5 1.5 Energy 95.3 -5.4 -5.6 -3.0 -0.9 -1.1 2.6 8.1 2.5 Non-energy industrial goods 263.1 0.7 0.3 0.3 0.3 0.3 0.3 0.5 -3.5 Services 445.7 1.2 1.1 1.1 1.1 1.1 1.3 1.2 -0.7 Sub-indices with largest impacts on euro area annual inflation Weight (‰) Annual rate (%) Impact (pp) 2017 Jan 17 Jan 17 07.22 Fuels for transport 41.0 14.0 0.50 04.53 Heating oil 6.4 26.4 0.14 01.17 Vegetables 17.4 9.8 0.14 01.11 Bread and cereals 26.3 0.1 -0.05 04.52 Gas 17.5 -2.3 -0.08 08.2/3 Telecommunication 30.6 -1.2 -0.09 Geographical coverage The euro area consists of Belgium, Germany, Estonia, Ireland, Greece, Spain, France, Italy, Cyprus, Latvia, Lithuania, Luxembourg, Malta, the Netherlands, Austria, Portugal, Slovenia, Slovakia and Finland. The European Union includes Belgium, Bulgaria, the Czech Republic, Denmark, Germany, Estonia, Ireland, Greece, Spain, France, Croatia, Italy, Cyprus, Latvia, Lithuania, Luxembourg, Hungary, Malta, the Netherlands, Austria, Poland, Portugal, Romania, Slovenia, Slovakia, Finland, Sweden and the United Kingdom. The euro area and European Union data refer to the respective country compositions at a specific point in time. New Member States are integrated into the aggregates using a chain index formula. Methods and definitions The annual rate measures the change of the Harmonised Indices of Consumer Prices (HICP) between a month and the same month of the previous year, and the monthly rate compares the indices between the two latest months. An impact is a measure showing the change in the inflation due to the inclusion of a sub-index. The impact takes account of both the weight and whether the inflation for that sub-index is higher or lower than the all-items inflation rate. Revisions and timetable A flash estimate of euro area inflation is issued at the end of each reference month. The euro area flash estimate for January 2017, published on 31 January 2017, was 1.8%. The next flash estimate of euro area inflation with data for February 2017 is scheduled for 2 March 2017. For more information Eurostat website section on inflation Eurostat database section on inflation Eurostat Statistics Explained article on inflation in the euro area Eurostat metadata on inflation Eurostat €-indicators release calendar
- 4. Issued by: Eurostat Press Office Tim ALLEN Tel: +352-4301-33 444 eurostat-pressoffice@ec.europa.eu ec.europa.eu/eurostat/ For further information on methodology: Svetoslava PAVLOVA Tel: +352-4301-34 406 estat-hicp@ec.europa.eu @EU_Eurostat Media requests: Eurostat media support / Tel: +352-4301-33 408 / eurostat-mediasupport@ec.europa.eu