![BACKGROUND ,[object Object],[object Object],[object Object],[object Object],[object Object]](data:image/gif;base64,R0lGODlhAQABAIAAAAAAAP///yH5BAEAAAAALAAAAAABAAEAAAIBRAA7)
Recomendados
Recomendados
Más contenido relacionado
La actualidad más candente
La actualidad más candente (19)
Destacado
Destacado (11)
Similar a High-Risk Multiple Myeloma: Distinguishing Early Failures from Sustained Control
Similar a High-Risk Multiple Myeloma: Distinguishing Early Failures from Sustained Control (20)
Último
Último (20)
High-Risk Multiple Myeloma: Distinguishing Early Failures from Sustained Control
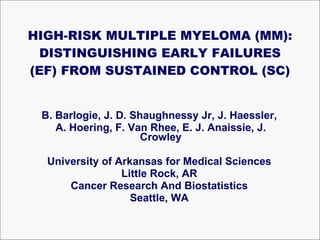
- 1. HIGH-RISK MULTIPLE MYELOMA (MM): DISTINGUISHING EARLY FAILURES (EF) FROM SUSTAINED CONTROL (SC) B. Barlogie, J. D. Shaughnessy Jr, J. Haessler, A. Hoering, F. Van Rhee, E. J. Anaissie, J. Crowley University of Arkansas for Medical Sciences Little Rock, AR Cancer Research And Biostatistics Seattle, WA
- 3. TT2 (BOTH ARMS): CLINICAL OUTCOMES ACCORDING TO GEP-DEFINED RISK OVERALL SURVIVAL 0% 20% 40% 60% 80% 100% 0 2 4 6 8 10 Years from Start of Protocol Therapy Low Risk: 109/305 High Risk: 35/46 P < 0.0001 EVENT-FREE SURVIVAL 0% 20% 40% 60% 80% 100% 0 2 4 6 8 10 Years from Start of Protocol Therapy Low Risk: 186/305 High Risk: 39/46 P < 0.0001 2 distinct components in high-risk disease: early failure (EF) and sustained control (SC): breakpoint at 3 years EF SC EF SC
- 6. HIGHER FREQUENCY OF UNFAVORABLE GEP FEATURES IN EF vs SC MYELOMA Logistic Regression – OLD DEF 3 ( Not yet died or survived >= 3yrs post enrollment vs. rest ): SURVIVAL MODEL CR DUR MODEL VARIABLE EF (N=65) SC (N=58) P EF (N=38) SC (N=28) P B2M >=5.5mg/L 45% 50% 0.55 45% 32% 0.30 Albumin <3.5g/dL 49% 45% 0.63 50% 29% 0.08 LDH >= 190 U/L 60% 43% 0.06 66% 50% 0.20 CA 78% 67% 0.18 78% 79% 0.99 GEP >median score 60% 38% <0.02 68% 39% 0.02 GEP delTP53 22% 5% <0.01 18% 7% 0.28
- 7. MV LOGISTIC REGRESSION ANALYSIS OF VARIABLES LINKED TO EF vs SC Logistic Regression – OLD DEF 3 ( Not yet died or survived >= 3yrs post enrollment vs. rest ): * > MEDIAN IN HIGH-RISK MM % EF WITH FACTOR MODEL Variable N YES NO OR P SURVIVAL GEP delTP53 120 81% 48% 4.60 0.025 GEP very high risk* 120 64% 42% 2.41 0.022 CR DURATION GEP very high risk* 64 69% 41% 3.09 0.031
- 8. SHIFT TO HIGHER GEP RISK SCORE IN EF vs SC HIGH-RISK MYELOMA p-value=0.007 p-value=0.003 SURVIVAL MODEL CR DURATION MODEL SC EF
- 9. SURVIVAL MODEL-BASED GEP DIFFERENCES BETWEEN EF AND SC p-value=0.015 Most CD-1 is EF Shift to higher PI in EF vs SC p-value=0.348 60 40 30 10 20 50 Frequency 0.10 0.8 0.4 0.2 0 0.6 0.12 PR MY MS MF LB HY CD-2 CD-1
- 10. 14 GENES DISTINGUISH EF AND SC SUBGROUPS OF HIGH-RISK MYELOMA EF SC C20orf142 TP53INP ST6GAL1 235659_at YIPF6 MAN2A1 MEIS1 SPIB RNF43 SHISA SLC43A3 PLK1 RUNX2 PMAIP1 P < 0.0001 (FDR: 15.8%)
- 11. EXAMPLES OF EF-ASSOCIATED GENES Gene Description Chr SHISA WNT repressor and head inducer ; endoplasmic reticulum ; Wnt ligand signals through co-receptor on PM; single pass LRP5 and seven pass Frizzled (Fz); SHISA removes Frizzled receptor from PM via ER retention; NOTE: DKK1, head inducer; secreted; WNT repressor; removes LRP5/6 from PM thru endocytosis ; Supports role for Wnt suppression in MM pathogenesis 4p13 PLK1 S/K kinase ; nuclear; regulates centrosome maturation, spindle assembly, chromosome arm cohesions, APC/C inhibition, mitotic exit and cytokinesis; Interacts with EVI5, EVI5 is one of 19 in GEP70; may suppress EVI5? 16p12 SPIB Ets family transcription factor ; nuclear ; controls pDC and B-cell development; expressed in liver stem cells; linked to recent surge in liver mets?; Is EF disease a plasmacytoid dendritic cell neoplasm? 19q13 TP53INP1 TP53 inducible; nuclear ; concentrated in PML/POD/ND10 nuclear bodies; induces TP53-phosphorylation and TP53-mediated apoptosis 8q22 MAN2A1 Complex N-glycan biosynthesis; Golgi; Mutations causes SLE-like Dx in mice; inversely correlated with SHISA; Does Wnt suppression eliminate N-glycan modifications in MM cells? 5q21.2
- 13. Vel and VTDPACE PGx: Differential Sensitivity of TP53INP1 to Induction Chemo UP-REGULATION WITHIN 48HR OF TP53INP1 BY BORTEZOMIB AND AUGMENTED BY ADDED TDPACE RANKING TP53INP1 BASELINE VALUES FROM LOW TO HIGH, 48HR F/U POST-VEL & VTDPACE AS PART OF TOTAL THERAPY 3
- 14. TP53INP1 PGx Melphalan (10mg/m 2 x 48h) in Newly Diagnosed Disease TP53INP1 CAN BE UP-REGULATED BY TEST DOSE OF MELPHALAN 10MG/M 2 IN 48HR
Notas del editor
- NOTES: No genes overlapping with GEP70. Note high correlation of genes within each group PMAIP1/NOXA may define unique disease subset; NOXA targets MCL1, a 1q21 candidate gene, for proteasomal degradation; is VEL contraindicated; Note: MYB also removed/neutralized by proteasomal degradation PLK interacts with EVI5 a low 19 in GEP70 mapping to 1p22; high PLK might cooperate with del1p TP53INP1 regulated by TP53; high denovo TP53INP1 points to active TP53 in SC or cure fraction MAN2A1 and ST6GAL in EF point to loss of N-glycan biosynthesis; This is supported by MS proteomics SHISA, a Wnt suppressor that sequesters Frizzled in ER, acts similar to DKK1, which sequesters LRP5 by removal from PM SPIB induces plasmacytoid-dendritic cell differentiation; does this mean EF disease is pDC?; Wnt regulates keratinocyte differentiation/pDC like; are these are these pDC? MM can make dendritic processes, especially in MMCL; Lenalidomide induces RUNX2 is an osteoblast marker and FITM2 is an adipocyte marker; Ultra high risk is RUNX-positive OB-like
- If high expression is good then it stands to reason that upregulation following short term PGx should be good too! Is a a) baseline, b) post drug, or c) change in TP53INP1 expression related to outcome? If not, such a link might be masked, e,g, they are GEP70 dependent? Subtype specific? delTp53 dependent? MDM2 and TP53 status? TP53INP1 is ROS activated (Ref). This may explain important role of ROS inducers, i.e. IMiDs in Mel-based ASCT? Does upregulation or lack thereof reflect degree of endogenous ROS? Can another type of drug, i.e. lenalidomide, which is a potent inducer of ROS, activate TP53INP1 to a greater degree and especially lift those disease entities exhibiting negligible change in response to Vel-Mel PGx challenge? Differentiate GEP signatures of those that do VERSUS those that don’t activate TP53INP1 following Vel-Mel ? And then compare such results to Len-Mel If hypotheses hold up, we will consider such to be strong rationale for ”HIGH DOSE LENALIDOMIDE IN COMBO WITH HIGH DOSE MEL” Does prior Velcade alter/influence Mel-induced changes seen here? IF true, does this shed light on Vel-Mel synergy, which is purported to be related to DNA repair pathway? IF true is this related to the improved outcome in TT3 v TT2? Reduction in expression tends to occur in the 20% with. One could hypothesize that the reduction is due to treatment induced apoptosis in a TP53INP1 HIGH population. This could be true for all cases where there is a reduction after treatment. Do we see similar changes in BX?
- If high expression is good then it stands to reason that upregulation following short term PGx should be good too! Is a a) baseline, b) post drug, or c) change in TP53INP1 expression related to outcome? If not, such a link might be masked, e,g, they are GEP70 dependent? Subtype specific? delTp53 dependent? MDM2 and TP53 status? TP53INP1 is ROS activated (Ref). This may explain important role of ROS inducers, i.e. IMiDs in Mel-based ASCT? Does upregulation or lack thereof reflect degree of endogenous ROS? Can another type of drug, i.e. lenalidomide, which is a potent inducer of ROS, activate TP53INP1 to a greater degree and especially lift those disease entities exhibiting negligible change in response to Vel-Mel PGx challenge? Differentiate GEP signatures of those that do VERSUS those that don’t activate TP53INP1 following Vel-Mel ? And then compare such results to Len-Mel If hypotheses hold up, we will consider such to be strong rationale for ”HIGH DOSE LENALIDOMIDE IN COMBO WITH HIGH DOSE MEL” Does prior Velcade alter/influence Mel-induced changes seen here? IF true, does this shed light on Vel-Mel synergy, which is purported to be related to DNA repair pathway? IF true is this related to the improved outcome in TT3 v TT2? Reduction in expression tends to occur in the 20% with. One could hypothesize that the reduction is due to treatment induced apoptosis in a TP53INP1 HIGH population. This could be true for all cases where there is a reduction after treatment. Do we see similar changes in BX?