State of Sustainable Tourism in Minnesota 2013 Initial Assessment of Water and Energy Practices
•
1 recomendación•475 vistas

A look at the status of sustainable tourism practices in Minnesota, with a focus on actions in the areas of energy and water, as well as the perceived benefits and barriers to implementing these practices.
Recomendados

Recomendados
Más contenido relacionado
La actualidad más candente
La actualidad más candente (20)
Similar a State of Sustainable Tourism in Minnesota 2013 Initial Assessment of Water and Energy Practices
Similar a State of Sustainable Tourism in Minnesota 2013 Initial Assessment of Water and Energy Practices (20)
Más de University of Minnesota Tourism Center
Más de University of Minnesota Tourism Center (20)
State of Sustainable Tourism in Minnesota 2013 Initial Assessment of Water and Energy Practices
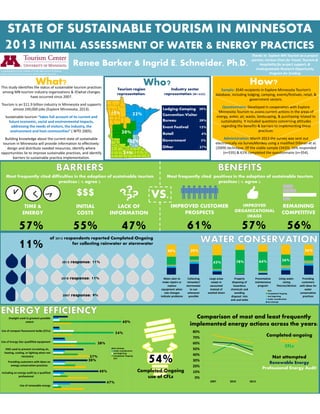
- 1. Who? STATE OF SUSTAINABLE TOURISM IN MINNESOTA $$$ Most frequently cited difficulties in the adoption of sustainable tourism practices ( % agree ): TIME & ENERGY INITIAL COSTS LACK OF INFORMATION 57% Most frequently cited positives in the adoption of sustainable tourism practices ( % agree ): 55% 47% VS. IMPROVED CUSTOMER PROSPECTS IMPROVED ORGANIZATIONAL IMAGE REMAINING COMPETITIVE 61% 57% 56% How?What? 54% Completed/Ongoing use of CFLs 45% 78% 64% 36% 40% 39% 36% N/A Completed/ Ongoing Just beginning Under consideration No attempt Water plan to make repairs or replace equipment when rate changes indicate problems Collecting rainwater/ stormwater to use whenever possible Large areas swept or vacuumed instead of washed down Properly disposing of hazardous chemicals and avoiding disposal into sink and toilet Preventative maintenance program Using water saving fixtures/devices Providing customers with ideas for water conservation practices This study identifies the status of sustainable tourism practices among MN tourism industry organizations & if/what changes have occurred since 2007. Tourism is an $11.9 billion industry in Minnesota and supports almost 240,000 jobs (Explore Minnesota, 2013). Sustainable tourism ““takes full account of its current and future economic, social and environmental impacts, addressing the needs of visitors, the industry, the environment and host communities”” ( WTO 2005). Building knowledge about the current state of sustainable tourism in Minnesota will provide information to effectively: design and distribute needed resources, identify where opportunities lie to improve sustainable practices, and identify barriers to sustainable practice implementation. Sample: 3540 recipients in Explore Minnesota Tourism’’s database, including lodging, camping, events/festivals, retail, & government sectors. Questionnaire: Developed in cooperation with Explore Minnesota Tourism to assess current actions in the areas of energy, water, air, waste, landscaping, & purchasing related to sustainability. It included questions concerning attitudes regarding the benefits & barriers to implementing these practices. Administration: March 2013 the survey was sent out electronically via SurveyMonkey using a modified Dillman et al. (2009) technique. Of the viable sample (3420), 16% responded (n=535) & 61% completed the questionnaire (n=354). of 2013 respondents reported Completed/Ongoing for collecting rainwater or stormwater 11% 2013 INITIAL ASSESSMENT OF WATER & ENERGY PRACTICES Renee Barker & Ingrid E. Schneider, Ph.D. Comparison of most and least frequently implemented energy actions across the years: Industry sector representation (n=535): Thanks to Explore MN Tourism as a project partner, Carlson Chair for Travel, Tourism & Hospitality for project support, & Undergraduate Research Opportunity Program for funding A collaboration of the College of Food, Agricultural & Natural Resource Sciences & University of Minnesota Extension 0% 10% 20% 30% 40% 50% 60% 70% 80% 2007 2010 2013 Completed/ongoing Daylight CFLs Not attempted Renewable Energy Professional Energy Audit Retail 4% Lodging/Camping 39% Convention/Visitor Bureau 39% Event/Festival 15% Government 5% Other 27% 2010 response: 11% 2007 response: 9% 2013 response: 11% Daylight used to greatest possible extent Use of compact fluorescent bulbs (CFLs) Use of Energy Star qualififed equipment EMS used to prevent circulating air, heating, cooling, or lighting when not necessary Providing customers with ideas on energy conservation practices Including an energy audit by a qualified professional Use of renewable energy No attempt Under consideration Just beginning Completed/ Ongoing N/A 60% 54% 38% 27% 30% 40% 47% 20% 15% 22% 22% 21% Tourism region representation: