
Recomendados
Recomendados
Más contenido relacionado
Último
Último (20)
Destacado
Destacado (20)
Presentation11
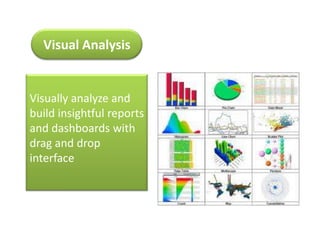
- 1. Visual Analysis Visually analyze and build insightful reports and dashboards with drag and drop interface
- 2. Wide Range of Reporting Components Use variety of charts, pivot tables and tabular view components to build insightful reports and dashboards.
- 3. A typical database_sql_queries.xml file looks like below : A typical database_sql_queries.xml file looks like below : Query with SQL Create powerful and flexible reports with SQL Queries written in any database dialect/syntax.
- 4. Collaborative Analysis Develop reports together with colleagues. Share with each other for informed business decision making.
- 6. Embed Reports Anywhere Embed reports and dashboards across Websites, Intranet, Blogs, Microsoft SharePoint Server and Applications for wider consumption.
- 7. Organize your Reports into Folders Organize reports and data logically into folders. Helpful in better organization and easy navigation.
- 9. Highly Secure Access to data and reports are secured with proper user name and password. Also supports HTTPS