Bar diagram
•Descargar como DOCX, PDF•
2 recomendaciones•1,519 vistas

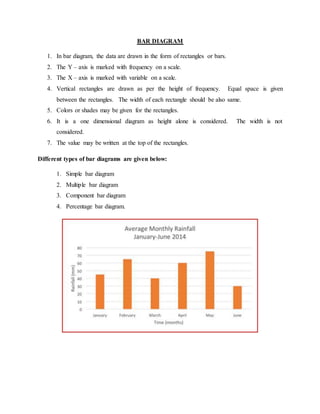
A bar diagram displays data using rectangular bars, with the height of each bar corresponding to the frequency of the variable it represents. The frequency scale is shown on the y-axis and the variables on the x-axis. Each bar is drawn at a uniform width with equal spacing between bars. Bar diagrams can be simple, multiple, component, or percentage based on how many variables are shown.

Recomendados
Más contenido relacionado
La actualidad más candente
La actualidad más candente (20)
Más de Vidya Kalaivani Rajkumar
Más de Vidya Kalaivani Rajkumar (20)
Último
Último (20)
Bar diagram
- 1. BAR DIAGRAM 1. In bar diagram, the data are drawn in the form of rectangles or bars. 2. The Y – axis is marked with frequency on a scale. 3. The X – axis is marked with variable on a scale. 4. Vertical rectangles are drawn as per the height of frequency. Equal space is given between the rectangles. The width of each rectangle should be also same. 5. Colors or shades may be given for the rectangles. 6. It is a one dimensional diagram as height alone is considered. The width is not considered. 7. The value may be written at the top of the rectangles. Different types of bar diagrams are given below: 1. Simple bar diagram 2. Multiple bar diagram 3. Component bar diagram 4. Percentage bar diagram.