Stocktouch Overview - Jan 2016
•Descargar como PPTX, PDF•
0 recomendaciones•402 vistas

The document discusses data visualization and how mobile platforms enable breakthroughs in consuming large datasets over time through dynamic visualization. It highlights how companies are investing in acquiring new ways to detect trends within big data and how StockTouch provides a native platform for rapid visualization of data in an enriched and responsive format through techniques like predictive intelligence and chart signals. The document promotes StockTouch's traction in the market with over 1 million users and its recognition with awards and accolades.

Recomendados
Más contenido relacionado
La actualidad más candente
La actualidad más candente (20)
Similar a Stocktouch Overview - Jan 2016
Similar a Stocktouch Overview - Jan 2016 (20)
Último
Último (20)
Stocktouch Overview - Jan 2016
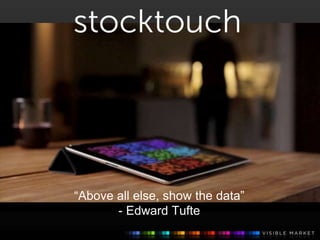
- 1. “Above all else, show the data” - Edward Tufte
- 2. “WE’RE ALL SUFFERING FROM INFORMATION OVERLOAD” -- David McCandless
- 4. Interact With Data As It Unfolds “The purpose of visualization is insight, not pictures.” -- Ben Schneiderman
- 5. “The greatest value of a picture is when it forces us to notice what we never expected to see” -- John Tukey
- 6. Change the Experience Mobile-Touch Platforms Enable Breakthroughs in Data Consumption Statistics give us norms. Dynamic visualization taps non-linear perception to encapsulate the movement and dispersion of large data sets over time.
- 7. Predictive Intelligence is Synthesized in Real Time Big Data Spending to Reach $60B by 2020 Companies are racing to acquire new ways to detect trends and patterns currently hidden within vast volumes of data. Source: Wikibon The opportunity: explosive post-PC growth, revolutionary data experiences
- 8. “Even in the red, StockTouch makes the stock market look good” -- GigaOm
- 9. “Graphical excellence is that which gives to the viewer the greatest number of ideas in the shortest time with the least ink in the smallest space.” -- Edward Tufte
- 10. Chart Signals & Technical Indications “To find signals, we must learn to reduce the noise” -- Stephen Few
- 11. Awards & Accolades Apple Rewind: Finance App of Year for iPad & Mac iTunes Essential App, New to the App Store, Hall of Fame, Tech Talks FinTech Innovation Lab & TechStars NYC Finalists Featured in iTunes Finance, Higher Education & Apple Retail Demos
- 12. Traction Over 1m Lifetime Uniques & 4m+ Updates 40-60k MAU 300k+ users latest version iTunes Featured 466+ Times for iPad 443+ Times for iPhone Wired / Wall St. & Technology: Top Mobile Apps on Wall Street Apps Magazine: Best Business App of Year
- 13. Native data visualization & gamification platform Rapid visualization of large data sets Dynamic, real-time, multi-tiered navigation Enriched, fluid & responsive formats 30fps image processing & smooth rendering Technology
- 14. Patents & Intellectual Property DYNAMIC VISUAL STATISTICAL DATA DISPLAY AND NAVIGATION SYSTEM AND METHOD FOR LIMITED DISPLAY DEVICE US Patent: 8,972,295* * Other patents pending.
- 15. “WHEN YOU'RE LOST IN INFORMATION, AN INFORMATION MAP IS KIND OF USEFUL” -- David McCandless