SlideShare una empresa de Scribd logo
1 de 7
TYPES OF RATIOS WITH THEIR IMPLICATIONS.
NO.           RATIO                 FORMULA                            NUMERATOR                       DENOMINATOR                              SIGNIFICANCE/ INDICATOR

 1     CURRENT RATIO:-             Current Assets                     Inventories/Stocks        Sundry Creditors(For Goods)      It states the ability to repay short term
                                 Current Liablilities     (+) Debtors & B/R                (+) Outstanding Expenses              commitments promptly.
                                                          (+) Cash & Bank                  (+) Short Term Loans &                (i.e. Short term solvency).
                                                          (+) Recivables / Accurals           Advances (CR.)                     Ideal ratio is 2:1
                                                          (+) Short Term Loans             (+) Bank Overdraft/ Cash              High ratio indicates existence
                                                          (+) Marketable Investment/          Credit                             of idle current Assets.
                                                             Short Term Securities.        (+) Provison for Taxation
                                                                                           (+) Proposed Dividend
                                                                                           (+) Unclaimed Dividend


 2     Acid test or Quick           Quick Assets                        Current Assets                 Current Liablilities      It indicates the ability to meet immediate
             Ratio:-              Quick Liablilities      (-) Inventories                  (-) Bank Overdraft                    liabilities. Ideal Ratio is 1.33:1
                                                          (-) Prepaid Expenses             (-) Cash Credit                       In case of emergency crisis this ratio helps
                                                                                                                                 in evaluating liablities meeting capacity.


 3       Turnover Ratios:-
      ( a ) Inventory Turnover   Cost of goods sold       For Manuacturers:-                                                     It basically indicates how fast inventory is
                 Ratio.            Average stock                     Opening Stock of FG       (Opening Stock + closing stock)   used/sold. High T/O ratio indicates fast
                                                          (+) Cost of Production                                2                moving material while low ratio may mean
                                                          (+) Closing Stock of FG                                                dead or excessive stock.
                                                          For Traders:-                                         or
                                                          Opening Stock of FG
                                                          (+) purchases                            (Max stock + Min. stock)
                                                          (-) Closing Stock of FG                               2


      ( b ) Debtor Turnover        Net Credit Sales       Credit Sales Net of Returns      Accounts Recivable= Debtors +         It hepls in indicating the speed of collection
                Ratio.            Average Debtors                                                                B/R             of credit sales / Debtors.
                                                                                           Average Acounts recivable =
                                                                                                 1/2 ( opg. Bal. + clg. Bal)


      ( c ) Creditor Turnover    Net Credit Purchase      Credit Purchase net of           Accounts Payable= Creditors +         It hepls in indicating the speed of payment to
                  Ratio.          Average Creditor        returns, if any.                                      B/P              creditors.
                                                                                           Average Acounts Payable =
                                                                                                 1/2 ( opg. Bal. + clg. Bal)


 4     Defensive - Interval        Liquid Assests                       Current Assets     Annual cash Expenses / 365            It states the total ability to meet regualar
            Ratio:-              Projected daily cash     (-) Inventories                  cash expenses = Total expenses        day in day out cash expenses.
                                    Requirement           (-) Prepaid Expenses                  - depreciation and write offs.


 5    Debt - Equity Ratio:-             Debt              Debt= Long term borrowed         Equity= Owerner's Funds= equity       It hepls in deriving reasonable relationship
                                       Equity             funds= Debentures+ long          capital+ Preference capital+          between Debt & Equity.
                                                                 term loans from           reserves & surplus - accumulated      Its ideal ratio is 2:1
fianancial Institutions.     losses.


6   Debt to capital ratio:-                Debt                Debt= Long term borrowed           Fixed Assests + net working           Its basically a indicator of use of external
                                       Total funds             funds= Debentures+ long                             capital              funds and total capital employed in total.
                                                                      term loans from                                                   ideal ratio = 67%
                                                                     fianancial Institutions.


7      Coverage Ratios:
    ( a ) Interest Coverage                EBIT                        Earnings before interest                 Interest on Debt        It hepls in indicating interest obligations. It
                Ratio.                   Interest                                and tax                                                states the ability to meet interest obligations
                                                                                                                                        of the current year.should ideally be greater
                                                                                                                                        than 1.


    ( b ) Dividend Coverage                EAT                            Earnings after Tax          Dividend on preference Capital    This ratio helps in indicating ability to pay
                Ratio.             Preference Divivend                                                                                  dividend on preference capital.


      ( c ) Total Coverage        EBIT + Lease payment                 Earnings before interest             Interest+ lease payments    It helps in indicating the ability to meet total
                Ratio           Interest+ lease payments               and tax+ lease payment                +(preference dividend      obligations of the current year, should ideally
                                  +(preference dividend                                                          + installment of       be greater than 1.
                                     + installment of                                                            principal)/(1-t)
                                      principal)/(1-t)


      ( d ) Total cash flow      EBIT+ Lease payments                   EBIT+ Lease payments                lease payment+interest+     Total cash flow i.e. in or out are being indicated
            coverage Ratio      + Depreciation+ non cash               + Depreciation+ non cash         (principal repayment)+(1-t)     with the hepl of this ratio. It hepls in indicating
                                        expenses                               expenses                 + (preference dividend)/(1-t)   cash reserve of firm and its capibility to meet
                                 lease payment+interest+                                                                                daily cash requirements.
                                (principal repayment)+(1-t)
                               + (preference dividend)/(1-t)


8        Profit Margin:-
     (I) Gross profit margin       Gross profits * 100                    Gross profits * 100                        sales              This ratio is a idicator of basic/ gross profitability.
                                           sales               or sales - cost of goods sold
                                            or
                               sales-cost of goods sold*100
                                           sales


     (II) Net profit margin
     ( a ) Operating Profit                EBIT                        Earnings before interest                      sales              This ratio is a indicator of operating performance of
                Ratio                     Sales                                  and tax                                                business.


      ( b ) Net profit Ratio               EAT                            Earnings after Tax                         sales              This ratio is a idicator of overall profitability.
                                          Sales


9    Cost of goods sold          Cost of goods sold * 100      [For Manuacturers:-                                 Net sales            Indicates how fast inventory is used/ sold. High ratio
Ratio:-                        Net sales                          Opening Stock of FG                                            indicates fast moving material while low ratio may
                                                                      (+) Cost of Production                                                   mean dead or excessive stock.
                                                                      (+) Closing Stock of FG
                                                                      For Traders:-
                                                                      Opening Stock of FG
                                                                      (+) purchases
                                                                      (-) Closing Stock of FG]*100


10      Operating Expense          Administrative Expenses +                 Administrative Expenses +                     Net sales           It hepls in indicating business ability to meet its
             Ratio:-                     Selling Expenses                         Selling Expenses                                             total expenses effectively of current year.
                                             Net sales                                                                                         Ideal ratio is greater than 1.


11    Administrative Expense      Administrative Expenses *100              Administrative Expenses *100                   Net sales           It hepls in indicating business ability to meet its
             Ratio:-                         Net sales                                                                                         Administrative activities expenses effectively..
                                                                                                                                               Ideal ratio is greater than 1.


12    Selling Expenses Ratio:-        Selling Expenses*100                      Selling Expenses*100                       Net sales           It hepls in indicating business ability to meet its
                                             Net sales                                                                                         Selling activities expenses effectively..
                                                                                                                                               Ideal ratio is greater than 1.


13       Opearting Ratio:-            Cost of goods sold +            [For Manuacturers:-                                  Net sales           It hepls in indicating business ability to meet its
                                    operating expenses * 100                    Opening Stock of FG                                            Operating activities expenses effectively..
                                             Net sales                (+) Cost of Production                                                   Ideal ratio is greater than 1.
                                                                      (+) Closing Stock of FG
                                                                      For Traders:-
                                                                      Opening Stock of FG
                                                                      (+) purchases
                                                                      (-) Closing Stock of FG] +
                                                                              operating expenses * 100


14   Financial Expenses Ratio:-      Financial Expenses *100                  Financial Expenses *100                      Net sales           It hepls in indicating business ability to meet its
                                             Net sales                                                                                         Financial activities expenses effectively..
                                                                                                                                               Ideal ratio is greater than 1.


15      Return on Assets:-              Net Profit after Tax                   Earnings after Taxation     Average Total Assests or Tangible   It indicates Net income per ruppee of average fixed/
                                      Average Total Assets            (+) Int. on debt funds               Assets or Fixed Assets, i.e.        tangible/ total assests.
                                                                      (+) Non Operating Adjts.             (1/2 of opg + clg bal.)
                                  Net profit after taxes + interest   (e.g. Other income/ loss on
                                      Average total Assests           sale of fixed Assets etc.)


                                  Net profit after taxes + interest
                                    Average Tangible Assets


                                  Net profit after taxes + interest
Average Fixed Assests


                                          EAT+Interest-Tax advantage
                                                   on Interest
                                         Average Total Assets/Tangible
                                              Assets/Fixed Assets.


16   Return on Capital Employed:-             Net Profit After Taxes                     Earnings after Taxation            Capital Employed can be computed       Overall profitability of the business on the total funds
                  .                      Average total capital employed         (+) Int. on debt funds                      using- (a) Assets Route or             employed can be derived easily with the help of this
                                                                                (+) Non Operating Adjts.                          (b) Liability Route.             Ratio,If ROCE > Interest Rate, use of debt fund is
                                         Net Profit After Taxes+Interest        (e.g. Other income/ loss on                                                        justified.
                                           - Tax advantage on interest          sale of fixed Assets etc.)
                                         Average total capital employed


                                         Net Profit After Taxes+Interest
                                                             Average
                                            Total Capital Employed-
                                           Average intangible Assets


17   Return on Total Shareholders             Net Profit After Taxes                     Earnings after Taxation               Average total Shareholders equity   Overall return of the business on the total
               Equity:-                Average total Shareholders equity        (+) Int. on debt funds                                                             shareholders funds employed can be derived easily
                                                                                (+) Non Operating Adjts.                                                           with the help of this Ratio.
                                                                                (e.g. Other income/ loss on
                                                                                sale of fixed Assets etc.)


18    Return on Equity Funds.:-        Net Profit After Taxes - preference               Earnings after Taxation                        Net Fixed Assets           It indicates profitability of equity funds/ owners funds
                                                    dividend                    (+) Int. on debt funds                      (+) Net Working Capital                invested in business.
                                        Average Ordinary Shareholders           (+) Non Operating Adjts.                    (-) External Liablities ( LongTerm)
                                               Equity or net Worth              (e.g. Other income/ loss on
                                                                                sale of fixed Assets etc.)


19   Earnings Per Share ( EPS):-          Net profit available to equity        Residual earnings, i.e.                     No. of equity shares outstanding =     It indicates return or income per share, whether or not
                                                  shareholders                  EAT -preference dividend                                  equity capital           distributed as dividends.
                                    Number of ordinary share outstanidng                                                              face value per share


20    Dividend per share ( DPS):-    Net Profit after interest and preference   Profits Distributed to equity               No. of equity shares outstanding =     This ratio basically states the amount of profits
                                     dividend paid to ordinary shareholders Shareholders                                                  equity capital           distributed per share.
                                    Number of ordinary shares outstanding                                                             face value per share


21     Dividend Pay-out Ratio:-         Total dividend to equity holders         Net Profit after interest and preference         Net profit available to equity   It signifies the relationship between dividend
                                       total net profit belonging to equity      dividend paid to ordinary shareholders                   shareholders             distributed and earnings earned from such dividends.
                                                     holders                    Number of ordinary shares outstanding       Number of ordinary share outstanidng
                                                        or
                                           Dividend per share ( DPS)
Earnings Per Share ( EPS)


22        Earning Yield:-                         EPS                         Net profit available to equity               Market value of share          It indicates true return on equity based on market
                                        Market value of share                          shareholders                                                       value of shares.
                                                                       Number of ordinary share outstanidng


23        Dividend Yield:-                       DPS                    Net Profit after interest and preference           Market value of share          It indicates true return on investment based on
                                        Market value of share           dividend paid to ordinary shareholders                                            market value of shares.
                                                                       Number of ordinary shares outstanding


24     Price Earning Ratio:-            Market price of shares                   Market price of shares                 Net profit available to equity    It indicates the relationship between market price and
                                                  EPS                                                                           shareholders              EPS, and the shareholders perception of the company.
                                                                                                                   Number of ordinary share outstanidng


25        Earning Power:-            Net profit after taxes * sales          Earnings after Taxation* sales                sales   *   total assets       It indicates the total earning power of business in terms
                                   sales                total assets   (+) Int. on debt funds                                                             of sales and fixed assets.
                                                                       (+) Non Operating Adjts.
                                                                       (e.g. Other income/ loss on
                                                                       sale of fixed Assets etc.)


26   Inventory Turnover Ratio:-            Cost of goods sold          [For Manuacturers:-                         Average Inventory =                    Indicates how fast inventory is used/ sold. High T/O ratio
                                           Average Inventory                     Opening Stock of FG                     1/2 ( opg. Bal. + clg. Bal)      indicates fast moving material while low ratio may mean
                                                                       (+) Cost of Production                                                             daed or excessive stock.
                                                                       (+) Closing Stock of FG
                                                                       For Traders:-
                                                                       Opening Stock of FG
                                                                       (+) purchases
                                                                       (-) Closing Stock of FG]


27    Raw Material Turnover:-         cost of raw materials used           Openeing Stock of Raw Material                1/2 ( opg. Bal. + clg. Bal)      Indicates how fast/ regularly Raw materials are used in
                                   Average Raw Material inventory      (+) Purchases                                                                      production
                                                                       (-) Closing Stock of Raw material.


28     Work - in - progress:-        cost of goods manufactured                    Materials consumed                    1/2 ( opg. Bal. + clg. Bal)      It indicates the work - in - progress movements /
                                  Average work in progress inventory   (+) Wages                                                                          production cycle.
                                                                       (+) production overhead


29      Debtors Turnover:-                    Credit sales             credit sales net of returns                       1/2 ( opg. Bal. + clg. Bal)      Indicates the speed of collection of credit sales / debtors.
                                   Average Debtors + Average B/R
                                                  OR
                                              Total Sales
                                             Debtors + B/R
30      Average Collection Period        Months (days) in a year            Months (days) in a year            Credit sales           It states the avearge collection period of dedtors.
                                           Debtors Turnover                                           Average Debtors + Average B/R
                                                                                                                    OR
                                                                                                                Total Sales
                                                                                                              Debtors + B/R


31      Total assests Turn over:-          Cost of goods sold      [For Manuacturers:-                  1/2 ( opg. Bal. + clg. Bal)   Ability to generate sales per ruppee of total assets
                                          Average total assests              Opening Stock of FG
                                                                   (+) Cost of Production
                                                                   (+) Closing Stock of FG
                                                                   For Traders:-
                                                                   Opening Stock of FG
                                                                   (+) purchases
                                                                   (-) Closing Stock of FG]


32       Fixed Assets Turnover:-           Cost of goods sold      [For Manuacturers:-                  1/2 ( opg. Bal. + clg. Bal)   Ability to generate sales per ruppee of fixed assets
                                         Average fixed assests               Opening Stock of FG
                                                                   (+) Cost of Production
                                                                   (+) Closing Stock of FG
                                                                   For Traders:-
                                                                   Opening Stock of FG
                                                                   (+) purchases
                                                                   (-) Closing Stock of FG]


33          Capital Turnover:-             Cost of goods sold      [For Manuacturers:-                  1/2 ( opg. Bal. + clg. Bal)   Ability to generate sales per quantity of capital
                                        Average capital employed             Opening Stock of FG                                      employed.
                                                                   (+) Cost of Production
                                                                   (+) Closing Stock of FG
                                                                   For Traders:-
                                                                   Opening Stock of FG
                                                                   (+) purchases
                                                                   (-) Closing Stock of FG]


34      Current Assets Turnover:-          Cost of goods sold      [For Manuacturers:-                  1/2 ( opg. Bal. + clg. Bal)   Ability to generate sales per ruppee of current assets
                                        Average current assests              Opening Stock of FG
                                                                   (+) Cost of Production
                                                                   (+) Closing Stock of FG
                                                                   For Traders:-
                                                                   Opening Stock of FG
                                                                   (+) purchases
                                                                   (-) Closing Stock of FG]


35   Working Capital Turnover Ratio:-      Cost of goods sold      [For Manuacturers:-                  1/2 ( opg. Bal. + clg. Bal)   Ability to generate sales based on working capital
Net Working Capital              Opening Stock of FG   employment.
                                                  (+) Cost of Production
                                                  (+) Closing Stock of FG
                                                  For Traders:-
                                                  Opening Stock of FG
                                                  (+) purchases
                                                  (-) Closing Stock of FG]


DRAFTED BY:   VIJAY KUMAR POPAT
ROLL NO:      54.
SECTION:      SA - 1

Más contenido relacionado

La actualidad más candente

Sources of finance part 2
Sources of finance part 2Sources of finance part 2
Sources of finance part 2Ajit Dahal
 
Short Term Financing FIN101
Short Term Financing FIN101Short Term Financing FIN101
Short Term Financing FIN101Farhan Alvee
 
Chapter11 borrowingcosts2008
Chapter11  borrowingcosts2008Chapter11  borrowingcosts2008
Chapter11 borrowingcosts2008Sajid Ali
 
DSP Blackrock MIP Fund - June 2012
DSP Blackrock MIP Fund - June 2012DSP Blackrock MIP Fund - June 2012
DSP Blackrock MIP Fund - June 2012Omkumar Pagarani
 
A STUDY ON FIXED INCOME SECURITIES AND THEIR AWARENESS AMONG INDIAN INVESTORS
A STUDY ON FIXED INCOME SECURITIES AND THEIR AWARENESS AMONG INDIAN INVESTORSA STUDY ON FIXED INCOME SECURITIES AND THEIR AWARENESS AMONG INDIAN INVESTORS
A STUDY ON FIXED INCOME SECURITIES AND THEIR AWARENESS AMONG INDIAN INVESTORSSourav Lodha
 
short term financing
 short term financing short term financing
short term financingAditya Singh
 
Market startegis and microstructure 8
Market startegis and  microstructure 8Market startegis and  microstructure 8
Market startegis and microstructure 8Rika Hernawati
 
DSP BlackRock MIP Fund - April 2012
DSP BlackRock MIP Fund - April 2012DSP BlackRock MIP Fund - April 2012
DSP BlackRock MIP Fund - April 2012Omkumar Pagarani
 
50023871 a-project-report-on-credit-default-swaps
50023871 a-project-report-on-credit-default-swaps50023871 a-project-report-on-credit-default-swaps
50023871 a-project-report-on-credit-default-swapsrathore636636
 
sources of short term finance.
sources of short  term finance.sources of short  term finance.
sources of short term finance.Sunil Thakur
 
Bond valuation presentation unit 4
Bond valuation presentation unit 4Bond valuation presentation unit 4
Bond valuation presentation unit 4Aikins Osei
 
Alternative Strategies - Cablevision
Alternative Strategies - CablevisionAlternative Strategies - Cablevision
Alternative Strategies - CablevisionRYAN RENICKER
 
Goldman Sachs’ Interview Tips New
Goldman Sachs’ Interview Tips NewGoldman Sachs’ Interview Tips New
Goldman Sachs’ Interview Tips NewAugustin Bangalore
 

La actualidad más candente (19)

Sources of finance part 2
Sources of finance part 2Sources of finance part 2
Sources of finance part 2
 
6. bond valuation
6. bond valuation6. bond valuation
6. bond valuation
 
08 ratio
08 ratio08 ratio
08 ratio
 
short term financing
short term financingshort term financing
short term financing
 
Short Term Financing FIN101
Short Term Financing FIN101Short Term Financing FIN101
Short Term Financing FIN101
 
Chapter11 borrowingcosts2008
Chapter11  borrowingcosts2008Chapter11  borrowingcosts2008
Chapter11 borrowingcosts2008
 
DSP Blackrock MIP Fund - June 2012
DSP Blackrock MIP Fund - June 2012DSP Blackrock MIP Fund - June 2012
DSP Blackrock MIP Fund - June 2012
 
A STUDY ON FIXED INCOME SECURITIES AND THEIR AWARENESS AMONG INDIAN INVESTORS
A STUDY ON FIXED INCOME SECURITIES AND THEIR AWARENESS AMONG INDIAN INVESTORSA STUDY ON FIXED INCOME SECURITIES AND THEIR AWARENESS AMONG INDIAN INVESTORS
A STUDY ON FIXED INCOME SECURITIES AND THEIR AWARENESS AMONG INDIAN INVESTORS
 
short term financing
 short term financing short term financing
short term financing
 
Market startegis and microstructure 8
Market startegis and  microstructure 8Market startegis and  microstructure 8
Market startegis and microstructure 8
 
DSP BlackRock MIP Fund - April 2012
DSP BlackRock MIP Fund - April 2012DSP BlackRock MIP Fund - April 2012
DSP BlackRock MIP Fund - April 2012
 
50023871 a-project-report-on-credit-default-swaps
50023871 a-project-report-on-credit-default-swaps50023871 a-project-report-on-credit-default-swaps
50023871 a-project-report-on-credit-default-swaps
 
sources of short term finance.
sources of short  term finance.sources of short  term finance.
sources of short term finance.
 
L
LL
L
 
Bond valuation presentation unit 4
Bond valuation presentation unit 4Bond valuation presentation unit 4
Bond valuation presentation unit 4
 
Bonds ppt
Bonds pptBonds ppt
Bonds ppt
 
Alternative Strategies - Cablevision
Alternative Strategies - CablevisionAlternative Strategies - Cablevision
Alternative Strategies - Cablevision
 
Bond markets
Bond marketsBond markets
Bond markets
 
Goldman Sachs’ Interview Tips New
Goldman Sachs’ Interview Tips NewGoldman Sachs’ Interview Tips New
Goldman Sachs’ Interview Tips New
 

Destacado

Accounts Receivable Turnover Ratio
Accounts Receivable Turnover RatioAccounts Receivable Turnover Ratio
Accounts Receivable Turnover Ratiotimmypaulson
 
Ppt bab 11 neraca saldo setelah penyesuaian
Ppt bab 11 neraca saldo setelah penyesuaianPpt bab 11 neraca saldo setelah penyesuaian
Ppt bab 11 neraca saldo setelah penyesuaianIndah Rohmatullah
 
Ratio analysis theory-prime
Ratio analysis  theory-primeRatio analysis  theory-prime
Ratio analysis theory-primeSahil Shaikh
 
Account receivable manager
Account receivable managerAccount receivable manager
Account receivable managerhughjackman261
 
Receivables
ReceivablesReceivables
Receivablesmscuttle
 
Factors that influence Perception
Factors that influence PerceptionFactors that influence Perception
Factors that influence PerceptionTrisha Lane Atienza
 
8 Critical Sales Competencies and How to Improve Them
8 Critical Sales Competencies and How to Improve Them8 Critical Sales Competencies and How to Improve Them
8 Critical Sales Competencies and How to Improve ThemBarry Rosen
 
Types of Ratio analyis and their significance
Types of Ratio analyis and their significanceTypes of Ratio analyis and their significance
Types of Ratio analyis and their significanceFred Mmbololo
 
Sales Competency Assessment Marketing ppt.
Sales Competency Assessment Marketing ppt.Sales Competency Assessment Marketing ppt.
Sales Competency Assessment Marketing ppt.PERSONA GLOBAL ESPAÑA
 
Sales Competency Frameworks
Sales Competency FrameworksSales Competency Frameworks
Sales Competency Frameworkssemmy831
 
Chapter 9-ratio-analysis121
Chapter 9-ratio-analysis121Chapter 9-ratio-analysis121
Chapter 9-ratio-analysis121Anjaneyulu Bandi
 
Sales Competencies Overview
Sales Competencies OverviewSales Competencies Overview
Sales Competencies OverviewMark Blessington
 
Account receivable presentation
Account receivable presentationAccount receivable presentation
Account receivable presentationckeebakhattak
 
Income From Salary Problems,Theory And Solutions New 2008 09 Assessment Year
Income From Salary Problems,Theory And Solutions New 2008 09 Assessment YearIncome From Salary Problems,Theory And Solutions New 2008 09 Assessment Year
Income From Salary Problems,Theory And Solutions New 2008 09 Assessment YearAugustin Bangalore
 

Destacado (16)

Accounts Receivable Turnover Ratio
Accounts Receivable Turnover RatioAccounts Receivable Turnover Ratio
Accounts Receivable Turnover Ratio
 
Ppt bab 11 neraca saldo setelah penyesuaian
Ppt bab 11 neraca saldo setelah penyesuaianPpt bab 11 neraca saldo setelah penyesuaian
Ppt bab 11 neraca saldo setelah penyesuaian
 
Ratio analysis theory-prime
Ratio analysis  theory-primeRatio analysis  theory-prime
Ratio analysis theory-prime
 
Account receivable manager
Account receivable managerAccount receivable manager
Account receivable manager
 
Receivables
ReceivablesReceivables
Receivables
 
Factors that influence Perception
Factors that influence PerceptionFactors that influence Perception
Factors that influence Perception
 
8 Critical Sales Competencies and How to Improve Them
8 Critical Sales Competencies and How to Improve Them8 Critical Sales Competencies and How to Improve Them
8 Critical Sales Competencies and How to Improve Them
 
Summary of Ratio Analyses
Summary of Ratio AnalysesSummary of Ratio Analyses
Summary of Ratio Analyses
 
Types of Ratio analyis and their significance
Types of Ratio analyis and their significanceTypes of Ratio analyis and their significance
Types of Ratio analyis and their significance
 
Sales Competency Assessment Marketing ppt.
Sales Competency Assessment Marketing ppt.Sales Competency Assessment Marketing ppt.
Sales Competency Assessment Marketing ppt.
 
Sales Competency Frameworks
Sales Competency FrameworksSales Competency Frameworks
Sales Competency Frameworks
 
Chapter 9-ratio-analysis121
Chapter 9-ratio-analysis121Chapter 9-ratio-analysis121
Chapter 9-ratio-analysis121
 
Sales Competencies Overview
Sales Competencies OverviewSales Competencies Overview
Sales Competencies Overview
 
Account receivable presentation
Account receivable presentationAccount receivable presentation
Account receivable presentation
 
Accounts receivable
Accounts receivableAccounts receivable
Accounts receivable
 
Income From Salary Problems,Theory And Solutions New 2008 09 Assessment Year
Income From Salary Problems,Theory And Solutions New 2008 09 Assessment YearIncome From Salary Problems,Theory And Solutions New 2008 09 Assessment Year
Income From Salary Problems,Theory And Solutions New 2008 09 Assessment Year
 

Similar a Ratio Analysis

2871f ratio analysis
2871f ratio analysis2871f ratio analysis
2871f ratio analysisahsanjawadca
 
Helpsheet
HelpsheetHelpsheet
Helpsheettanyx
 
Working Capital Management by Raghav Malhotra
Working  Capital  Management  by Raghav MalhotraWorking  Capital  Management  by Raghav Malhotra
Working Capital Management by Raghav MalhotraRaghav Malhotra
 
Financial Management
Financial ManagementFinancial Management
Financial ManagementCHS SHS
 
nef macro model - ISEE - Rio 2012
nef macro model - ISEE - Rio 2012nef macro model - ISEE - Rio 2012
nef macro model - ISEE - Rio 2012emacampiglio
 
financial_statement analysis
financial_statement analysisfinancial_statement analysis
financial_statement analysisSudhanshu Sharma
 
Financial statementanalysis
Financial statementanalysisFinancial statementanalysis
Financial statementanalysisPratik Jain
 
Chap011 jpm-f2011
Chap011 jpm-f2011Chap011 jpm-f2011
Chap011 jpm-f2011zholzapfel
 
Financial ratio-tutorial2540
Financial ratio-tutorial2540Financial ratio-tutorial2540
Financial ratio-tutorial2540Laxman Ramu
 
Financial ratio-tutorial2540
Financial ratio-tutorial2540Financial ratio-tutorial2540
Financial ratio-tutorial2540Laxman Ramu
 
Emte 111212 thematic outline_cln01
Emte 111212 thematic outline_cln01Emte 111212 thematic outline_cln01
Emte 111212 thematic outline_cln01asternl
 
Pcf week 16 working capital management
Pcf week 16 working capital managementPcf week 16 working capital management
Pcf week 16 working capital managementFCGNUK
 
Ratio for accounting and costing
Ratio for accounting and costingRatio for accounting and costing
Ratio for accounting and costingSyikin Sirun
 
Warren sw06 accounting.21
Warren sw06 accounting.21Warren sw06 accounting.21
Warren sw06 accounting.21Niki Tabuty
 
Chapter 4 double entry recording process
Chapter 4 double entry recording processChapter 4 double entry recording process
Chapter 4 double entry recording processLyLy Tran
 

Similar a Ratio Analysis (20)

2871f ratio analysis
2871f ratio analysis2871f ratio analysis
2871f ratio analysis
 
Ratio analysis
Ratio analysisRatio analysis
Ratio analysis
 
Helpsheet
HelpsheetHelpsheet
Helpsheet
 
Financial ratio
Financial ratioFinancial ratio
Financial ratio
 
Working Capital Management by Raghav Malhotra
Working  Capital  Management  by Raghav MalhotraWorking  Capital  Management  by Raghav Malhotra
Working Capital Management by Raghav Malhotra
 
Financial Management
Financial ManagementFinancial Management
Financial Management
 
nef macro model - ISEE - Rio 2012
nef macro model - ISEE - Rio 2012nef macro model - ISEE - Rio 2012
nef macro model - ISEE - Rio 2012
 
Chapter 4
Chapter 4Chapter 4
Chapter 4
 
financial_statement analysis
financial_statement analysisfinancial_statement analysis
financial_statement analysis
 
Financial statementanalysis
Financial statementanalysisFinancial statementanalysis
Financial statementanalysis
 
Working Capital Management
Working Capital ManagementWorking Capital Management
Working Capital Management
 
Chap011 jpm-f2011
Chap011 jpm-f2011Chap011 jpm-f2011
Chap011 jpm-f2011
 
Financial ratio-tutorial2540
Financial ratio-tutorial2540Financial ratio-tutorial2540
Financial ratio-tutorial2540
 
Financial ratio-tutorial2540
Financial ratio-tutorial2540Financial ratio-tutorial2540
Financial ratio-tutorial2540
 
Emte 111212 thematic outline_cln01
Emte 111212 thematic outline_cln01Emte 111212 thematic outline_cln01
Emte 111212 thematic outline_cln01
 
Working capital
Working capitalWorking capital
Working capital
 
Pcf week 16 working capital management
Pcf week 16 working capital managementPcf week 16 working capital management
Pcf week 16 working capital management
 
Ratio for accounting and costing
Ratio for accounting and costingRatio for accounting and costing
Ratio for accounting and costing
 
Warren sw06 accounting.21
Warren sw06 accounting.21Warren sw06 accounting.21
Warren sw06 accounting.21
 
Chapter 4 double entry recording process
Chapter 4 double entry recording processChapter 4 double entry recording process
Chapter 4 double entry recording process
 

Más de vijay popat

Technical Analysis
Technical AnalysisTechnical Analysis
Technical Analysisvijay popat
 
Budget Sector Wise Analysis Benchmarkers
Budget Sector Wise Analysis BenchmarkersBudget Sector Wise Analysis Benchmarkers
Budget Sector Wise Analysis Benchmarkersvijay popat
 
Claims Final (2)
Claims Final (2)Claims Final (2)
Claims Final (2)vijay popat
 
Retailindustryanalysis 091210114006 Phpapp01
Retailindustryanalysis 091210114006 Phpapp01Retailindustryanalysis 091210114006 Phpapp01
Retailindustryanalysis 091210114006 Phpapp01vijay popat
 
Shree Hazarilal Cold Storage Private
Shree Hazarilal Cold Storage PrivateShree Hazarilal Cold Storage Private
Shree Hazarilal Cold Storage Privatevijay popat
 
Hsbc Corporate Banking
Hsbc Corporate BankingHsbc Corporate Banking
Hsbc Corporate Bankingvijay popat
 
Kindness Vijaypopat Pps
Kindness Vijaypopat PpsKindness Vijaypopat Pps
Kindness Vijaypopat Ppsvijay popat
 
Kindness Vijaypopat.Pps
Kindness Vijaypopat.PpsKindness Vijaypopat.Pps
Kindness Vijaypopat.Ppsvijay popat
 

Más de vijay popat (14)

Technical Analysis
Technical AnalysisTechnical Analysis
Technical Analysis
 
Budget Sector Wise Analysis Benchmarkers
Budget Sector Wise Analysis BenchmarkersBudget Sector Wise Analysis Benchmarkers
Budget Sector Wise Analysis Benchmarkers
 
Claims Final (2)
Claims Final (2)Claims Final (2)
Claims Final (2)
 
Budgetebook
BudgetebookBudgetebook
Budgetebook
 
Max Sip
Max SipMax Sip
Max Sip
 
Cesc
CescCesc
Cesc
 
Retailindustryanalysis 091210114006 Phpapp01
Retailindustryanalysis 091210114006 Phpapp01Retailindustryanalysis 091210114006 Phpapp01
Retailindustryanalysis 091210114006 Phpapp01
 
Baja Auto
Baja AutoBaja Auto
Baja Auto
 
Nirma
NirmaNirma
Nirma
 
Nep
NepNep
Nep
 
Shree Hazarilal Cold Storage Private
Shree Hazarilal Cold Storage PrivateShree Hazarilal Cold Storage Private
Shree Hazarilal Cold Storage Private
 
Hsbc Corporate Banking
Hsbc Corporate BankingHsbc Corporate Banking
Hsbc Corporate Banking
 
Kindness Vijaypopat Pps
Kindness Vijaypopat PpsKindness Vijaypopat Pps
Kindness Vijaypopat Pps
 
Kindness Vijaypopat.Pps
Kindness Vijaypopat.PpsKindness Vijaypopat.Pps
Kindness Vijaypopat.Pps
 

Último

Q3 2024 Earnings Conference Call and Webcast Slides
Q3 2024 Earnings Conference Call and Webcast SlidesQ3 2024 Earnings Conference Call and Webcast Slides
Q3 2024 Earnings Conference Call and Webcast SlidesMarketing847413
 
Dividend Policy and Dividend Decision Theories.pptx
Dividend Policy and Dividend Decision Theories.pptxDividend Policy and Dividend Decision Theories.pptx
Dividend Policy and Dividend Decision Theories.pptxanshikagoel52
 
Instant Issue Debit Cards - High School Spirit
Instant Issue Debit Cards - High School SpiritInstant Issue Debit Cards - High School Spirit
Instant Issue Debit Cards - High School Spiritegoetzinger
 
Dharavi Russian callg Girls, { 09892124323 } || Call Girl In Mumbai ...
Dharavi Russian callg Girls, { 09892124323 } || Call Girl In Mumbai ...Dharavi Russian callg Girls, { 09892124323 } || Call Girl In Mumbai ...
Dharavi Russian callg Girls, { 09892124323 } || Call Girl In Mumbai ...Pooja Nehwal
 
TEST BANK For Corporate Finance, 13th Edition By Stephen Ross, Randolph Weste...
TEST BANK For Corporate Finance, 13th Edition By Stephen Ross, Randolph Weste...TEST BANK For Corporate Finance, 13th Edition By Stephen Ross, Randolph Weste...
TEST BANK For Corporate Finance, 13th Edition By Stephen Ross, Randolph Weste...ssifa0344
 
Quarter 4- Module 3 Principles of Marketing
Quarter 4- Module 3 Principles of MarketingQuarter 4- Module 3 Principles of Marketing
Quarter 4- Module 3 Principles of MarketingMaristelaRamos12
 
The Economic History of the U.S. Lecture 17.pdf
The Economic History of the U.S. Lecture 17.pdfThe Economic History of the U.S. Lecture 17.pdf
The Economic History of the U.S. Lecture 17.pdfGale Pooley
 
High Class Call Girls Nashik Maya 7001305949 Independent Escort Service Nashik
High Class Call Girls Nashik Maya 7001305949 Independent Escort Service NashikHigh Class Call Girls Nashik Maya 7001305949 Independent Escort Service Nashik
High Class Call Girls Nashik Maya 7001305949 Independent Escort Service NashikCall Girls in Nagpur High Profile
 
Call Girls Service Nagpur Maya Call 7001035870 Meet With Nagpur Escorts
Call Girls Service Nagpur Maya Call 7001035870 Meet With Nagpur EscortsCall Girls Service Nagpur Maya Call 7001035870 Meet With Nagpur Escorts
Call Girls Service Nagpur Maya Call 7001035870 Meet With Nagpur Escortsranjana rawat
 
Best VIP Call Girls Noida Sector 18 Call Me: 8448380779
Best VIP Call Girls Noida Sector 18 Call Me: 8448380779Best VIP Call Girls Noida Sector 18 Call Me: 8448380779
Best VIP Call Girls Noida Sector 18 Call Me: 8448380779Delhi Call girls
 
How Automation is Driving Efficiency Through the Last Mile of Reporting
How Automation is Driving Efficiency Through the Last Mile of ReportingHow Automation is Driving Efficiency Through the Last Mile of Reporting
How Automation is Driving Efficiency Through the Last Mile of ReportingAggregage
 
Lundin Gold April 2024 Corporate Presentation v4.pdf
Lundin Gold April 2024 Corporate Presentation v4.pdfLundin Gold April 2024 Corporate Presentation v4.pdf
Lundin Gold April 2024 Corporate Presentation v4.pdfAdnet Communications
 
The Economic History of the U.S. Lecture 30.pdf
The Economic History of the U.S. Lecture 30.pdfThe Economic History of the U.S. Lecture 30.pdf
The Economic History of the U.S. Lecture 30.pdfGale Pooley
 
Monthly Market Risk Update: April 2024 [SlideShare]
Monthly Market Risk Update: April 2024 [SlideShare]Monthly Market Risk Update: April 2024 [SlideShare]
Monthly Market Risk Update: April 2024 [SlideShare]Commonwealth
 
The Economic History of the U.S. Lecture 18.pdf
The Economic History of the U.S. Lecture 18.pdfThe Economic History of the U.S. Lecture 18.pdf
The Economic History of the U.S. Lecture 18.pdfGale Pooley
 
VIP Kolkata Call Girl Jodhpur Park 👉 8250192130 Available With Room
VIP Kolkata Call Girl Jodhpur Park 👉 8250192130  Available With RoomVIP Kolkata Call Girl Jodhpur Park 👉 8250192130  Available With Room
VIP Kolkata Call Girl Jodhpur Park 👉 8250192130 Available With Roomdivyansh0kumar0
 
The Economic History of the U.S. Lecture 22.pdf
The Economic History of the U.S. Lecture 22.pdfThe Economic History of the U.S. Lecture 22.pdf
The Economic History of the U.S. Lecture 22.pdfGale Pooley
 
00_Main ppt_MeetupDORA&CyberSecurity.pptx
00_Main ppt_MeetupDORA&CyberSecurity.pptx00_Main ppt_MeetupDORA&CyberSecurity.pptx
00_Main ppt_MeetupDORA&CyberSecurity.pptxFinTech Belgium
 
Independent Lucknow Call Girls 8923113531WhatsApp Lucknow Call Girls make you...
Independent Lucknow Call Girls 8923113531WhatsApp Lucknow Call Girls make you...Independent Lucknow Call Girls 8923113531WhatsApp Lucknow Call Girls make you...
Independent Lucknow Call Girls 8923113531WhatsApp Lucknow Call Girls make you...makika9823
 
06_Joeri Van Speybroek_Dell_MeetupDora&Cybersecurity.pdf
06_Joeri Van Speybroek_Dell_MeetupDora&Cybersecurity.pdf06_Joeri Van Speybroek_Dell_MeetupDora&Cybersecurity.pdf
06_Joeri Van Speybroek_Dell_MeetupDora&Cybersecurity.pdfFinTech Belgium
 

Último (20)

Q3 2024 Earnings Conference Call and Webcast Slides
Q3 2024 Earnings Conference Call and Webcast SlidesQ3 2024 Earnings Conference Call and Webcast Slides
Q3 2024 Earnings Conference Call and Webcast Slides
 
Dividend Policy and Dividend Decision Theories.pptx
Dividend Policy and Dividend Decision Theories.pptxDividend Policy and Dividend Decision Theories.pptx
Dividend Policy and Dividend Decision Theories.pptx
 
Instant Issue Debit Cards - High School Spirit
Instant Issue Debit Cards - High School SpiritInstant Issue Debit Cards - High School Spirit
Instant Issue Debit Cards - High School Spirit
 
Dharavi Russian callg Girls, { 09892124323 } || Call Girl In Mumbai ...
Dharavi Russian callg Girls, { 09892124323 } || Call Girl In Mumbai ...Dharavi Russian callg Girls, { 09892124323 } || Call Girl In Mumbai ...
Dharavi Russian callg Girls, { 09892124323 } || Call Girl In Mumbai ...
 
TEST BANK For Corporate Finance, 13th Edition By Stephen Ross, Randolph Weste...
TEST BANK For Corporate Finance, 13th Edition By Stephen Ross, Randolph Weste...TEST BANK For Corporate Finance, 13th Edition By Stephen Ross, Randolph Weste...
TEST BANK For Corporate Finance, 13th Edition By Stephen Ross, Randolph Weste...
 
Quarter 4- Module 3 Principles of Marketing
Quarter 4- Module 3 Principles of MarketingQuarter 4- Module 3 Principles of Marketing
Quarter 4- Module 3 Principles of Marketing
 
The Economic History of the U.S. Lecture 17.pdf
The Economic History of the U.S. Lecture 17.pdfThe Economic History of the U.S. Lecture 17.pdf
The Economic History of the U.S. Lecture 17.pdf
 
High Class Call Girls Nashik Maya 7001305949 Independent Escort Service Nashik
High Class Call Girls Nashik Maya 7001305949 Independent Escort Service NashikHigh Class Call Girls Nashik Maya 7001305949 Independent Escort Service Nashik
High Class Call Girls Nashik Maya 7001305949 Independent Escort Service Nashik
 
Call Girls Service Nagpur Maya Call 7001035870 Meet With Nagpur Escorts
Call Girls Service Nagpur Maya Call 7001035870 Meet With Nagpur EscortsCall Girls Service Nagpur Maya Call 7001035870 Meet With Nagpur Escorts
Call Girls Service Nagpur Maya Call 7001035870 Meet With Nagpur Escorts
 
Best VIP Call Girls Noida Sector 18 Call Me: 8448380779
Best VIP Call Girls Noida Sector 18 Call Me: 8448380779Best VIP Call Girls Noida Sector 18 Call Me: 8448380779
Best VIP Call Girls Noida Sector 18 Call Me: 8448380779
 
How Automation is Driving Efficiency Through the Last Mile of Reporting
How Automation is Driving Efficiency Through the Last Mile of ReportingHow Automation is Driving Efficiency Through the Last Mile of Reporting
How Automation is Driving Efficiency Through the Last Mile of Reporting
 
Lundin Gold April 2024 Corporate Presentation v4.pdf
Lundin Gold April 2024 Corporate Presentation v4.pdfLundin Gold April 2024 Corporate Presentation v4.pdf
Lundin Gold April 2024 Corporate Presentation v4.pdf
 
The Economic History of the U.S. Lecture 30.pdf
The Economic History of the U.S. Lecture 30.pdfThe Economic History of the U.S. Lecture 30.pdf
The Economic History of the U.S. Lecture 30.pdf
 
Monthly Market Risk Update: April 2024 [SlideShare]
Monthly Market Risk Update: April 2024 [SlideShare]Monthly Market Risk Update: April 2024 [SlideShare]
Monthly Market Risk Update: April 2024 [SlideShare]
 
The Economic History of the U.S. Lecture 18.pdf
The Economic History of the U.S. Lecture 18.pdfThe Economic History of the U.S. Lecture 18.pdf
The Economic History of the U.S. Lecture 18.pdf
 
VIP Kolkata Call Girl Jodhpur Park 👉 8250192130 Available With Room
VIP Kolkata Call Girl Jodhpur Park 👉 8250192130  Available With RoomVIP Kolkata Call Girl Jodhpur Park 👉 8250192130  Available With Room
VIP Kolkata Call Girl Jodhpur Park 👉 8250192130 Available With Room
 
The Economic History of the U.S. Lecture 22.pdf
The Economic History of the U.S. Lecture 22.pdfThe Economic History of the U.S. Lecture 22.pdf
The Economic History of the U.S. Lecture 22.pdf
 
00_Main ppt_MeetupDORA&CyberSecurity.pptx
00_Main ppt_MeetupDORA&CyberSecurity.pptx00_Main ppt_MeetupDORA&CyberSecurity.pptx
00_Main ppt_MeetupDORA&CyberSecurity.pptx
 
Independent Lucknow Call Girls 8923113531WhatsApp Lucknow Call Girls make you...
Independent Lucknow Call Girls 8923113531WhatsApp Lucknow Call Girls make you...Independent Lucknow Call Girls 8923113531WhatsApp Lucknow Call Girls make you...
Independent Lucknow Call Girls 8923113531WhatsApp Lucknow Call Girls make you...
 
06_Joeri Van Speybroek_Dell_MeetupDora&Cybersecurity.pdf
06_Joeri Van Speybroek_Dell_MeetupDora&Cybersecurity.pdf06_Joeri Van Speybroek_Dell_MeetupDora&Cybersecurity.pdf
06_Joeri Van Speybroek_Dell_MeetupDora&Cybersecurity.pdf
 

Ratio Analysis

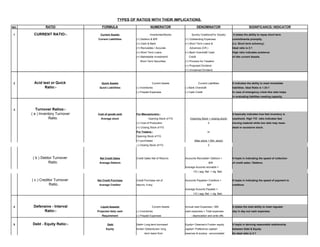
  • 1. TYPES OF RATIOS WITH THEIR IMPLICATIONS. NO. RATIO FORMULA NUMERATOR DENOMINATOR SIGNIFICANCE/ INDICATOR 1 CURRENT RATIO:- Current Assets Inventories/Stocks Sundry Creditors(For Goods) It states the ability to repay short term Current Liablilities (+) Debtors & B/R (+) Outstanding Expenses commitments promptly. (+) Cash & Bank (+) Short Term Loans & (i.e. Short term solvency). (+) Recivables / Accurals Advances (CR.) Ideal ratio is 2:1 (+) Short Term Loans (+) Bank Overdraft/ Cash High ratio indicates existence (+) Marketable Investment/ Credit of idle current Assets. Short Term Securities. (+) Provison for Taxation (+) Proposed Dividend (+) Unclaimed Dividend 2 Acid test or Quick Quick Assets Current Assets Current Liablilities It indicates the ability to meet immediate Ratio:- Quick Liablilities (-) Inventories (-) Bank Overdraft liabilities. Ideal Ratio is 1.33:1 (-) Prepaid Expenses (-) Cash Credit In case of emergency crisis this ratio helps in evaluating liablities meeting capacity. 3 Turnover Ratios:- ( a ) Inventory Turnover Cost of goods sold For Manuacturers:- It basically indicates how fast inventory is Ratio. Average stock Opening Stock of FG (Opening Stock + closing stock) used/sold. High T/O ratio indicates fast (+) Cost of Production 2 moving material while low ratio may mean (+) Closing Stock of FG dead or excessive stock. For Traders:- or Opening Stock of FG (+) purchases (Max stock + Min. stock) (-) Closing Stock of FG 2 ( b ) Debtor Turnover Net Credit Sales Credit Sales Net of Returns Accounts Recivable= Debtors + It hepls in indicating the speed of collection Ratio. Average Debtors B/R of credit sales / Debtors. Average Acounts recivable = 1/2 ( opg. Bal. + clg. Bal) ( c ) Creditor Turnover Net Credit Purchase Credit Purchase net of Accounts Payable= Creditors + It hepls in indicating the speed of payment to Ratio. Average Creditor returns, if any. B/P creditors. Average Acounts Payable = 1/2 ( opg. Bal. + clg. Bal) 4 Defensive - Interval Liquid Assests Current Assets Annual cash Expenses / 365 It states the total ability to meet regualar Ratio:- Projected daily cash (-) Inventories cash expenses = Total expenses day in day out cash expenses. Requirement (-) Prepaid Expenses - depreciation and write offs. 5 Debt - Equity Ratio:- Debt Debt= Long term borrowed Equity= Owerner's Funds= equity It hepls in deriving reasonable relationship Equity funds= Debentures+ long capital+ Preference capital+ between Debt & Equity. term loans from reserves & surplus - accumulated Its ideal ratio is 2:1
  • 2. fianancial Institutions. losses. 6 Debt to capital ratio:- Debt Debt= Long term borrowed Fixed Assests + net working Its basically a indicator of use of external Total funds funds= Debentures+ long capital funds and total capital employed in total. term loans from ideal ratio = 67% fianancial Institutions. 7 Coverage Ratios: ( a ) Interest Coverage EBIT Earnings before interest Interest on Debt It hepls in indicating interest obligations. It Ratio. Interest and tax states the ability to meet interest obligations of the current year.should ideally be greater than 1. ( b ) Dividend Coverage EAT Earnings after Tax Dividend on preference Capital This ratio helps in indicating ability to pay Ratio. Preference Divivend dividend on preference capital. ( c ) Total Coverage EBIT + Lease payment Earnings before interest Interest+ lease payments It helps in indicating the ability to meet total Ratio Interest+ lease payments and tax+ lease payment +(preference dividend obligations of the current year, should ideally +(preference dividend + installment of be greater than 1. + installment of principal)/(1-t) principal)/(1-t) ( d ) Total cash flow EBIT+ Lease payments EBIT+ Lease payments lease payment+interest+ Total cash flow i.e. in or out are being indicated coverage Ratio + Depreciation+ non cash + Depreciation+ non cash (principal repayment)+(1-t) with the hepl of this ratio. It hepls in indicating expenses expenses + (preference dividend)/(1-t) cash reserve of firm and its capibility to meet lease payment+interest+ daily cash requirements. (principal repayment)+(1-t) + (preference dividend)/(1-t) 8 Profit Margin:- (I) Gross profit margin Gross profits * 100 Gross profits * 100 sales This ratio is a idicator of basic/ gross profitability. sales or sales - cost of goods sold or sales-cost of goods sold*100 sales (II) Net profit margin ( a ) Operating Profit EBIT Earnings before interest sales This ratio is a indicator of operating performance of Ratio Sales and tax business. ( b ) Net profit Ratio EAT Earnings after Tax sales This ratio is a idicator of overall profitability. Sales 9 Cost of goods sold Cost of goods sold * 100 [For Manuacturers:- Net sales Indicates how fast inventory is used/ sold. High ratio
  • 3. Ratio:- Net sales Opening Stock of FG indicates fast moving material while low ratio may (+) Cost of Production mean dead or excessive stock. (+) Closing Stock of FG For Traders:- Opening Stock of FG (+) purchases (-) Closing Stock of FG]*100 10 Operating Expense Administrative Expenses + Administrative Expenses + Net sales It hepls in indicating business ability to meet its Ratio:- Selling Expenses Selling Expenses total expenses effectively of current year. Net sales Ideal ratio is greater than 1. 11 Administrative Expense Administrative Expenses *100 Administrative Expenses *100 Net sales It hepls in indicating business ability to meet its Ratio:- Net sales Administrative activities expenses effectively.. Ideal ratio is greater than 1. 12 Selling Expenses Ratio:- Selling Expenses*100 Selling Expenses*100 Net sales It hepls in indicating business ability to meet its Net sales Selling activities expenses effectively.. Ideal ratio is greater than 1. 13 Opearting Ratio:- Cost of goods sold + [For Manuacturers:- Net sales It hepls in indicating business ability to meet its operating expenses * 100 Opening Stock of FG Operating activities expenses effectively.. Net sales (+) Cost of Production Ideal ratio is greater than 1. (+) Closing Stock of FG For Traders:- Opening Stock of FG (+) purchases (-) Closing Stock of FG] + operating expenses * 100 14 Financial Expenses Ratio:- Financial Expenses *100 Financial Expenses *100 Net sales It hepls in indicating business ability to meet its Net sales Financial activities expenses effectively.. Ideal ratio is greater than 1. 15 Return on Assets:- Net Profit after Tax Earnings after Taxation Average Total Assests or Tangible It indicates Net income per ruppee of average fixed/ Average Total Assets (+) Int. on debt funds Assets or Fixed Assets, i.e. tangible/ total assests. (+) Non Operating Adjts. (1/2 of opg + clg bal.) Net profit after taxes + interest (e.g. Other income/ loss on Average total Assests sale of fixed Assets etc.) Net profit after taxes + interest Average Tangible Assets Net profit after taxes + interest
  • 4. Average Fixed Assests EAT+Interest-Tax advantage on Interest Average Total Assets/Tangible Assets/Fixed Assets. 16 Return on Capital Employed:- Net Profit After Taxes Earnings after Taxation Capital Employed can be computed Overall profitability of the business on the total funds . Average total capital employed (+) Int. on debt funds using- (a) Assets Route or employed can be derived easily with the help of this (+) Non Operating Adjts. (b) Liability Route. Ratio,If ROCE > Interest Rate, use of debt fund is Net Profit After Taxes+Interest (e.g. Other income/ loss on justified. - Tax advantage on interest sale of fixed Assets etc.) Average total capital employed Net Profit After Taxes+Interest Average Total Capital Employed- Average intangible Assets 17 Return on Total Shareholders Net Profit After Taxes Earnings after Taxation Average total Shareholders equity Overall return of the business on the total Equity:- Average total Shareholders equity (+) Int. on debt funds shareholders funds employed can be derived easily (+) Non Operating Adjts. with the help of this Ratio. (e.g. Other income/ loss on sale of fixed Assets etc.) 18 Return on Equity Funds.:- Net Profit After Taxes - preference Earnings after Taxation Net Fixed Assets It indicates profitability of equity funds/ owners funds dividend (+) Int. on debt funds (+) Net Working Capital invested in business. Average Ordinary Shareholders (+) Non Operating Adjts. (-) External Liablities ( LongTerm) Equity or net Worth (e.g. Other income/ loss on sale of fixed Assets etc.) 19 Earnings Per Share ( EPS):- Net profit available to equity Residual earnings, i.e. No. of equity shares outstanding = It indicates return or income per share, whether or not shareholders EAT -preference dividend equity capital distributed as dividends. Number of ordinary share outstanidng face value per share 20 Dividend per share ( DPS):- Net Profit after interest and preference Profits Distributed to equity No. of equity shares outstanding = This ratio basically states the amount of profits dividend paid to ordinary shareholders Shareholders equity capital distributed per share. Number of ordinary shares outstanding face value per share 21 Dividend Pay-out Ratio:- Total dividend to equity holders Net Profit after interest and preference Net profit available to equity It signifies the relationship between dividend total net profit belonging to equity dividend paid to ordinary shareholders shareholders distributed and earnings earned from such dividends. holders Number of ordinary shares outstanding Number of ordinary share outstanidng or Dividend per share ( DPS)
  • 5. Earnings Per Share ( EPS) 22 Earning Yield:- EPS Net profit available to equity Market value of share It indicates true return on equity based on market Market value of share shareholders value of shares. Number of ordinary share outstanidng 23 Dividend Yield:- DPS Net Profit after interest and preference Market value of share It indicates true return on investment based on Market value of share dividend paid to ordinary shareholders market value of shares. Number of ordinary shares outstanding 24 Price Earning Ratio:- Market price of shares Market price of shares Net profit available to equity It indicates the relationship between market price and EPS shareholders EPS, and the shareholders perception of the company. Number of ordinary share outstanidng 25 Earning Power:- Net profit after taxes * sales Earnings after Taxation* sales sales * total assets It indicates the total earning power of business in terms sales total assets (+) Int. on debt funds of sales and fixed assets. (+) Non Operating Adjts. (e.g. Other income/ loss on sale of fixed Assets etc.) 26 Inventory Turnover Ratio:- Cost of goods sold [For Manuacturers:- Average Inventory = Indicates how fast inventory is used/ sold. High T/O ratio Average Inventory Opening Stock of FG 1/2 ( opg. Bal. + clg. Bal) indicates fast moving material while low ratio may mean (+) Cost of Production daed or excessive stock. (+) Closing Stock of FG For Traders:- Opening Stock of FG (+) purchases (-) Closing Stock of FG] 27 Raw Material Turnover:- cost of raw materials used Openeing Stock of Raw Material 1/2 ( opg. Bal. + clg. Bal) Indicates how fast/ regularly Raw materials are used in Average Raw Material inventory (+) Purchases production (-) Closing Stock of Raw material. 28 Work - in - progress:- cost of goods manufactured Materials consumed 1/2 ( opg. Bal. + clg. Bal) It indicates the work - in - progress movements / Average work in progress inventory (+) Wages production cycle. (+) production overhead 29 Debtors Turnover:- Credit sales credit sales net of returns 1/2 ( opg. Bal. + clg. Bal) Indicates the speed of collection of credit sales / debtors. Average Debtors + Average B/R OR Total Sales Debtors + B/R
  • 6. 30 Average Collection Period Months (days) in a year Months (days) in a year Credit sales It states the avearge collection period of dedtors. Debtors Turnover Average Debtors + Average B/R OR Total Sales Debtors + B/R 31 Total assests Turn over:- Cost of goods sold [For Manuacturers:- 1/2 ( opg. Bal. + clg. Bal) Ability to generate sales per ruppee of total assets Average total assests Opening Stock of FG (+) Cost of Production (+) Closing Stock of FG For Traders:- Opening Stock of FG (+) purchases (-) Closing Stock of FG] 32 Fixed Assets Turnover:- Cost of goods sold [For Manuacturers:- 1/2 ( opg. Bal. + clg. Bal) Ability to generate sales per ruppee of fixed assets Average fixed assests Opening Stock of FG (+) Cost of Production (+) Closing Stock of FG For Traders:- Opening Stock of FG (+) purchases (-) Closing Stock of FG] 33 Capital Turnover:- Cost of goods sold [For Manuacturers:- 1/2 ( opg. Bal. + clg. Bal) Ability to generate sales per quantity of capital Average capital employed Opening Stock of FG employed. (+) Cost of Production (+) Closing Stock of FG For Traders:- Opening Stock of FG (+) purchases (-) Closing Stock of FG] 34 Current Assets Turnover:- Cost of goods sold [For Manuacturers:- 1/2 ( opg. Bal. + clg. Bal) Ability to generate sales per ruppee of current assets Average current assests Opening Stock of FG (+) Cost of Production (+) Closing Stock of FG For Traders:- Opening Stock of FG (+) purchases (-) Closing Stock of FG] 35 Working Capital Turnover Ratio:- Cost of goods sold [For Manuacturers:- 1/2 ( opg. Bal. + clg. Bal) Ability to generate sales based on working capital
  • 7. Net Working Capital Opening Stock of FG employment. (+) Cost of Production (+) Closing Stock of FG For Traders:- Opening Stock of FG (+) purchases (-) Closing Stock of FG] DRAFTED BY: VIJAY KUMAR POPAT ROLL NO: 54. SECTION: SA - 1