SlideShare una empresa de Scribd logo
1 de 23
Descargar para leer sin conexión
NFIB       SMALL BUSINESS
                                                  ECONOMIC TRENDS
                                                  William C. Dunkelberg
                                                  Holly Wade


                                                                                                      September 2011


                                                             Based on a Survey of Small and Independent Business Owners


        SMALL BUSINESS OPTIMISM INDEX COMPONENTS
                                                             Seasonally             Change From            Contribution
Index Component                                             Adjusted Level           Last Month           Index Change
Plans to Increase Employment                                       5%                       3                   *
Plans to Make Capital Outlays                                    21%                        1                   *
Plans to Increase Inventories                                    -5%                       -2                   *
Expect Economy to Improve                                       -26%                     -11                    *
Expect Real Sales Higher                                        -12%                     -10                    *
Current Inventory                                                  1%                       1                   *
Current Job Openings                                              15%                      -3                    *
xpected Credit Conditions                                       -13%                       -2                    *
Now a Good Time to Expand                                          5%                      -1                    *
Earnings Trend                                                  -26%                       -2                    *
Total Change                                                                              -20                     *
Column 1 is the current reading; column 2 is the change from the prior month; column 3 the percent of the total change
accounted for by each component; * is under 1 percent and not a meaningful calculation.
NFIB      SMALL BUSINESS
ECONOMIC TRENDS

The NFIB Research Foundation has collected
Small Business Economic Trends Data with Quar-
terly surveys since 1973 and monthly surveys since
1986. The sample is drawn from the membership
files of the National Federation of Independent
Business (NFIB). Each was mailed a question-
naire and one reminder. Subscriptions for twelve
monthly SBET issues are $250. Historical and
unadjusted data are available, along with a copy
of the questionnaire, from the NFIB Research
Foundation. You may reproduce Small Business
Economic Trends items if you cite the publica-
tion name and date and note it is a copyright of
the NFIB Research Foundation. © NFIB Research
Foundation. ISBS #0940791-24-2. Chief Econo-
mist William C. Dunkelberg and Policy Analyst
Holly Wade are responsible for the report.


IN THIS ISSUE

Summary . . . . . . . . . . . . . . . . . . . . . . . . . . . . . . 1
Commentary. . . . . . . . . . . . . . . . . . . . . . . . . . . . 3
Optimism . . . . . . . . . . . . . . . . . . . . . . . . . . . . . . 4
Outlook . . . . . . . . . . . . . . . . . . . . . . . . . . . . . . . 4
Earnings . . . . . . . . . . . . . . . . . . . . . . . . . . . . . . . 6
Sales . . . . . . . . . . . . . . . . . . . . . . . . . . . . . . . . . . 7
Prices . . . . . . . . . . . . . . . . . . . . . . . . . . . . . . . . . 8
Employment. . . . . . . . . . . . . . . . . . . . . . . . . . . . 9
Compensation . . . . . . . . . . . . . . . . . . . . . . . . . 10
Credit Conditions . . . . . . . . . . . . . . . . . . . . . . . 12
Inventories . . . . . . . . . . . . . . . . . . . . . . . . . . . . 14
Capital Outlays. . . . . . . . . . . . . . . . . . . . . . . . . 16
Most Important Problem . . . . . . . . . . . . . . . . . 18
Survey Profile . . . . . . . . . . . . . . . . . . . . . . . . . 19
Economic Survey . . . . . . . . . . . . . . . . . . . . . . . 20
SUMMARY
OPTIMISM INDEX
Confidence in the future of the economy crashed in August, taking the
Small Business PESSImism Index down 1.8 points to 88.1. This was the
sixth monthly decline in a row. The expansion is officially two years and
two months old, but the small business half of the economy is still in the
“tank”. Expectations for real sales growth and business conditions were
the major contributors to the decline for the second month in a row.

LABOR MARKETS
Fifteen (15) percent (seasonally adjusted) reported unfilled job openings,
up 3 points, suggesting that the unemployment rate could ease a fraction or
remain unchanged. Over the next three months, 11 percent plan to increase
employment (up 1 point), and 12 percent plan to reduce their workforce
(up 1 point), yielding a seasonally adjusted 5 percent of owners planning to
create new jobs, a 3 point gain over July. Welcome positive changes, but
still leaving the two indicators at recession levels.

CAPITAL SPENDING
The frequency of reported capital outlays over the past 6 point months rose
2 points to 52 percent of all firms in August, the first improvement in many
months. The percent of owners planning capital outlays in the next three to
six months rose 1 point to 21 percent, a recession level reading that has
typified the recovery to date. Money is available, but most owners are not
interested in a loan to finance the purchase of equipment they don’t need.
Five percent characterized the current period as a good time to expand
facilities (seasonally adjusted), down 1 point and 3 points lower than
January. The net percent of owners expecting better business conditions in
6 months was a negative 26 percent, down 11 points from July, and 36
percentage points lower than January.

INVENTORIES AND SALES
The net percent of owners expecting higher real sales fell 10 points to a net
negative 12 percent of all owners (seasonally adjusted), 25 points below
January’s reading. This is bad news for hiring and inventory investment.
                                                                                                       1 | NFIB Small Business Economic Trends Monthly Report


The net percent of all owners (seasonally adjusted) reporting higher
nominal sales over the past 3 months lost 1 percentage point, falling to a
net negative 9 percent, more firms with sales trending down than up. A net
negative 9 percent of all owners reported growth in inventories (seasonally
adjusted), a 4 point improvement from July although still more owners are
cutting inventory than adding. For all firms, a net 1 percent (up 1 point)
reported stocks too low, a very satisfied reading based on survey history.
Plans to add to inventories fell 2 points to a net negative 5 percent of all
firms (seasonally adjusted), consistent with weak sales expectations and a
poor economic outlook.


This survey was conducted in August 2011. A sample of 3,938 small-business owners/members was drawn.
Nine hundred twenty-six (926) usable responses were received – a response rate of 24 percent.
INFLATION
                                                         Seasonally adjusted, the net percent raising selling prices was 1 percent,
                                                         down 6 points. The price surge that emerged on Main Street a few months
                                                         ago has dissipated, taking the pressure off of the inflation measures. The
                                                         continued weakness in sales trends has blunted small business’s ability to
                                                         raise prices after two years of price cutting to liquidate excess inventories.
                                                         Nineteen (19) percent plan on raising average prices in the next few
                                                         months, 5 percent plan reductions. Seasonally adjusted, a net 16 percent
                                                         plan price hikes, down 3 points.

                                                         EARNINGS AND WAGES
                                                         Reports of positive earnings trends were 2 points worse at a net negative
                                                         26 percent of all owners, not a pretty picture, but still one of the best
                                                         readings in 43 months. With price hikes fading, compensation costs rising
                                                         and sales trends still negative, there is little opportunity to improve the
                                                         bottom line. Of those reporting negative sales trends, 45 percent blamed
                                                         faltering sales, 5 percent higher labor costs, 15 percent higher materials
                                                         costs, 3 percent insurance costs, 8 percent lower selling prices and 10
                                                         percent higher taxes and regulatory costs. Compensation costs are rising,
                                                         but not at a rapid rate. Five percent reported reduced worker compensation
                                                         and 15 percent reported gains yielding a seasonally adjusted net 9 percent
                                                         reporting higher worker compensation, a 1 point decline. A seasonally
                                                         adjusted 7 percent plan to raise compensation in the coming months, up a
                                                         point from July.


                                                         CREDIT MARKETS
                                                         Four percent reported financing as their #1 business problem. So, for the
                                                         overwhelming majority, “credit supply” is not a problem. Ninety-three (93)
                                                         percent reported that all their credit needs were met or that they were not
                                                         interested in borrowing. Seven percent reported that not all of their credit
                                                         needs were satisfied (the record low is 4 percent), and 50 percent said they
                                                         did not want a loan (15 percent did not answer the question, presumably
                                                         also uninterested in borrowing). Twenty-five percent of the owners
2 | NFIB Small Business Economic Trends Monthly Report


                                                         reported that weak sales continued to be their top business problem so new
                                                         investments in new equipment or new workers are not likely to “pay off”
                                                         by generating enough additional earnings to repay the loan required to
                                                         finance the investment. Four percent of owners reported higher interest
                                                         rates on their most recent loan, while 3 percent reported getting a lower
                                                         rate. Thirty-two (32) percent of all owners reported borrowing on a regular
                                                         basis, up 2 points and only 4 points above the record low. A net 13 percent
                                                         reported loans “harder to get” compared to their last attempt (asked of
                                                         regular borrowers only), up 3 points.
COMMENTARY
The August survey was mailed out as Congress and the Administration
reached their “deal” to curb spending and reduce the debt/deficit problems.
Had this been a convincing one to “Main Street,” confidence would have
improved and, likely, also spending and hiring. But, NFIB’s confidence
measure took a dive as did the University of Michigan’s consumer
confidence Index which produced its lowest reading since 1980. In
particular, it was expected real sales gains and expected business
conditions in 6 months that plummeted in the NFIB report. These two
components by themselves lowered the Index 2.1 points versus the total
loss from all 10 components of 1.8 points. With such a dim outlook,
owners are not going to do a lot of hiring or expanding.

Business expansion, the purchase of new equipment and vehicles and even
hiring are “long term” investments. Most important to the decision process
is the sales forecast, but against expected sales over the life of an asset, the
owner must figure in labor costs, taxes, the cost of new regulations,
financing costs and the like to decide whether or not an “investment” will
pay off. This is one reason why “short term” stimuli don’t work. The
planning horizon for the private sector is longer than the time to the next
election!!! At this point, no one knows what their tax rate will be 6 months
from now; no one knows what the health care will do to labor costs. Higher
for sure, but by how much? Yes, the President suspended costly EPA rules
that were going into effect, but you know that they will be back after the
election if he wins

The NLRB is pushing the union agenda, card check, mandating owners to
post notices of the right to unionize, interfering with Boeing’s business
decision making (and the President’s Chief of Staff was on Boeing’s board
when the South Carolina project was approved). Supporters of the
Administration are pushing for another hike in the minimum wage and the
new CEA chairman favors and wants a national sales tax to be imposed. It
would take a book to itemize it all. Short-term fixes will not help, private
sector decision makers think longer term – they do and they don’t like
what they see, there is little clarity or certainty. Consumer spending is still
                                                                                   3 | NFIB Small Business Economic Trends Monthly Report


a key factor and 9 of 10 people who want a job still have a job and would
spend more if they were more confident about the future.
OVERVIEW - SMALL BUSINESS OPTIMISM

                                                                                                                           OPTIMISM INDEX
                                                                                                                      Based on Ten Survey Indicators
                                                                                                                       (Seasonally Adjusted 1986=100)

                                                                                   110
                                                          Index Value (1986=100)


                                                                                   100


                                                                                         90


                                                                                         80
                                                                                              86     88
                                                                                                                                        YEAR


                                                                                                                           OPTIMISM INDEX
                                                                                                                      Based on Ten Survey Indicators
                                                                                                                       (Seasonally Adjusted 1986=100)


                                                                                              Jan     Feb      Mar     Apr May         Jun     Jul Aug Sep             Oct Nov Dec
                                                         2006 101.1 101.5                                      98.0 100.1     98.5     96.7   98.1    95.9     99.4 100.7    99.7            96.5
                                                         2007 98.9                                    98.2     97.3   96.8    97.2     96.0   97.6    96.3     97.3   96.2   94.4            94.6
                                                         2008 91.8                                    92.9     89.6   91.5    89.3     89.2   88.2    91.1     92.9   87.5   87.8            85.2
                                                         2009 84.1                                    82.6     81.0   86.8    88.9     87.9   86.5    88.6     88.8   89.1   88.3            88.0
                                                         2010 89.3                                    88.0     86.8   90.6    92.2     89.0   88.1    88.8     89.0   91.7   93.2            92.6
                                                         2011 94.1                                    94.5     91.9   91.2    90.9     90.8   89.9    88.1


                                                                                                               SMALL BUSINESS OUTLOOK
                                                                                                                                  OUTLOOK
4 | NFIB Small Business Economic Trends Monthly Report


                                                                                                   Good Time to Expand and Expected General Business Conditions
                                                                                                                        January 1986 to August 2011
                                                                                                                           (Seasonally Adjusted)


                                                                                         30                                                                                  80
                                                                                                                                                                                    Percent "Better" Minus "Worse"

                                                                                                                                                                                     Business Conditions (thin line)
                                                         Percent "Good Time to Expand"


                                                                                                                                                                             60
                                                                                                                                                                                          Expected General


                                                                                         20                                                                                  40
                                                                   (thick line)


                                                                                                                                                                             20

                                                                                         10                                                                                  0

                                                                                                                                                                             -20

                                                                                          0                                                                                  -40
                                                                                              86     88   90    92    94     96   98    00    02     04   06    08    10
                                                                                                                                     YEAR
SMALL BUSINESS OUTLOOK (CONTINUED)

                                   OUTLOOK FOR EXPANSION
                        Percent Next Three Months “Good Time to Expand”
                                                (Seasonally Adjusted)


         Jan       Feb       Mar      Apr       May Jun             Jul       Aug Sep            Oct       Nov Dec
 2006     20         20       19        18         18       13        16        13       18        20        17        17
 2007     17         18       12        12         12       13        16        12       14        14        13        14
 2008         9         8         5         6         4         4         6         6    11            5         7         7
 2009         6         3         1         4         5         4         5         5        9         7         8         7
 2010         5         4         2         4         5         6         5         4        6         7         9         8
 2011         8         7         5         4         5         4         6         5


         MOST IMPORTANT REASON FOR EXPANSION OUTLOOK
                                  Reason Percent by Expansion Outlook
                                                      August 2011


          Reason                            Good Time                Not Good Time                     Uncertain
Economic Conditions                                   1                         53                          13
Sales Prospects                                       1                         3                            2
Fin. & Interest Rates                                 2                         2                            0
Cost of Expansion                                     0                         3                            1
Political Climate                                     0                         10                           4
Other/Not Available                                   0                         1                            1


               OUTLOOK FOR GENERAL BUSINESS CONDITIONS
                                                                                                                               5 | NFIB Small Business Economic Trends Monthly Report


                  Net Percent (“Better” Minus “Worse”) Six Months From Now
                                                (Seasonally Adjusted)


        Jan       Feb       Mar       Apr May             Jun       Jul Aug Sep                  Oct Nov Dec
2006      6         3        -5        -3       -10        -8        -6        -8        2       11        11         -4
2007     -1        -2        -7        -8        -3        -5        -1        0         2        -2       -10       -10
2008    -22        -9       -23       -12       -12       -19       -17        4        14        -4        -2       -13
2009    -12       -21       -22        2         12         7        -3       10         8       11         3         2
2010      1        -9        -8        0          8        -6       -15        -8       -3        8        16         9
2011     10         9        -5        -8        -5       -11       -15       -26
SMALL BUSINESS EARNINGS

                                                                                                                        EARNINGS
                                                                                                                Actual Last Three Months
                                                                                                                January 1986 to August 2011
                                                                                                                   (Seasonally Adjusted)
                                                                             0

                                                                            -10
                                                              Net Percent


                                                                            -20

                                                                            -30

                                                                            -40

                                                                            -50
                                                                                  86    88      90         92     94      96     98    00     02     04         06     08       10

                                                                                                                                   YEAR


                                                                                                     ACTUAL EARNINGS CHANGES
                                                                                        Net Percent (“Higher” Minus “Lower”) Last Three Months
                                                                                                     Compared to Prior Three Months
                                                                                                                      (Seasonally Adjusted)


                                                                                  Jan    Feb     Mar            Apr May        Jun     Jul Aug Sep                   Oct Nov Dec
                                                            2006                  -16     -15        -12        -13      -11    -11     -16    -19         -8        -14    -18      -15
                                                            2007                  -21     -19        -15        -19      -15    -18     -17    -22        -20        -18    -25      -20
                                                            2008                  -27     -25        -33        -28      -28    -33     -37    -30        -35        -35    -38      -42
                                                            2009                  -47     -44        -46        -43      -43    -42     -45    -40        -40        -40    -43      -43
                                                            2010                  -42     -39        -43        -31      -28    -32     -33    -30        -33        -26    -30      -34
                                                            2011                  -28     -27        -32        -26      -24    -24     -24    -26


                                                                                   MOST IMPORTANT REASON FOR LOWER EARNINGS
6 | NFIB Small Business Economic Trends Monthly Report


                                                                                                                        Percent Reason
                                                                                                                         August 2011


                                                                                                                Current Month          One Year Ago              Two Years Ago
                                                         Sales Volume                                                    18                   22                            31
                                                         Increased Costs*                                                11                   10                            8
                                                         Cut Selling Prices                                               3                    4                            6
                                                         Usual Seasonal Change                                            3                    3                            2
                                                         Other                                                            5                    3                            3


                                                         * Increased costs include labor, materials, finance, taxes, and regulatory costs.
SMALL BUSINESS SALES

                                                                     SALES
                           Actual (Prior Three Months) and Expected (Next Three Months)
                                                      January 1986 to August 2011
                                                         (Seasonally Adjusted)
              50
              40
              30
              20
Net Percent


              10
               0
              -10
              -20                                                                       Expected

              -30                                                                       Actual
              -40
                    86     88      90       92       94        96        98        00        02         04    06     08       10

                                                                         YEAR


                                                    ACTUAL SALES CHANGES
                                Net Percent (“Higher” Minus “Lower”) Last Three Months
                                             Compared to Prior Three Months
                                                              (Seasonally Adjusted)


                     Jan        Feb       Mar       Apr       May Jun               Jul       Aug Sep              Oct       Nov Dec
      2006                 2          6         5         6      11           6          3          2         5          2      0      3
      2007                 -3      -1           0         4         1         -4         -1         -4        -4      -4        -3     1
      2008                 -7      -8       -11        -9       -11        -12          -15        -10       -11     -21       -25    -29
      2009                -31     -28       -34       -28       -33        -34          -34        -27       -26     -31       -31    -25
      2010                -26     -26       -25       -15       -11        -15          -16        -16       -17     -13       -15    -16
      2011                -11     -11       -12        -5           -9        -7         -8         -9


                                                     SALES EXPECTATIONS
                                                                                                                                            7 | NFIB Small Business Economic Trends Monthly Report


                           Net Percent (“Higher” Minus “Lower”) During Next Three Months
                                                              (Seasonally Adjusted)


                    Jan         Feb       Mar       Apr       May Jun              Jul        Aug Sep              Oct       Nov Dec
2006                     24      28        12        21         20        13            18        10         17     17        21     18
2007                     22      17        14        14         16        11            14        13         14     13         8      6
2008                      4       0         -3        -3       -11        -11           -9         -6        -2     -16       -14    -18
2009                     -20     -29       -31       -11        -5        -10       -11            -5        -6      -4        -2     -1
2010                      3       0         -3        6          5         -5           -4         0         -3      1         6      8
2011                     13      14         6         5          3            0         -2        -12
SMALL BUSINESS PRICES

                                                                                                                                      PRICES
                                                                                                 Actual Last Three Months and Planned Next Three Months
                                                                                                                       January 1986 to August 2011
                                                                                                                          (Seasonally Adjusted)
                                                                                40
                                                                                30
                                                         Net Percent of Firms


                                                                                20
                                                                                10
                                                                                 0
                                                                                -10                                                                                              Planned

                                                                                -20                                                                                              Actual

                                                                                -30
                                                                                      86        88     90     92       94        96     98       00        02        04     06      08       10
                                                                                                                                         YEAR


                                                                                                                     ACTUAL PRICE CHANGES
                                                                                                              Net Percent (“Higher” Minus “Lower”)
                                                                                                                 Compared to Three Months Ago
                                                                                                                               (Seasonally Adjusted)

                                                                                      Jan       Feb        Mar       Apr       May Jun           Jul       Aug Sep               Oct       Nov Dec
                                                         2006                              18        23     17        26         24     23        23            22        20      16        17     8
                                                         2007                              12        13     15        18         16     19        19            13         9      15        14    16
                                                         2008                               8        13     18        20         23     29        32            26        20      15         0     -6
                                                         2009                          -15           -24    -23       -24       -22     -17       -19       -19           -21     -17       -17   -22
                                                         2010                          -18           -21    -20       -11       -15     -13       -11           -8        -11      -5        -4    -5
                                                         2011                              -4         5      9        12         15     10            7          1


                                                                                                                                PRICE PLANS
8 | NFIB Small Business Economic Trends Monthly Report


                                                                                            Net Percent (“Higher” Minus “Lower”) in the Next Three Months
                                                                                                                               (Seasonally Adjusted)


                                                                                       Jan           Feb    Mar       Apr May           Jun       Jul Aug Sep                     Oct Nov Dec
                                                               2006                        29         27     26        28         30     29           30        29         22      21        22    26
                                                                2007                       24         23     22        24         23     21           23        22         21      22        26    26
                                                                2008                       26         22     29        31         32     36           38        30         24      18        11      3
                                                                2009                        2          1         0         1       3         5         5         8          6          5      4      3
                                                                2010                        8         10         9     13         14     11           10        10          7      12        13    15
                                                                2011                       19         21     24        24         23     15           19        16
SMALL BUSINESS EMPLOYMENT


                                     ACTUAL EMPLOYMENT CHANGES
                 Net Percent (“Increase” Minus “Decrease”) in the Last Three Months
                                                         (Seasonally Adjusted)


                Jan       Feb       Mar        Apr        May Jun        Jul       Aug Sep              Oct       Nov Dec
2006                 1          4         -1        -3       -3     -2         2        5         -3         5         0      3
2007                 2          4         -6        -5       -2      0         1        4         -1         3         0      2
2008                 0         -3         -7        -9     -10     -12      -5          -4    -10            -9       -10    -18
2009             -15       -15           -22       -25     -24     -23    -17       -16       -16           -12       -12    -12
2010             -10           -9        -11       -12     -12     -10      -5          -2        -3         -6        -2     -1
2011                 -4        -2         -4        -6       -3     -7      -2          -2


                          QUALIFIED APPLICANTS FOR JOB OPENINGS
                                         Percent Few or No Qualified Applicants
                                                         (Seasonally Adjusted)


            Jan           Feb       Mar        Apr       May Jun         Jul       Aug Sep             Oct        Nov Dec
2006             40            40        39        41       46     45     42        46        44            46        44     40
2007             41            41        43        43       42     45     43        44        48            46        40     37
2008             37            36        36        37       33     39     36        35        38            35        31     30
2009                 *          *        24        24       25     27     26        23        25            25        28     21
2010             24            26        23        26       26     25     28        32        30            28        27     28
2011             28            30        29        32       30     33     31        33


                                                          EMPLOYMENT
                                                                                                                                   9 | NFIB Small Business Economic Trends Monthly Report


                               Planned Next Three Months and Current Job Openings
                                                   January 1986 to August 2011
                                                      (Seasonally Adjusted)
          40

          30
Percent


          20

          10
                                                                               Planned
           0
                                                                               Job Openings
          -10
                86        88        90        92     94      96    98     00       02        04        06        08     10
                                                                  YEAR
SMALL BUSINESS EMPLOYMENT (CONTINUED)


                                                                                                                 JOB OPENINGS
                                                                                             Percent With Positions Not Able to Fill Right Now
                                                                                                                 (Seasonally Adjusted)


                                                                                  Jan     Feb      Mar    Apr May         Jun       Jul Aug Sep                       Oct Nov Dec
                                                            2006                   26       26       23     31      25      25        24          25        25        27     22   19
                                                            2007                   26       25       26     26      24      26        23          25        25        22     19   21
                                                            2008                   24       20       19     21      15      21        17          15        18        14     14   14
                                                            2009                   11       11       10      9        9     11          9          8         8         8      8   10
                                                            2010                   10       11        9     11        9        9      10          11        11        10      9   13
                                                            2011                   13       15       15     14      12      15        12          15


                                                                                                                 HIRING PLANS
                                                                                  Net Percent (“Increase” Minus “Decrease”) in the Next Three Months
                                                                                                                 (Seasonally Adjusted)


                                                                                  Jan     Feb      Mar    Apr May         Jun       Jul Aug Sep                       Oct Nov Dec
                                                            2006                   17       16        9     16      14         9      15          17        17        16     19   10
                                                            2007                   17       13       12     13      13      12        13          15        14        11     11   11
                                                            2008                    9       11        3      5        2        5        5          9         7         0     -4   -6
                                                            2009                   -6       -3      -10     -5       -5     -1          -3         0        -4         -1    -3   -2
                                                            2010                   -1       -1       -2     -1        1        1        2          1        -3         1      4    6
                                                            2011                    3        5        2      2       -1        3        2          5


                                                                                            SMALL BUSINESS COMPENSATION
10 | NFIB Small Business Economic Trends Monthly Report


                                                                                                                 COMPENSATION
                                                                                          Actual Last Three Months and Planned Next Three Months
                                                                                                  January 1986 to August 2011 (Seasonally Adjusted)
                                                                        40
                                                                        35
                                                                        30
                                                                        25
                                                          Net Percent


                                                                        20
                                                                        15
                                                                        10
                                                                                                                           Planned Higher
                                                                         5
                                                                                                                           Actual Higher
                                                                         0
                                                                        -5
                                                                             86      88      90      92     94     96     98       00        02        04        06     08   10
                                                                                                                               YEAR
SMALL BUSINESS COMPENSATION (CONTINUED)


                            ACTUAL COMPENSATION CHANGES
         Net Percent (“Increase” Minus “Decrease”) During Last Three Months
                                            (Seasonally Adjusted)


         Jan         Feb    Mar      Apr May           Jun           Jul Aug Sep        Oct Nov Dec
2006          25      24      22       27      24          22        24      25    28    23           25   21
2007          26      30      28       26      29          26        27      24    27    26           21   24
2008          25      23      24       20      15          20        18      18    17    15           13    9
2009           7       1        0       0         0        -2         1       1     3        0         0    3
2010           1      -2        0       3         2         4         3       3     3        4         8    8
2011          10       8        7       9         9         8        10       9


                                    COMPENSATION PLANS
             Net Percent (“Increase” Minus “Decrease”) in the Next Three Months
                                            (Seasonally Adjusted)


        Jan        Feb      Mar     Apr     May Jun              Jul        Aug Sep     Oct      Nov Dec
2006          16      20      16       19      15          14        17      16    16    18           20   17
2007          16      19      19       18      16          15        16      14    19    16           15   14
2008          12      12      15       14         8        12        12      11    10        9        10    4
2009           3       3        0       2         1         3         4       3     3        5         1    1
2010           1       6        3       5         4         3         5       6     3        5         5    3
2011           5       7        9       7         7         7         6       7


                           PRICES AND LABOR COMPENSATION
                                                                                                                11 | NFIB Small Business Economic Trends Monthly Report


                      Net Percent Increase and Net Percent Compensation
                                            (Seasonally Adjusted)

  40

  30

  20

  10

   0

  -10
                            Actual Prices
  -20                       Actual Compensation
  -30
        86      88     90     92      94     96       98        00     02     04   06   08       10
                                                       YEAR
SMALL BUSINESS CREDIT CONDITIONS

                                                                                                                    CREDIT CONDITIONS
                                                                                                      Loan Availability Compared to Three Months Ago*
                                                                                                                    January 1986 to August 2011
                                                                                    2
                                                                                    0
                                                                                   -2
                                                           Net Percent of Firms


                                                                                   -4
                                                                                   -6
                                                                                   -8
                                                                                  -10
                                                                                  -12
                                                                                  -14
                                                                                  -16
                                                                                  -18
                                                                                        86     88     90     92     94      96    98     00        02        04         06     08     10
                                                                                                                                  YEAR
                                                          * For the population borrowing at least once every three months.


                                                                                                                  REGULAR BORROWERS
                                                                                                     Percent Borrowing at Least Once Every Three Months
                                                                                                                         (Seasonally Adjusted)


                                                                                         Jan       Feb     Mar    Apr    May Jun         Jul       Aug Sep               Oct        Nov Dec
                                                                  2006                       37      38     36      40      38      41     38           46        35         37      38    35
                                                                  2007                       37      39     35      37      38      35     36           35        36         36      32    34
                                                                  2008                       36      34     33      36      35      35     34           34        32         33      31    33
                                                                  2009                       35      36     33      33      34      30     33           32        33         33      33    33
                                                                  2010                       32      34     35      31      32      29     32           31        33         31      28    30
                                                                  2011                       31      31     29      32      29      29     30           32


                                                                                                                  AVAILABILITY OF LOANS
12 | NFIB Small Business Economic Trends Monthly Report


                                                                                                             Net Percent (“Easier” Minus “Harder”)
                                                                                                                Compared to Three Months Ago
                                                                                                                         (Regular Borrowers)


                                                                                         Jan        Feb    Mar     Apr May        Jun     Jul Aug Sep                        Oct Nov Dec
                                                                2006                          -5     -5      -6     -4       -5     -5        -6        -8         -3         -6      -6    -6
                                                                2007                          -5     -5      -7     -5       -6     -5        -5        -7         -9         -6      -7    -7
                                                                2008                          -7     -5      -7     -9       -8     -7        -9    -10           -11         -9     -11   -12
                                                                2009                         -13    -13     -12    -14     -16     -14    -15       -14           -14        -14     -15   -15
                                                                2010                         -14    -12     -15    -14     -13     -13    -13       -12           -14        -11     -11   -12
                                                                2011                         -10    -11      -8     -9     -10      -9    -10       -13
SMALL BUSINESS CREDIT CONDITIONS (CONTINUED)


                                                         BORROWING NEEDS SATISFIED
                                           Percent of All Businesses Last Three Months Satisfied/
                                          Percent of All Businesses Last Three Months Not Satisfied
                                                                         (All Borrowers)


                               Jan        Feb       Mar         Apr    May Jun             Jul    Aug Sep          Oct      Nov Dec
2006 36/4                                 37/6       36/6       38/5    38/5    39/5       38/4   44/4   34/4        36/7   34/4    36/5
2007 36/5                                 40/5       35/5       38/4    39/6    36/4       37/5   35/4   37/5        36/6   32/4    32/7
2008 34/5                                 35/4       32/6       34/5    34/7    35/5       32/7   35/6   33/6        31/6   31/7    32/6
2009 33/8                                 32/8 29/10            30/8    28/9 30/10 28/10          30/7 30/10         29/9 29/10     28/8
2010 27/11                                29/9 29/11            28/9    28/8 25/10         27/9   27/9   27/9        26/9   25/9    28/9
2011 28/8                                 29/8       28/7       28/8    28/8    25/9       28/8   28/7


                                                         EXPECTED CREDIT CONDITIONS
                                    Net Percent (“Easier” Minus “Harder”) During Next Three Months
                                                                       (Regular Borrowers)


                                Jan       Feb        Mar        Apr May         Jun         Jul Aug Sep              Oct Nov Dec
2006                                 -6        -7         -7      -8      -8         -8      -7     -9        -5       -6     -5                                -7
2007                                 -7        -8         -8      -7      -6         -6      -6     -9    -10          -8     -8            -10
2008                                 -9        -8         -9     -11     -10        -10     -12    -11    -13         -16    -13            -15
2009                                -14    -16           -14     -12     -15        -13     -14    -13    -15         -16    -15            -15
2010                                -13    -14           -16     -15     -12        -13     -14    -14    -14         -12    -10            -11
2011                                -10    -10            -9     -13     -11        -10     -11    -13


                                                                      INTEREST RATES
                                                                                                                                                                     13 | NFIB Small Business Economic Trends Monthly Report


                                               Relative Rates and Actual Rates Last Three Months
                                                                 January 1986 to August 2011

                                                                                                                              40
                               13
                                                                                                                                    Rate Relative (thin line)
 Avg. Short-term Rate (thick


                                                                                                                              20
                               11

                                                                                                                              0
                               9
            line)


                               7                                                                                              -20


                               5                                                                                              -40
                                    86    88        90     92    94     96     98     00     02   04     06     08     10
                                                                                YEAR
SMALL BUSINESS CREDIT CONDITIONS (CONTINUED)


                                                                                                   RELATIVE INTEREST RATE PAID BY
                                                                                                       REGULAR BORROWERS
                                                                               Net Percent (“Higher” Minus “Lower”) Compared to Three Months Ago


                                                                                   Jan     Feb     Mar    Apr May          Jun       Jul Aug Sep                     Oct Nov Dec
                                                                2006                26       32      29    32     28        30           30        34         22      20     23    16
                                                                2007                17       21      19    16     15        12           12        14         15       4      3     1
                                                                2008                 0       -9      -5    -12    -15       -11          -4         -2         -3      -2     -6    -8
                                                                2009               -12       -9      -1     -2         0        0         3         3          5       3      8     3
                                                                2010                 6        6       9     5          4        0         2         3          1       1      0     1
                                                                2011                 3        6       5     5          3        0         0         1

                                                          Borrowing at Least Once Every Three Months.


                                                                                                  ACTUAL INTEREST RATE PAID ON
                                                                                                SHORT-TERM LOANS BY BORROWERS
                                                                                                           Average Interest Rate Paid


                                                                               Jan        Feb      Mar    Apr    May Jun            Jul       Aug Sep                Oct    Nov Dec
                                                               2006                8.1      8.3     8.0    8.7    8.1       8.7      9.1           9.0        8.8     8.8    8.3   9.8
                                                               2007                9.1      9.3     9.3    9.2    9.5       9.3      9.2           8.7        9.0     9.1    8.5   8.5
                                                               2008                8.3      8.1     8.3    7.7    6.9       7.1      7.0           6.9        7.1     6.6    7.0   6.6
                                                               2009                6.4      6.2     6.2    6.1    6.3       6.5      6.5           6.1        6.1     6.0    5.9   6.3
                                                               2010                6.3      6.0     6.8    6.4    6.5       6.0      6.3           6.3        6.2     6.0    5.7   6.2
                                                               2011                6.0      6.0     5.9    6.5    6.0       6.0      5.9           6.1


                                                                                                  SMALL BUSINESS INVENTORIES
14 | NFIB Small Business Economic Trends Monthly Report


                                                                                                                 INVENTORIES
                                                                                         Actual (Last Three Months) and Planned (Next Three Months)
                                                                                                           January 1986 to August 2011
                                                                                                              (Seasonally Adjusted)
                                                                        15
                                                                        10
                                                                         5
                                                                         0
                                                          Net Percent


                                                                         -5
                                                                        -10
                                                                        -15
                                                                        -20                                                                   Actual

                                                                        -25                                                                   Planned
                                                                        -30
                                                                              86     88       90     92    94     96       98       00        02         04     06     08     10
                                                                                                                           YEAR
SMALL BUSINESS INVENTORIES (CONTINUED)


                                ACTUAL INVENTORY CHANGES
         Net Percent (“Increase” Minus “Decrease”) During Last Three Months
                                                    (Seasonally Adjusted)


        Jan         Feb       Mar        Apr        May Jun              Jul       Aug Sep            Oct        Nov Dec
2006           3          1          6          0       -2          0          0         3        1          0         0    -3
2007           1          5          2         -2          2    -5            -2     -3       -2            -1     -6       -3
2008         -4          -2      -7        -10        -12      -11        -14       -13      -12        -13       -17      -21
2009      -18        -19        -23        -27        -27      -27        -27       -24      -24        -26       -25      -28
2010      -21        -18        -18        -18        -20      -21        -19       -15      -14        -16       -15      -13
2011      -10            -8      -7            -9     -13      -14        -13        -9


                                        INVENTORY SATISFACTION
                   Net Percent (“Too Low” Minus “Too Large”) at Present Time
                                                    (Seasonally Adjusted)


       Jan         Feb        Mar        Apr        May Jun             Jul        Aug Sep            Oct        Nov Dec
2006      -1         -2         0          -1         -1       -1         -2        -6       -6         -3        -6       -7
2007      -2         -2         -5         -3         -6       -7         -2        -2       -3         -7        -3       -3
2008      -4         -4         -1         -1         -3       -1         -4        -3       -1         -4        -4       -7
2009      -6         -5         -4         -5         -2       -5         -4        -4       0          -3        -2       -4
2010      -1         -1         -1         1           0       -1         0         -1       -2         1         -3       -3
2011       0          2         -1         1          -1       -1         0          1
                                                                                                                                 15 | NFIB Small Business Economic Trends Monthly Report


                                               INVENTORY PLANS
       Net Percent (“Increase” Minus “Decrease”) in the Next Three to Six Months
                                                    (Seasonally Adjusted)


        Jan        Feb        Mar        Apr        May Jun             Jul        Aug Sep            Oct        Nov Dec
2006         5           7          3          2        3       0             1      -1      -1             4      0        0
2007         2           3          3          3        0      -3             2      -4       0             1      2       -3
2008       -4         -2        -2         -1          -4      -5         -4         -9      -3         -5         -6      -4
2009     -10         -10       -13         -7          -3      -6         -5         -7      -6         -3         -3      -8
2010       -4         -7        -7         -2           2      -3         -4         -7      -3         -4         0       -3
2011       -1         -2            1      -1          -3      -3         -3         -5
SMALL BUSINESS CAPITAL OUTLAYS


                                                                                INVENTORY SATISFACTION AND INVENTORY PLANS
                                                                                   Net Percent (“Too Low” Minus “Too Large”) at Present Time
                                                                              Net Percent Planning to Add Inventories in the Next Three to Six Months
                                                                                                                       (Seasonally Adjusted)
                                                                        15

                                                                        10

                                                                         5

                                                                         0
                                                          Percent


                                                                         -5

                                                                        -10                                                                           Inventory Plans
                                                                                                                                                      Inventory Satisfaction
                                                                        -15
                                                                              86        88      90        92      94       96    98     00       02        04        06     08    10

                                                                                                                                       YEAR


                                                                                                               CAPITAL EXPENDITURES
                                                                                             Actual Last Six Months and Planned Next Three Months
                                                                                                                  January 1986 to August 2011
                                                                                                                     (Seasonally Adjusted)

                                                                         75                             Actual
                                                                                                        Planned
                                                                         65

                                                                         55
                                                              Percent


                                                                         45

                                                                         35

                                                                         25

                                                                         15
                                                                              86        88         90     92      94      96     98    00        02      04      06       08     10
                                                                                                                                  YEAR


                                                                                                     ACTUAL CAPITAL EXPENDITURES
16 | NFIB Small Business Economic Trends Monthly Report


                                                                                   Percent Making a Capital Expenditure During the Last Six Months


                                                                              Jan        Feb        Mar        Apr      May Jun         Jul      Aug Sep              Oct      Nov Dec
                                                          2006                     62         63        62        62       62     60        61        62        63        62     63    61
                                                          2007                     62         61        61        60       60     55        58        58        60        61     56    62
                                                          2008                     58         58        57        56       54     52        52        54        52        54     56    51
                                                          2009                     51         52        50        46       46     46        46        45        44        45     44    44
                                                          2010                     47         47        45        46       46     46        45        44        45        47     51    47
                                                          2011                     51         49        51        50       50     50        50        52
SMALL BUSINESS CAPITAL OUTLAYS (CONTINUED)


                  TYPE OF CAPITAL EXPENDITURES MADE
                  Percent Purchasing or Leasing During Last Six Months


           Type                      Current         One Year Ago       Two Years Ago
Vehicles                               20                    14               13
Equipment                              36                    29               31
Furniture or Fixtures                  10                     7                8
Add. Bldgs. or Land                     5                     2                4
Improved Bldgs. or Land                13                    11               11


                AMOUNT OF CAPITAL EXPENDITURES MADE
                       Percent Distribution of Per Firm Expenditures
                                During the Last Six Months


           Amount                    Current          One Year Ago      Two Years Ago
$1 to $999                               4                    4                3
$1,000 to $4,999                        10                    8                8
$5,000 to $9,999                         6                    6                5
$10,000 to $49,999                      16                    14               16
$50,000 to $99,999                       7                    4                6
$100,000 +                               8                    7                7
No Answer                                1                    1                0
                                                                                         17 | NFIB Small Business Economic Trends Monthly Report


                         CAPITAL EXPENDITURE PLANS
        Percent Planning a Capital Expenditure During Next Three to Six Months
                                     (Seasonally Adjusted)


        Jan     Feb    Mar    Apr    May Jun         Jul     Aug Sep    Oct   Nov Dec
 2006      32     35     31     33      28     27      31     28   30    31    31   26
 2007      30     30     33     29      29     28      27     27   29    27    27   30
 2008      25     26     25     26      25     26      21     23   21    19    21   17
 2009      19     18     16     19      20     17      18     16   18    17    16   18
 2010      20     20     19     19      20     19      18     16   19    18    20   21
 2011      22     22     24     21      20     21      20     21
SINGLE MOST IMPORTANT PROBLEM


                                                                                             SINGLE MOST IMPORTANT PROBLEM
                                                                                                                    August 2011

                                                                                                                                   One                 Survey              Survey
                                                                                       Problem                  Current          Year Ago               High                Low
                                                                  Taxes                                              18                   21               32                       8
                                                                  Inflation                                          6                    3                41                       0
                                                                  Poor Sales                                         25                   31               34                       2
                                                                  Fin. & Interest Rates                              4                    4                37                       1
                                                                  Cost of Labor                                      3                    4                    9                    2
                                                                  Govt. Reqs. & Red Tape                             19                   15               27                       4
                                                                  Comp. From Large Bus.                              5                    5                14                       4
                                                                  Quality of Labor                                   4                    5                24                       3
                                                                  Cost/Avail. of Insurance                           8                    8                29                       4
                                                                  Other                                              8                    4                31                       1


                                                                                       SELECTED SINGLE MOST IMPORTANT PROBLEM
                                                                                             Inflation, Big Business, Insurance and Regulation
                                                                                                            January 1986 to August 2011
                                                                             40                                               Big Business                         Insurance
                                                                                                                              Inflation                            Regulation

                                                                             30
                                                          Percent of Firms


                                                                             20


                                                                             10


                                                                             0
                                                                                  86    88    90       92     94     96       98      00          02     04          06        08       10
                                                                                                                               YEAR
18 | NFIB Small Business Economic Trends Monthly Report


                                                                                       SELECTED SINGLE MOST IMPORTANT PROBLEM
                                                                                              Taxes, Interest Rates, Sales and Labor Quality
                                                                                                            January 1986 to August 2011
                                                                             40                    Taxes                                       Sales
                                                                                                   Interest Rates & Finance                    Labor Quality
                                                                             30
                                                          Percent of Firms


                                                                             20


                                                                             10


                                                                             0
                                                                                  86    88    90       92     94     96       98      00          02     04          06        08       10
                                                                                                                               YEAR
SURVEY PROFILE


                              OWNER/MEMBERS PARTICIPATING IN
                                  ECONOMIC SURVEY NFIB
                                       Actual Number of Firms


                  Jan   Feb    Mar   Apr   May Jun      Jul   Aug Sep     Oct    Nov Dec
2006 1274               484     471 1094    440   416 1007      480   380 1075   451   446
2007 1755               750     737 1703    618   589 1613      720   674 1614   719   670
2008 1845               700     735 1768    737   703 1827      812   743 1992   826   805
2009 2013               846     867 1794    814   758 1994      882   827 2059   825   830
2010 2114               799     948 2176    823   804 2029      874   849 1910   807   804
2011 2144               774     811 1985    733   766 1817      926


                          NFIB OWNER/MEMBERS PARTICIPATING
                                 IN ECONOMIC SURVEY
                                      Industry of Small Business
             30
             25
             20
Percent


             15
             10
             5
             0


                          NFIB OWNER/MEMBERS PARTICIPATING
                                                                                             19 | NFIB Small Business Economic Trends Monthly Report


                                 IN ECONOMIC SURVEY
                                Number of Full and Part-Time Employees

             30

             25

             20
   Percent


             15

             10

              5

              0
NFIB RESEARCH FOUNDATION SMALL
                                                            BUSINESS ECONOMIC SURVEY

                                                                     SMALL BUSINESS SURVEY QUESTIONS                                                      PAGE IN REPORT

                                                            Do you think the next three months will be a good time
                                                            for small business to expand substantially? Why? . . . . . . . . . . . . . . . 4

                                                            About the economy in general, do you think that six
                                                            months from now general business conditions will be
                                                            better than they are now, about the same, or worse? . . . . . . . . . . . .                          5

                                                            Were your net earnings or “income” (after taxes) from your
                                                            business during the last calendar quarter higher, lower, or
                                                            about the same as they were for the quarter before?. . . . . . . . . . . . .                         6

                                                            If higher or lower, what is the most important reason?. . . . . . . . . . . . 6

                                                            During the last calendar quarter, was your dollar sales
                                                            volume higher, lower, or about the same as it was for
                                                            the quarter before?. . . . . . . . . . . . . . . . . . . . . . . . . . . . . . . . . . . .           7

                                                            Overall, what do you expect to happen to real volume
                                                            (number of units) of goods and/or services that you will
                                                            sell during the next three months?. . . . . . . . . . . . . . . . . . . . . . . . .                  7

                                                            How are your average selling prices compared to
                                                            three months ago?. . . . . . . . . . . . . . . . . . . . . . . . . . . . . . . . . . . .             8

                                                            In the next three months, do you plan to change the
                                                            average selling prices of your goods and/or services? . . . . . . . . . . . . 8

                                                            During the last three months, did the total number of employees
                                                            in your firm increase, decrease, or stay about the same?. . . . . . . . . . 9

                                                            If you have filled or attempted to fill any job openings
20 | NFIB Small Business Economic Trends Quarterly Report


                                                            in the past three months, how many qualified applicants
                                                            were there for the position(s)?. . . . . . . . . . . . . . . . . . . . . . . . . . . .               9

                                                            Do you have any job openings that you are not able
                                                            to fill right now?. . . . . . . . . . . . . . . . . . . . . . . . . . . . . . . . . . . . .         10

                                                            In the next three months, do you expect to increase or
                                                            decrease the total number of people working for you? . . . . . . . . . . . 10

                                                            Over the past three months, did you change the average
                                                            employee compensation?. . . . . . . . . . . . . . . . . . . . . . . . . . . . . . .                 11

                                                            Do you plan to change average employee compensation
                                                            during the next three months?. . . . . . . . . . . . . . . . . . . . . . . . . . .                  11
SMALL BUSINESS SURVEY QUESTIONS                                                         PAGE IN REPORT

                                                          Are…loans easier or harder to get than they were
                                                          three months ago? . . . . . . . . . . . . . . . . . . . . . . . . . . . . . . . . . . . . . .. . . . . . . . .12

                                                          During the last three months, was your firm able to
                                                          satisfy its borrowing needs?. . . . . . . . . . . . . . . . . . . . . . . . . . . . . . . . . . . . . . .13

                                                          Do you expect to find it easier or harder to obtain your
                                                          required financing during the next three months?. . . . . .. . . . . . . . . . . . . . . . .13

                                                          If you borrow money regularly (at least once every three
                                                          months) as part of your business activity, how does the
                                                          rate of interest payable on your most recent loan compare
                                                          with that paid three months ago?. . . . . . . . . . . . . . . . . . . . . . . . . . . . . . . . . . . .14

                                                          If you borrowed within the last three months for business
                                                          purposes, and the loan maturity (pay back period) was 1
                                                          year or less, what interest rate did you pay? . . . . . . . . . . .. . . . . . . . . . .. . . . .14

                                                          During the last three months, did you increase or decrease
                                                          your inventories?. . . . . . . . . . . . . . . . . . . . . . . . . . . . . . . .. . . . . . . . . . . . . . . . . .15

                                                          At the present time, do you feel your inventories are too
                                                          large, about right, or inadequate?. . . . . . . . . . . . . . . . . . . . . . . . . . . . . . . . . . . .15

                                                          Looking ahead to the next three months to six months,
                                                          do you expect, on balance, to add to your inventories,
                                                          keep them about the same, or decrease them? . . . . . . . . . . . . . . . . . . . . . . . .15

                                                          During the last six months, has your firm made any capital
                                                          expenditures to improve or purchase equipment, buildings,
                                                          or land? . . . . . . . . . . . . . . . . . . . . . . . . . . .. . . . . . . . . . . . . . . . . . . . . . . . . . . . . .16

                                                          If [your firm made any capital expenditures], what was
21 | NFIB Small Business Economic Trends Monthly Report


                                                          the total cost of all these projects? . . . . . . . . . . . . . . . . . . . . . . . . . . . . . . . . . .17

                                                          Looking ahead to the next three to six months, do you
                                                          expect to make any capital expenditures for plant
                                                          and/or physical equipment? . . . . . . . . . . . . . . .. . . . . . . . . . . . . . . . . . . . . . . . .17

                                                          What is the single most important problem facing your
                                                          business today? . . . . . . . . . . . . . . . . . . . . . . . . . . . . . . . . . . . . . . . . . . . . . . . . .18

                                                          Please classify your major business activity, using one
                                                          of the categories of example below.. . . . . . . . . . . . . . . . . . . . . . . . . . . . . . . . . .19

                                                          How many employees do you have full and part-time,
                                                          including yourself? . . . . . . . . . . . . . . . . . . . . . . . . . . . . . . . . . . . . . . . . . . . . . . .19

Más contenido relacionado

La actualidad más candente

Nathan Morgan_Home Depot analysis
Nathan Morgan_Home Depot analysisNathan Morgan_Home Depot analysis
Nathan Morgan_Home Depot analysis
Nathan Morgan
 
FMP Market Themes and Outlook January 2013
FMP Market Themes and Outlook January 2013FMP Market Themes and Outlook January 2013
FMP Market Themes and Outlook January 2013
kmyoung1
 
Economy Update 1st September 2011
Economy Update 1st September 2011Economy Update 1st September 2011
Economy Update 1st September 2011
ar330011
 
C25594 impact rising_interest_rates
C25594 impact rising_interest_ratesC25594 impact rising_interest_rates
C25594 impact rising_interest_rates
123jumpad
 

La actualidad más candente (19)

Miles Kirkland Counsels Patience, Diversification
Miles Kirkland Counsels Patience, DiversificationMiles Kirkland Counsels Patience, Diversification
Miles Kirkland Counsels Patience, Diversification
 
Nathan Morgan_Home Depot analysis
Nathan Morgan_Home Depot analysisNathan Morgan_Home Depot analysis
Nathan Morgan_Home Depot analysis
 
Weekly Market Snapshot, July 31, 2009
Weekly Market Snapshot, July 31, 2009Weekly Market Snapshot, July 31, 2009
Weekly Market Snapshot, July 31, 2009
 
2006:Q3
2006:Q32006:Q3
2006:Q3
 
FMP Market Themes and Outlook January 2013
FMP Market Themes and Outlook January 2013FMP Market Themes and Outlook January 2013
FMP Market Themes and Outlook January 2013
 
Economy Update 1st September 2011
Economy Update 1st September 2011Economy Update 1st September 2011
Economy Update 1st September 2011
 
MNI China Consumer Press Release July 2014
MNI China Consumer Press Release July 2014MNI China Consumer Press Release July 2014
MNI China Consumer Press Release July 2014
 
India_Equity_Strategy_2016
India_Equity_Strategy_2016India_Equity_Strategy_2016
India_Equity_Strategy_2016
 
New Market Highs and Positive Expected Returns
New Market Highs and Positive Expected ReturnsNew Market Highs and Positive Expected Returns
New Market Highs and Positive Expected Returns
 
US Business Cycle Timing
US Business Cycle TimingUS Business Cycle Timing
US Business Cycle Timing
 
Oil, Inflation and Fed Policy
Oil, Inflation and Fed PolicyOil, Inflation and Fed Policy
Oil, Inflation and Fed Policy
 
enterpriseSeattle 2011 Forecast - Mike Dueker
enterpriseSeattle 2011 Forecast - Mike DuekerenterpriseSeattle 2011 Forecast - Mike Dueker
enterpriseSeattle 2011 Forecast - Mike Dueker
 
C25594 impact rising_interest_rates
C25594 impact rising_interest_ratesC25594 impact rising_interest_rates
C25594 impact rising_interest_rates
 
Finlight Research - Market perspectives - Dec 2015
Finlight Research - Market perspectives - Dec 2015Finlight Research - Market perspectives - Dec 2015
Finlight Research - Market perspectives - Dec 2015
 
Weekly Market Snapshot August 31, 2009
Weekly Market Snapshot August 31, 2009Weekly Market Snapshot August 31, 2009
Weekly Market Snapshot August 31, 2009
 
Large scale asset purchases (QE) - intent & after effects!!
Large scale asset purchases (QE) - intent & after effects!!Large scale asset purchases (QE) - intent & after effects!!
Large scale asset purchases (QE) - intent & after effects!!
 
Earnings executive commentary 3 q 2017
Earnings executive commentary 3 q 2017Earnings executive commentary 3 q 2017
Earnings executive commentary 3 q 2017
 
Investment Insights for September, 2017
Investment Insights for September, 2017Investment Insights for September, 2017
Investment Insights for September, 2017
 
Fixed Income Update - February 2019
Fixed Income Update - February 2019Fixed Income Update - February 2019
Fixed Income Update - February 2019
 

Similar a Small Business Economic Trends

NFIB: Small Business
NFIB: Small BusinessNFIB: Small Business
NFIB: Small Business
Bob Lowery
 
McKesson Investor/Analyst Day
	 McKesson Investor/Analyst Day	 McKesson Investor/Analyst Day
McKesson Investor/Analyst Day
finance2
 
Jp morgan -_032113_presentation_-_final
Jp morgan -_032113_presentation_-_finalJp morgan -_032113_presentation_-_final
Jp morgan -_032113_presentation_-_final
CNOServices
 
The IBR India Newsletter
The IBR India NewsletterThe IBR India Newsletter
The IBR India Newsletter
IBR_India
 
Apresentacao teleconferencia eng_1_t11
Apresentacao teleconferencia eng_1_t11Apresentacao teleconferencia eng_1_t11
Apresentacao teleconferencia eng_1_t11
risantander
 
4th Qtr Year End 2011 Economic Review Feb 15 [Autosaved] [Autosaved]
4th Qtr Year End 2011 Economic  Review Feb 15 [Autosaved] [Autosaved]4th Qtr Year End 2011 Economic  Review Feb 15 [Autosaved] [Autosaved]
4th Qtr Year End 2011 Economic Review Feb 15 [Autosaved] [Autosaved]
Gary Crosbie
 
bristol myerd squibb Credit Suisse 2008 Healthcare Conference
bristol myerd squibb Credit Suisse 2008 Healthcare Conferencebristol myerd squibb Credit Suisse 2008 Healthcare Conference
bristol myerd squibb Credit Suisse 2008 Healthcare Conference
finance13
 

Similar a Small Business Economic Trends (20)

NFIB: Small Business
NFIB: Small BusinessNFIB: Small Business
NFIB: Small Business
 
Small Business Economic Trends Report from NFIB -- July 2015
Small Business Economic Trends Report from NFIB -- July 2015Small Business Economic Trends Report from NFIB -- July 2015
Small Business Economic Trends Report from NFIB -- July 2015
 
Q1 fy-2017-earnings-presentation final
Q1 fy-2017-earnings-presentation finalQ1 fy-2017-earnings-presentation final
Q1 fy-2017-earnings-presentation final
 
McKesson Investor/Analyst Day
	 McKesson Investor/Analyst Day	 McKesson Investor/Analyst Day
McKesson Investor/Analyst Day
 
Jp morgan -_032113_presentation_-_final
Jp morgan -_032113_presentation_-_finalJp morgan -_032113_presentation_-_final
Jp morgan -_032113_presentation_-_final
 
Q4 fy 2016 earnings presentation final
Q4 fy 2016 earnings presentation finalQ4 fy 2016 earnings presentation final
Q4 fy 2016 earnings presentation final
 
January 2013's Monthly Indicators report
January 2013's Monthly Indicators reportJanuary 2013's Monthly Indicators report
January 2013's Monthly Indicators report
 
The IBR India Newsletter
The IBR India NewsletterThe IBR India Newsletter
The IBR India Newsletter
 
Market Perspectives - February 2019
Market Perspectives - February 2019Market Perspectives - February 2019
Market Perspectives - February 2019
 
1 t11
 1 t11 1 t11
1 t11
 
Apresentacao teleconferencia eng_1_t11
Apresentacao teleconferencia eng_1_t11Apresentacao teleconferencia eng_1_t11
Apresentacao teleconferencia eng_1_t11
 
Day 1 session 3A - 1530 - 1700 hours - Variable Annuity products: respondin...
Day 1   session 3A - 1530 - 1700 hours - Variable Annuity products: respondin...Day 1   session 3A - 1530 - 1700 hours - Variable Annuity products: respondin...
Day 1 session 3A - 1530 - 1700 hours - Variable Annuity products: respondin...
 
Third Quarter Analyst Briefing as at 31 December 2011
Third Quarter Analyst Briefing as at 31 December 2011Third Quarter Analyst Briefing as at 31 December 2011
Third Quarter Analyst Briefing as at 31 December 2011
 
4th Qtr Year End 2011 Economic Review Feb 15 [Autosaved] [Autosaved]
4th Qtr Year End 2011 Economic  Review Feb 15 [Autosaved] [Autosaved]4th Qtr Year End 2011 Economic  Review Feb 15 [Autosaved] [Autosaved]
4th Qtr Year End 2011 Economic Review Feb 15 [Autosaved] [Autosaved]
 
Fis strategic insights vol 6 march 2012
Fis strategic insights   vol 6 march 2012Fis strategic insights   vol 6 march 2012
Fis strategic insights vol 6 march 2012
 
Five Senario Planning
Five Senario PlanningFive Senario Planning
Five Senario Planning
 
Half Year Investor Presentation as at 30 September 2012
Half Year Investor Presentation as at 30 September 2012 Half Year Investor Presentation as at 30 September 2012
Half Year Investor Presentation as at 30 September 2012
 
FirstBank Nigeria 2010 Result Presentation
FirstBank Nigeria  2010 Result PresentationFirstBank Nigeria  2010 Result Presentation
FirstBank Nigeria 2010 Result Presentation
 
Unicon Monthly Research report (thepathfinder)march2011
Unicon Monthly Research report  (thepathfinder)march2011Unicon Monthly Research report  (thepathfinder)march2011
Unicon Monthly Research report (thepathfinder)march2011
 
bristol myerd squibb Credit Suisse 2008 Healthcare Conference
bristol myerd squibb Credit Suisse 2008 Healthcare Conferencebristol myerd squibb Credit Suisse 2008 Healthcare Conference
bristol myerd squibb Credit Suisse 2008 Healthcare Conference
 

Small Business Economic Trends

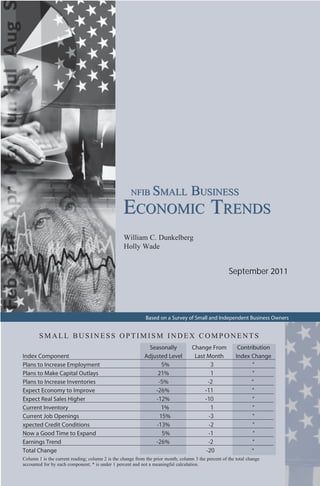
  • 1. NFIB SMALL BUSINESS ECONOMIC TRENDS William C. Dunkelberg Holly Wade September 2011 Based on a Survey of Small and Independent Business Owners SMALL BUSINESS OPTIMISM INDEX COMPONENTS Seasonally Change From Contribution Index Component Adjusted Level Last Month Index Change Plans to Increase Employment 5% 3 * Plans to Make Capital Outlays 21% 1 * Plans to Increase Inventories -5% -2 * Expect Economy to Improve -26% -11 * Expect Real Sales Higher -12% -10 * Current Inventory 1% 1 * Current Job Openings 15% -3 * xpected Credit Conditions -13% -2 * Now a Good Time to Expand 5% -1 * Earnings Trend -26% -2 * Total Change -20 * Column 1 is the current reading; column 2 is the change from the prior month; column 3 the percent of the total change accounted for by each component; * is under 1 percent and not a meaningful calculation.
  • 2. NFIB SMALL BUSINESS ECONOMIC TRENDS The NFIB Research Foundation has collected Small Business Economic Trends Data with Quar- terly surveys since 1973 and monthly surveys since 1986. The sample is drawn from the membership files of the National Federation of Independent Business (NFIB). Each was mailed a question- naire and one reminder. Subscriptions for twelve monthly SBET issues are $250. Historical and unadjusted data are available, along with a copy of the questionnaire, from the NFIB Research Foundation. You may reproduce Small Business Economic Trends items if you cite the publica- tion name and date and note it is a copyright of the NFIB Research Foundation. © NFIB Research Foundation. ISBS #0940791-24-2. Chief Econo- mist William C. Dunkelberg and Policy Analyst Holly Wade are responsible for the report. IN THIS ISSUE Summary . . . . . . . . . . . . . . . . . . . . . . . . . . . . . . 1 Commentary. . . . . . . . . . . . . . . . . . . . . . . . . . . . 3 Optimism . . . . . . . . . . . . . . . . . . . . . . . . . . . . . . 4 Outlook . . . . . . . . . . . . . . . . . . . . . . . . . . . . . . . 4 Earnings . . . . . . . . . . . . . . . . . . . . . . . . . . . . . . . 6 Sales . . . . . . . . . . . . . . . . . . . . . . . . . . . . . . . . . . 7 Prices . . . . . . . . . . . . . . . . . . . . . . . . . . . . . . . . . 8 Employment. . . . . . . . . . . . . . . . . . . . . . . . . . . . 9 Compensation . . . . . . . . . . . . . . . . . . . . . . . . . 10 Credit Conditions . . . . . . . . . . . . . . . . . . . . . . . 12 Inventories . . . . . . . . . . . . . . . . . . . . . . . . . . . . 14 Capital Outlays. . . . . . . . . . . . . . . . . . . . . . . . . 16 Most Important Problem . . . . . . . . . . . . . . . . . 18 Survey Profile . . . . . . . . . . . . . . . . . . . . . . . . . 19 Economic Survey . . . . . . . . . . . . . . . . . . . . . . . 20
  • 3. SUMMARY OPTIMISM INDEX Confidence in the future of the economy crashed in August, taking the Small Business PESSImism Index down 1.8 points to 88.1. This was the sixth monthly decline in a row. The expansion is officially two years and two months old, but the small business half of the economy is still in the “tank”. Expectations for real sales growth and business conditions were the major contributors to the decline for the second month in a row. LABOR MARKETS Fifteen (15) percent (seasonally adjusted) reported unfilled job openings, up 3 points, suggesting that the unemployment rate could ease a fraction or remain unchanged. Over the next three months, 11 percent plan to increase employment (up 1 point), and 12 percent plan to reduce their workforce (up 1 point), yielding a seasonally adjusted 5 percent of owners planning to create new jobs, a 3 point gain over July. Welcome positive changes, but still leaving the two indicators at recession levels. CAPITAL SPENDING The frequency of reported capital outlays over the past 6 point months rose 2 points to 52 percent of all firms in August, the first improvement in many months. The percent of owners planning capital outlays in the next three to six months rose 1 point to 21 percent, a recession level reading that has typified the recovery to date. Money is available, but most owners are not interested in a loan to finance the purchase of equipment they don’t need. Five percent characterized the current period as a good time to expand facilities (seasonally adjusted), down 1 point and 3 points lower than January. The net percent of owners expecting better business conditions in 6 months was a negative 26 percent, down 11 points from July, and 36 percentage points lower than January. INVENTORIES AND SALES The net percent of owners expecting higher real sales fell 10 points to a net negative 12 percent of all owners (seasonally adjusted), 25 points below January’s reading. This is bad news for hiring and inventory investment. 1 | NFIB Small Business Economic Trends Monthly Report The net percent of all owners (seasonally adjusted) reporting higher nominal sales over the past 3 months lost 1 percentage point, falling to a net negative 9 percent, more firms with sales trending down than up. A net negative 9 percent of all owners reported growth in inventories (seasonally adjusted), a 4 point improvement from July although still more owners are cutting inventory than adding. For all firms, a net 1 percent (up 1 point) reported stocks too low, a very satisfied reading based on survey history. Plans to add to inventories fell 2 points to a net negative 5 percent of all firms (seasonally adjusted), consistent with weak sales expectations and a poor economic outlook. This survey was conducted in August 2011. A sample of 3,938 small-business owners/members was drawn. Nine hundred twenty-six (926) usable responses were received – a response rate of 24 percent.
  • 4. INFLATION Seasonally adjusted, the net percent raising selling prices was 1 percent, down 6 points. The price surge that emerged on Main Street a few months ago has dissipated, taking the pressure off of the inflation measures. The continued weakness in sales trends has blunted small business’s ability to raise prices after two years of price cutting to liquidate excess inventories. Nineteen (19) percent plan on raising average prices in the next few months, 5 percent plan reductions. Seasonally adjusted, a net 16 percent plan price hikes, down 3 points. EARNINGS AND WAGES Reports of positive earnings trends were 2 points worse at a net negative 26 percent of all owners, not a pretty picture, but still one of the best readings in 43 months. With price hikes fading, compensation costs rising and sales trends still negative, there is little opportunity to improve the bottom line. Of those reporting negative sales trends, 45 percent blamed faltering sales, 5 percent higher labor costs, 15 percent higher materials costs, 3 percent insurance costs, 8 percent lower selling prices and 10 percent higher taxes and regulatory costs. Compensation costs are rising, but not at a rapid rate. Five percent reported reduced worker compensation and 15 percent reported gains yielding a seasonally adjusted net 9 percent reporting higher worker compensation, a 1 point decline. A seasonally adjusted 7 percent plan to raise compensation in the coming months, up a point from July. CREDIT MARKETS Four percent reported financing as their #1 business problem. So, for the overwhelming majority, “credit supply” is not a problem. Ninety-three (93) percent reported that all their credit needs were met or that they were not interested in borrowing. Seven percent reported that not all of their credit needs were satisfied (the record low is 4 percent), and 50 percent said they did not want a loan (15 percent did not answer the question, presumably also uninterested in borrowing). Twenty-five percent of the owners 2 | NFIB Small Business Economic Trends Monthly Report reported that weak sales continued to be their top business problem so new investments in new equipment or new workers are not likely to “pay off” by generating enough additional earnings to repay the loan required to finance the investment. Four percent of owners reported higher interest rates on their most recent loan, while 3 percent reported getting a lower rate. Thirty-two (32) percent of all owners reported borrowing on a regular basis, up 2 points and only 4 points above the record low. A net 13 percent reported loans “harder to get” compared to their last attempt (asked of regular borrowers only), up 3 points.
  • 5. COMMENTARY The August survey was mailed out as Congress and the Administration reached their “deal” to curb spending and reduce the debt/deficit problems. Had this been a convincing one to “Main Street,” confidence would have improved and, likely, also spending and hiring. But, NFIB’s confidence measure took a dive as did the University of Michigan’s consumer confidence Index which produced its lowest reading since 1980. In particular, it was expected real sales gains and expected business conditions in 6 months that plummeted in the NFIB report. These two components by themselves lowered the Index 2.1 points versus the total loss from all 10 components of 1.8 points. With such a dim outlook, owners are not going to do a lot of hiring or expanding. Business expansion, the purchase of new equipment and vehicles and even hiring are “long term” investments. Most important to the decision process is the sales forecast, but against expected sales over the life of an asset, the owner must figure in labor costs, taxes, the cost of new regulations, financing costs and the like to decide whether or not an “investment” will pay off. This is one reason why “short term” stimuli don’t work. The planning horizon for the private sector is longer than the time to the next election!!! At this point, no one knows what their tax rate will be 6 months from now; no one knows what the health care will do to labor costs. Higher for sure, but by how much? Yes, the President suspended costly EPA rules that were going into effect, but you know that they will be back after the election if he wins The NLRB is pushing the union agenda, card check, mandating owners to post notices of the right to unionize, interfering with Boeing’s business decision making (and the President’s Chief of Staff was on Boeing’s board when the South Carolina project was approved). Supporters of the Administration are pushing for another hike in the minimum wage and the new CEA chairman favors and wants a national sales tax to be imposed. It would take a book to itemize it all. Short-term fixes will not help, private sector decision makers think longer term – they do and they don’t like what they see, there is little clarity or certainty. Consumer spending is still 3 | NFIB Small Business Economic Trends Monthly Report a key factor and 9 of 10 people who want a job still have a job and would spend more if they were more confident about the future.
  • 6. OVERVIEW - SMALL BUSINESS OPTIMISM OPTIMISM INDEX Based on Ten Survey Indicators (Seasonally Adjusted 1986=100) 110 Index Value (1986=100) 100 90 80 86 88 YEAR OPTIMISM INDEX Based on Ten Survey Indicators (Seasonally Adjusted 1986=100) Jan Feb Mar Apr May Jun Jul Aug Sep Oct Nov Dec 2006 101.1 101.5 98.0 100.1 98.5 96.7 98.1 95.9 99.4 100.7 99.7 96.5 2007 98.9 98.2 97.3 96.8 97.2 96.0 97.6 96.3 97.3 96.2 94.4 94.6 2008 91.8 92.9 89.6 91.5 89.3 89.2 88.2 91.1 92.9 87.5 87.8 85.2 2009 84.1 82.6 81.0 86.8 88.9 87.9 86.5 88.6 88.8 89.1 88.3 88.0 2010 89.3 88.0 86.8 90.6 92.2 89.0 88.1 88.8 89.0 91.7 93.2 92.6 2011 94.1 94.5 91.9 91.2 90.9 90.8 89.9 88.1 SMALL BUSINESS OUTLOOK OUTLOOK 4 | NFIB Small Business Economic Trends Monthly Report Good Time to Expand and Expected General Business Conditions January 1986 to August 2011 (Seasonally Adjusted) 30 80 Percent "Better" Minus "Worse" Business Conditions (thin line) Percent "Good Time to Expand" 60 Expected General 20 40 (thick line) 20 10 0 -20 0 -40 86 88 90 92 94 96 98 00 02 04 06 08 10 YEAR
  • 7. SMALL BUSINESS OUTLOOK (CONTINUED) OUTLOOK FOR EXPANSION Percent Next Three Months “Good Time to Expand” (Seasonally Adjusted) Jan Feb Mar Apr May Jun Jul Aug Sep Oct Nov Dec 2006 20 20 19 18 18 13 16 13 18 20 17 17 2007 17 18 12 12 12 13 16 12 14 14 13 14 2008 9 8 5 6 4 4 6 6 11 5 7 7 2009 6 3 1 4 5 4 5 5 9 7 8 7 2010 5 4 2 4 5 6 5 4 6 7 9 8 2011 8 7 5 4 5 4 6 5 MOST IMPORTANT REASON FOR EXPANSION OUTLOOK Reason Percent by Expansion Outlook August 2011 Reason Good Time Not Good Time Uncertain Economic Conditions 1 53 13 Sales Prospects 1 3 2 Fin. & Interest Rates 2 2 0 Cost of Expansion 0 3 1 Political Climate 0 10 4 Other/Not Available 0 1 1 OUTLOOK FOR GENERAL BUSINESS CONDITIONS 5 | NFIB Small Business Economic Trends Monthly Report Net Percent (“Better” Minus “Worse”) Six Months From Now (Seasonally Adjusted) Jan Feb Mar Apr May Jun Jul Aug Sep Oct Nov Dec 2006 6 3 -5 -3 -10 -8 -6 -8 2 11 11 -4 2007 -1 -2 -7 -8 -3 -5 -1 0 2 -2 -10 -10 2008 -22 -9 -23 -12 -12 -19 -17 4 14 -4 -2 -13 2009 -12 -21 -22 2 12 7 -3 10 8 11 3 2 2010 1 -9 -8 0 8 -6 -15 -8 -3 8 16 9 2011 10 9 -5 -8 -5 -11 -15 -26
  • 8. SMALL BUSINESS EARNINGS EARNINGS Actual Last Three Months January 1986 to August 2011 (Seasonally Adjusted) 0 -10 Net Percent -20 -30 -40 -50 86 88 90 92 94 96 98 00 02 04 06 08 10 YEAR ACTUAL EARNINGS CHANGES Net Percent (“Higher” Minus “Lower”) Last Three Months Compared to Prior Three Months (Seasonally Adjusted) Jan Feb Mar Apr May Jun Jul Aug Sep Oct Nov Dec 2006 -16 -15 -12 -13 -11 -11 -16 -19 -8 -14 -18 -15 2007 -21 -19 -15 -19 -15 -18 -17 -22 -20 -18 -25 -20 2008 -27 -25 -33 -28 -28 -33 -37 -30 -35 -35 -38 -42 2009 -47 -44 -46 -43 -43 -42 -45 -40 -40 -40 -43 -43 2010 -42 -39 -43 -31 -28 -32 -33 -30 -33 -26 -30 -34 2011 -28 -27 -32 -26 -24 -24 -24 -26 MOST IMPORTANT REASON FOR LOWER EARNINGS 6 | NFIB Small Business Economic Trends Monthly Report Percent Reason August 2011 Current Month One Year Ago Two Years Ago Sales Volume 18 22 31 Increased Costs* 11 10 8 Cut Selling Prices 3 4 6 Usual Seasonal Change 3 3 2 Other 5 3 3 * Increased costs include labor, materials, finance, taxes, and regulatory costs.
  • 9. SMALL BUSINESS SALES SALES Actual (Prior Three Months) and Expected (Next Three Months) January 1986 to August 2011 (Seasonally Adjusted) 50 40 30 20 Net Percent 10 0 -10 -20 Expected -30 Actual -40 86 88 90 92 94 96 98 00 02 04 06 08 10 YEAR ACTUAL SALES CHANGES Net Percent (“Higher” Minus “Lower”) Last Three Months Compared to Prior Three Months (Seasonally Adjusted) Jan Feb Mar Apr May Jun Jul Aug Sep Oct Nov Dec 2006 2 6 5 6 11 6 3 2 5 2 0 3 2007 -3 -1 0 4 1 -4 -1 -4 -4 -4 -3 1 2008 -7 -8 -11 -9 -11 -12 -15 -10 -11 -21 -25 -29 2009 -31 -28 -34 -28 -33 -34 -34 -27 -26 -31 -31 -25 2010 -26 -26 -25 -15 -11 -15 -16 -16 -17 -13 -15 -16 2011 -11 -11 -12 -5 -9 -7 -8 -9 SALES EXPECTATIONS 7 | NFIB Small Business Economic Trends Monthly Report Net Percent (“Higher” Minus “Lower”) During Next Three Months (Seasonally Adjusted) Jan Feb Mar Apr May Jun Jul Aug Sep Oct Nov Dec 2006 24 28 12 21 20 13 18 10 17 17 21 18 2007 22 17 14 14 16 11 14 13 14 13 8 6 2008 4 0 -3 -3 -11 -11 -9 -6 -2 -16 -14 -18 2009 -20 -29 -31 -11 -5 -10 -11 -5 -6 -4 -2 -1 2010 3 0 -3 6 5 -5 -4 0 -3 1 6 8 2011 13 14 6 5 3 0 -2 -12
  • 10. SMALL BUSINESS PRICES PRICES Actual Last Three Months and Planned Next Three Months January 1986 to August 2011 (Seasonally Adjusted) 40 30 Net Percent of Firms 20 10 0 -10 Planned -20 Actual -30 86 88 90 92 94 96 98 00 02 04 06 08 10 YEAR ACTUAL PRICE CHANGES Net Percent (“Higher” Minus “Lower”) Compared to Three Months Ago (Seasonally Adjusted) Jan Feb Mar Apr May Jun Jul Aug Sep Oct Nov Dec 2006 18 23 17 26 24 23 23 22 20 16 17 8 2007 12 13 15 18 16 19 19 13 9 15 14 16 2008 8 13 18 20 23 29 32 26 20 15 0 -6 2009 -15 -24 -23 -24 -22 -17 -19 -19 -21 -17 -17 -22 2010 -18 -21 -20 -11 -15 -13 -11 -8 -11 -5 -4 -5 2011 -4 5 9 12 15 10 7 1 PRICE PLANS 8 | NFIB Small Business Economic Trends Monthly Report Net Percent (“Higher” Minus “Lower”) in the Next Three Months (Seasonally Adjusted) Jan Feb Mar Apr May Jun Jul Aug Sep Oct Nov Dec 2006 29 27 26 28 30 29 30 29 22 21 22 26 2007 24 23 22 24 23 21 23 22 21 22 26 26 2008 26 22 29 31 32 36 38 30 24 18 11 3 2009 2 1 0 1 3 5 5 8 6 5 4 3 2010 8 10 9 13 14 11 10 10 7 12 13 15 2011 19 21 24 24 23 15 19 16
  • 11. SMALL BUSINESS EMPLOYMENT ACTUAL EMPLOYMENT CHANGES Net Percent (“Increase” Minus “Decrease”) in the Last Three Months (Seasonally Adjusted) Jan Feb Mar Apr May Jun Jul Aug Sep Oct Nov Dec 2006 1 4 -1 -3 -3 -2 2 5 -3 5 0 3 2007 2 4 -6 -5 -2 0 1 4 -1 3 0 2 2008 0 -3 -7 -9 -10 -12 -5 -4 -10 -9 -10 -18 2009 -15 -15 -22 -25 -24 -23 -17 -16 -16 -12 -12 -12 2010 -10 -9 -11 -12 -12 -10 -5 -2 -3 -6 -2 -1 2011 -4 -2 -4 -6 -3 -7 -2 -2 QUALIFIED APPLICANTS FOR JOB OPENINGS Percent Few or No Qualified Applicants (Seasonally Adjusted) Jan Feb Mar Apr May Jun Jul Aug Sep Oct Nov Dec 2006 40 40 39 41 46 45 42 46 44 46 44 40 2007 41 41 43 43 42 45 43 44 48 46 40 37 2008 37 36 36 37 33 39 36 35 38 35 31 30 2009 * * 24 24 25 27 26 23 25 25 28 21 2010 24 26 23 26 26 25 28 32 30 28 27 28 2011 28 30 29 32 30 33 31 33 EMPLOYMENT 9 | NFIB Small Business Economic Trends Monthly Report Planned Next Three Months and Current Job Openings January 1986 to August 2011 (Seasonally Adjusted) 40 30 Percent 20 10 Planned 0 Job Openings -10 86 88 90 92 94 96 98 00 02 04 06 08 10 YEAR
  • 12. SMALL BUSINESS EMPLOYMENT (CONTINUED) JOB OPENINGS Percent With Positions Not Able to Fill Right Now (Seasonally Adjusted) Jan Feb Mar Apr May Jun Jul Aug Sep Oct Nov Dec 2006 26 26 23 31 25 25 24 25 25 27 22 19 2007 26 25 26 26 24 26 23 25 25 22 19 21 2008 24 20 19 21 15 21 17 15 18 14 14 14 2009 11 11 10 9 9 11 9 8 8 8 8 10 2010 10 11 9 11 9 9 10 11 11 10 9 13 2011 13 15 15 14 12 15 12 15 HIRING PLANS Net Percent (“Increase” Minus “Decrease”) in the Next Three Months (Seasonally Adjusted) Jan Feb Mar Apr May Jun Jul Aug Sep Oct Nov Dec 2006 17 16 9 16 14 9 15 17 17 16 19 10 2007 17 13 12 13 13 12 13 15 14 11 11 11 2008 9 11 3 5 2 5 5 9 7 0 -4 -6 2009 -6 -3 -10 -5 -5 -1 -3 0 -4 -1 -3 -2 2010 -1 -1 -2 -1 1 1 2 1 -3 1 4 6 2011 3 5 2 2 -1 3 2 5 SMALL BUSINESS COMPENSATION 10 | NFIB Small Business Economic Trends Monthly Report COMPENSATION Actual Last Three Months and Planned Next Three Months January 1986 to August 2011 (Seasonally Adjusted) 40 35 30 25 Net Percent 20 15 10 Planned Higher 5 Actual Higher 0 -5 86 88 90 92 94 96 98 00 02 04 06 08 10 YEAR
  • 13. SMALL BUSINESS COMPENSATION (CONTINUED) ACTUAL COMPENSATION CHANGES Net Percent (“Increase” Minus “Decrease”) During Last Three Months (Seasonally Adjusted) Jan Feb Mar Apr May Jun Jul Aug Sep Oct Nov Dec 2006 25 24 22 27 24 22 24 25 28 23 25 21 2007 26 30 28 26 29 26 27 24 27 26 21 24 2008 25 23 24 20 15 20 18 18 17 15 13 9 2009 7 1 0 0 0 -2 1 1 3 0 0 3 2010 1 -2 0 3 2 4 3 3 3 4 8 8 2011 10 8 7 9 9 8 10 9 COMPENSATION PLANS Net Percent (“Increase” Minus “Decrease”) in the Next Three Months (Seasonally Adjusted) Jan Feb Mar Apr May Jun Jul Aug Sep Oct Nov Dec 2006 16 20 16 19 15 14 17 16 16 18 20 17 2007 16 19 19 18 16 15 16 14 19 16 15 14 2008 12 12 15 14 8 12 12 11 10 9 10 4 2009 3 3 0 2 1 3 4 3 3 5 1 1 2010 1 6 3 5 4 3 5 6 3 5 5 3 2011 5 7 9 7 7 7 6 7 PRICES AND LABOR COMPENSATION 11 | NFIB Small Business Economic Trends Monthly Report Net Percent Increase and Net Percent Compensation (Seasonally Adjusted) 40 30 20 10 0 -10 Actual Prices -20 Actual Compensation -30 86 88 90 92 94 96 98 00 02 04 06 08 10 YEAR
  • 14. SMALL BUSINESS CREDIT CONDITIONS CREDIT CONDITIONS Loan Availability Compared to Three Months Ago* January 1986 to August 2011 2 0 -2 Net Percent of Firms -4 -6 -8 -10 -12 -14 -16 -18 86 88 90 92 94 96 98 00 02 04 06 08 10 YEAR * For the population borrowing at least once every three months. REGULAR BORROWERS Percent Borrowing at Least Once Every Three Months (Seasonally Adjusted) Jan Feb Mar Apr May Jun Jul Aug Sep Oct Nov Dec 2006 37 38 36 40 38 41 38 46 35 37 38 35 2007 37 39 35 37 38 35 36 35 36 36 32 34 2008 36 34 33 36 35 35 34 34 32 33 31 33 2009 35 36 33 33 34 30 33 32 33 33 33 33 2010 32 34 35 31 32 29 32 31 33 31 28 30 2011 31 31 29 32 29 29 30 32 AVAILABILITY OF LOANS 12 | NFIB Small Business Economic Trends Monthly Report Net Percent (“Easier” Minus “Harder”) Compared to Three Months Ago (Regular Borrowers) Jan Feb Mar Apr May Jun Jul Aug Sep Oct Nov Dec 2006 -5 -5 -6 -4 -5 -5 -6 -8 -3 -6 -6 -6 2007 -5 -5 -7 -5 -6 -5 -5 -7 -9 -6 -7 -7 2008 -7 -5 -7 -9 -8 -7 -9 -10 -11 -9 -11 -12 2009 -13 -13 -12 -14 -16 -14 -15 -14 -14 -14 -15 -15 2010 -14 -12 -15 -14 -13 -13 -13 -12 -14 -11 -11 -12 2011 -10 -11 -8 -9 -10 -9 -10 -13
  • 15. SMALL BUSINESS CREDIT CONDITIONS (CONTINUED) BORROWING NEEDS SATISFIED Percent of All Businesses Last Three Months Satisfied/ Percent of All Businesses Last Three Months Not Satisfied (All Borrowers) Jan Feb Mar Apr May Jun Jul Aug Sep Oct Nov Dec 2006 36/4 37/6 36/6 38/5 38/5 39/5 38/4 44/4 34/4 36/7 34/4 36/5 2007 36/5 40/5 35/5 38/4 39/6 36/4 37/5 35/4 37/5 36/6 32/4 32/7 2008 34/5 35/4 32/6 34/5 34/7 35/5 32/7 35/6 33/6 31/6 31/7 32/6 2009 33/8 32/8 29/10 30/8 28/9 30/10 28/10 30/7 30/10 29/9 29/10 28/8 2010 27/11 29/9 29/11 28/9 28/8 25/10 27/9 27/9 27/9 26/9 25/9 28/9 2011 28/8 29/8 28/7 28/8 28/8 25/9 28/8 28/7 EXPECTED CREDIT CONDITIONS Net Percent (“Easier” Minus “Harder”) During Next Three Months (Regular Borrowers) Jan Feb Mar Apr May Jun Jul Aug Sep Oct Nov Dec 2006 -6 -7 -7 -8 -8 -8 -7 -9 -5 -6 -5 -7 2007 -7 -8 -8 -7 -6 -6 -6 -9 -10 -8 -8 -10 2008 -9 -8 -9 -11 -10 -10 -12 -11 -13 -16 -13 -15 2009 -14 -16 -14 -12 -15 -13 -14 -13 -15 -16 -15 -15 2010 -13 -14 -16 -15 -12 -13 -14 -14 -14 -12 -10 -11 2011 -10 -10 -9 -13 -11 -10 -11 -13 INTEREST RATES 13 | NFIB Small Business Economic Trends Monthly Report Relative Rates and Actual Rates Last Three Months January 1986 to August 2011 40 13 Rate Relative (thin line) Avg. Short-term Rate (thick 20 11 0 9 line) 7 -20 5 -40 86 88 90 92 94 96 98 00 02 04 06 08 10 YEAR
  • 16. SMALL BUSINESS CREDIT CONDITIONS (CONTINUED) RELATIVE INTEREST RATE PAID BY REGULAR BORROWERS Net Percent (“Higher” Minus “Lower”) Compared to Three Months Ago Jan Feb Mar Apr May Jun Jul Aug Sep Oct Nov Dec 2006 26 32 29 32 28 30 30 34 22 20 23 16 2007 17 21 19 16 15 12 12 14 15 4 3 1 2008 0 -9 -5 -12 -15 -11 -4 -2 -3 -2 -6 -8 2009 -12 -9 -1 -2 0 0 3 3 5 3 8 3 2010 6 6 9 5 4 0 2 3 1 1 0 1 2011 3 6 5 5 3 0 0 1 Borrowing at Least Once Every Three Months. ACTUAL INTEREST RATE PAID ON SHORT-TERM LOANS BY BORROWERS Average Interest Rate Paid Jan Feb Mar Apr May Jun Jul Aug Sep Oct Nov Dec 2006 8.1 8.3 8.0 8.7 8.1 8.7 9.1 9.0 8.8 8.8 8.3 9.8 2007 9.1 9.3 9.3 9.2 9.5 9.3 9.2 8.7 9.0 9.1 8.5 8.5 2008 8.3 8.1 8.3 7.7 6.9 7.1 7.0 6.9 7.1 6.6 7.0 6.6 2009 6.4 6.2 6.2 6.1 6.3 6.5 6.5 6.1 6.1 6.0 5.9 6.3 2010 6.3 6.0 6.8 6.4 6.5 6.0 6.3 6.3 6.2 6.0 5.7 6.2 2011 6.0 6.0 5.9 6.5 6.0 6.0 5.9 6.1 SMALL BUSINESS INVENTORIES 14 | NFIB Small Business Economic Trends Monthly Report INVENTORIES Actual (Last Three Months) and Planned (Next Three Months) January 1986 to August 2011 (Seasonally Adjusted) 15 10 5 0 Net Percent -5 -10 -15 -20 Actual -25 Planned -30 86 88 90 92 94 96 98 00 02 04 06 08 10 YEAR
  • 17. SMALL BUSINESS INVENTORIES (CONTINUED) ACTUAL INVENTORY CHANGES Net Percent (“Increase” Minus “Decrease”) During Last Three Months (Seasonally Adjusted) Jan Feb Mar Apr May Jun Jul Aug Sep Oct Nov Dec 2006 3 1 6 0 -2 0 0 3 1 0 0 -3 2007 1 5 2 -2 2 -5 -2 -3 -2 -1 -6 -3 2008 -4 -2 -7 -10 -12 -11 -14 -13 -12 -13 -17 -21 2009 -18 -19 -23 -27 -27 -27 -27 -24 -24 -26 -25 -28 2010 -21 -18 -18 -18 -20 -21 -19 -15 -14 -16 -15 -13 2011 -10 -8 -7 -9 -13 -14 -13 -9 INVENTORY SATISFACTION Net Percent (“Too Low” Minus “Too Large”) at Present Time (Seasonally Adjusted) Jan Feb Mar Apr May Jun Jul Aug Sep Oct Nov Dec 2006 -1 -2 0 -1 -1 -1 -2 -6 -6 -3 -6 -7 2007 -2 -2 -5 -3 -6 -7 -2 -2 -3 -7 -3 -3 2008 -4 -4 -1 -1 -3 -1 -4 -3 -1 -4 -4 -7 2009 -6 -5 -4 -5 -2 -5 -4 -4 0 -3 -2 -4 2010 -1 -1 -1 1 0 -1 0 -1 -2 1 -3 -3 2011 0 2 -1 1 -1 -1 0 1 15 | NFIB Small Business Economic Trends Monthly Report INVENTORY PLANS Net Percent (“Increase” Minus “Decrease”) in the Next Three to Six Months (Seasonally Adjusted) Jan Feb Mar Apr May Jun Jul Aug Sep Oct Nov Dec 2006 5 7 3 2 3 0 1 -1 -1 4 0 0 2007 2 3 3 3 0 -3 2 -4 0 1 2 -3 2008 -4 -2 -2 -1 -4 -5 -4 -9 -3 -5 -6 -4 2009 -10 -10 -13 -7 -3 -6 -5 -7 -6 -3 -3 -8 2010 -4 -7 -7 -2 2 -3 -4 -7 -3 -4 0 -3 2011 -1 -2 1 -1 -3 -3 -3 -5
  • 18. SMALL BUSINESS CAPITAL OUTLAYS INVENTORY SATISFACTION AND INVENTORY PLANS Net Percent (“Too Low” Minus “Too Large”) at Present Time Net Percent Planning to Add Inventories in the Next Three to Six Months (Seasonally Adjusted) 15 10 5 0 Percent -5 -10 Inventory Plans Inventory Satisfaction -15 86 88 90 92 94 96 98 00 02 04 06 08 10 YEAR CAPITAL EXPENDITURES Actual Last Six Months and Planned Next Three Months January 1986 to August 2011 (Seasonally Adjusted) 75 Actual Planned 65 55 Percent 45 35 25 15 86 88 90 92 94 96 98 00 02 04 06 08 10 YEAR ACTUAL CAPITAL EXPENDITURES 16 | NFIB Small Business Economic Trends Monthly Report Percent Making a Capital Expenditure During the Last Six Months Jan Feb Mar Apr May Jun Jul Aug Sep Oct Nov Dec 2006 62 63 62 62 62 60 61 62 63 62 63 61 2007 62 61 61 60 60 55 58 58 60 61 56 62 2008 58 58 57 56 54 52 52 54 52 54 56 51 2009 51 52 50 46 46 46 46 45 44 45 44 44 2010 47 47 45 46 46 46 45 44 45 47 51 47 2011 51 49 51 50 50 50 50 52
  • 19. SMALL BUSINESS CAPITAL OUTLAYS (CONTINUED) TYPE OF CAPITAL EXPENDITURES MADE Percent Purchasing or Leasing During Last Six Months Type Current One Year Ago Two Years Ago Vehicles 20 14 13 Equipment 36 29 31 Furniture or Fixtures 10 7 8 Add. Bldgs. or Land 5 2 4 Improved Bldgs. or Land 13 11 11 AMOUNT OF CAPITAL EXPENDITURES MADE Percent Distribution of Per Firm Expenditures During the Last Six Months Amount Current One Year Ago Two Years Ago $1 to $999 4 4 3 $1,000 to $4,999 10 8 8 $5,000 to $9,999 6 6 5 $10,000 to $49,999 16 14 16 $50,000 to $99,999 7 4 6 $100,000 + 8 7 7 No Answer 1 1 0 17 | NFIB Small Business Economic Trends Monthly Report CAPITAL EXPENDITURE PLANS Percent Planning a Capital Expenditure During Next Three to Six Months (Seasonally Adjusted) Jan Feb Mar Apr May Jun Jul Aug Sep Oct Nov Dec 2006 32 35 31 33 28 27 31 28 30 31 31 26 2007 30 30 33 29 29 28 27 27 29 27 27 30 2008 25 26 25 26 25 26 21 23 21 19 21 17 2009 19 18 16 19 20 17 18 16 18 17 16 18 2010 20 20 19 19 20 19 18 16 19 18 20 21 2011 22 22 24 21 20 21 20 21
  • 20. SINGLE MOST IMPORTANT PROBLEM SINGLE MOST IMPORTANT PROBLEM August 2011 One Survey Survey Problem Current Year Ago High Low Taxes 18 21 32 8 Inflation 6 3 41 0 Poor Sales 25 31 34 2 Fin. & Interest Rates 4 4 37 1 Cost of Labor 3 4 9 2 Govt. Reqs. & Red Tape 19 15 27 4 Comp. From Large Bus. 5 5 14 4 Quality of Labor 4 5 24 3 Cost/Avail. of Insurance 8 8 29 4 Other 8 4 31 1 SELECTED SINGLE MOST IMPORTANT PROBLEM Inflation, Big Business, Insurance and Regulation January 1986 to August 2011 40 Big Business Insurance Inflation Regulation 30 Percent of Firms 20 10 0 86 88 90 92 94 96 98 00 02 04 06 08 10 YEAR 18 | NFIB Small Business Economic Trends Monthly Report SELECTED SINGLE MOST IMPORTANT PROBLEM Taxes, Interest Rates, Sales and Labor Quality January 1986 to August 2011 40 Taxes Sales Interest Rates & Finance Labor Quality 30 Percent of Firms 20 10 0 86 88 90 92 94 96 98 00 02 04 06 08 10 YEAR
  • 21. SURVEY PROFILE OWNER/MEMBERS PARTICIPATING IN ECONOMIC SURVEY NFIB Actual Number of Firms Jan Feb Mar Apr May Jun Jul Aug Sep Oct Nov Dec 2006 1274 484 471 1094 440 416 1007 480 380 1075 451 446 2007 1755 750 737 1703 618 589 1613 720 674 1614 719 670 2008 1845 700 735 1768 737 703 1827 812 743 1992 826 805 2009 2013 846 867 1794 814 758 1994 882 827 2059 825 830 2010 2114 799 948 2176 823 804 2029 874 849 1910 807 804 2011 2144 774 811 1985 733 766 1817 926 NFIB OWNER/MEMBERS PARTICIPATING IN ECONOMIC SURVEY Industry of Small Business 30 25 20 Percent 15 10 5 0 NFIB OWNER/MEMBERS PARTICIPATING 19 | NFIB Small Business Economic Trends Monthly Report IN ECONOMIC SURVEY Number of Full and Part-Time Employees 30 25 20 Percent 15 10 5 0
  • 22. NFIB RESEARCH FOUNDATION SMALL BUSINESS ECONOMIC SURVEY SMALL BUSINESS SURVEY QUESTIONS PAGE IN REPORT Do you think the next three months will be a good time for small business to expand substantially? Why? . . . . . . . . . . . . . . . 4 About the economy in general, do you think that six months from now general business conditions will be better than they are now, about the same, or worse? . . . . . . . . . . . . 5 Were your net earnings or “income” (after taxes) from your business during the last calendar quarter higher, lower, or about the same as they were for the quarter before?. . . . . . . . . . . . . 6 If higher or lower, what is the most important reason?. . . . . . . . . . . . 6 During the last calendar quarter, was your dollar sales volume higher, lower, or about the same as it was for the quarter before?. . . . . . . . . . . . . . . . . . . . . . . . . . . . . . . . . . . . 7 Overall, what do you expect to happen to real volume (number of units) of goods and/or services that you will sell during the next three months?. . . . . . . . . . . . . . . . . . . . . . . . . 7 How are your average selling prices compared to three months ago?. . . . . . . . . . . . . . . . . . . . . . . . . . . . . . . . . . . . 8 In the next three months, do you plan to change the average selling prices of your goods and/or services? . . . . . . . . . . . . 8 During the last three months, did the total number of employees in your firm increase, decrease, or stay about the same?. . . . . . . . . . 9 If you have filled or attempted to fill any job openings 20 | NFIB Small Business Economic Trends Quarterly Report in the past three months, how many qualified applicants were there for the position(s)?. . . . . . . . . . . . . . . . . . . . . . . . . . . . 9 Do you have any job openings that you are not able to fill right now?. . . . . . . . . . . . . . . . . . . . . . . . . . . . . . . . . . . . . 10 In the next three months, do you expect to increase or decrease the total number of people working for you? . . . . . . . . . . . 10 Over the past three months, did you change the average employee compensation?. . . . . . . . . . . . . . . . . . . . . . . . . . . . . . . 11 Do you plan to change average employee compensation during the next three months?. . . . . . . . . . . . . . . . . . . . . . . . . . . 11
  • 23. SMALL BUSINESS SURVEY QUESTIONS PAGE IN REPORT Are…loans easier or harder to get than they were three months ago? . . . . . . . . . . . . . . . . . . . . . . . . . . . . . . . . . . . . . .. . . . . . . . .12 During the last three months, was your firm able to satisfy its borrowing needs?. . . . . . . . . . . . . . . . . . . . . . . . . . . . . . . . . . . . . . .13 Do you expect to find it easier or harder to obtain your required financing during the next three months?. . . . . .. . . . . . . . . . . . . . . . .13 If you borrow money regularly (at least once every three months) as part of your business activity, how does the rate of interest payable on your most recent loan compare with that paid three months ago?. . . . . . . . . . . . . . . . . . . . . . . . . . . . . . . . . . . .14 If you borrowed within the last three months for business purposes, and the loan maturity (pay back period) was 1 year or less, what interest rate did you pay? . . . . . . . . . . .. . . . . . . . . . .. . . . .14 During the last three months, did you increase or decrease your inventories?. . . . . . . . . . . . . . . . . . . . . . . . . . . . . . . .. . . . . . . . . . . . . . . . . .15 At the present time, do you feel your inventories are too large, about right, or inadequate?. . . . . . . . . . . . . . . . . . . . . . . . . . . . . . . . . . . .15 Looking ahead to the next three months to six months, do you expect, on balance, to add to your inventories, keep them about the same, or decrease them? . . . . . . . . . . . . . . . . . . . . . . . .15 During the last six months, has your firm made any capital expenditures to improve or purchase equipment, buildings, or land? . . . . . . . . . . . . . . . . . . . . . . . . . . .. . . . . . . . . . . . . . . . . . . . . . . . . . . . . .16 If [your firm made any capital expenditures], what was 21 | NFIB Small Business Economic Trends Monthly Report the total cost of all these projects? . . . . . . . . . . . . . . . . . . . . . . . . . . . . . . . . . .17 Looking ahead to the next three to six months, do you expect to make any capital expenditures for plant and/or physical equipment? . . . . . . . . . . . . . . .. . . . . . . . . . . . . . . . . . . . . . . . .17 What is the single most important problem facing your business today? . . . . . . . . . . . . . . . . . . . . . . . . . . . . . . . . . . . . . . . . . . . . . . . . .18 Please classify your major business activity, using one of the categories of example below.. . . . . . . . . . . . . . . . . . . . . . . . . . . . . . . . . .19 How many employees do you have full and part-time, including yourself? . . . . . . . . . . . . . . . . . . . . . . . . . . . . . . . . . . . . . . . . . . . . . . .19