
Recomendados
Recomendados
Más contenido relacionado
Similar a Stage 3 of the ProjectReflection Paper FINC 330U.docx
Similar a Stage 3 of the ProjectReflection Paper FINC 330U.docx (20)
Más de whitneyleman54422
Más de whitneyleman54422 (20)
Último
Último (20)
Stage 3 of the ProjectReflection Paper FINC 330U.docx
- 1. Stage 3 of the Project Reflection Paper FINC 330 University of Maryland University College ConAgra Brands Inc. is a company that deals with the manufacture of food. Like any other company, it has its financial report. The reports are not constant every year; they keep on changing each year. This is as a result of various reasons, which may cause an increase or a decrease in the financial income or expenditure. The net sales in the three years are almost constant apart from slight deviations. The cost of goods sold has shown an increment from 2014 to 2015, but in 2016, there was a decline. Regarding selling, general and administrative expenses in 2014 were high, in 2015 it decreased, but in 2016 it rose by 6%.interest expenses remained the same throughout the three years at 3%. Additionally, asset amounts for the company have also stayed roughly the same over the past few years. On the other hand, the liabilities have decreased from 12,827.8 in 2015 to 9,595.8 in 2016. That is a decrease of 3,232 in just one year. Total assets also decreased from 2015 to 2016 with a balance starting at 17,437.8 and ending with a balance of 13,390.6. Equity, along
- 2. with most other aspects of the company, has stayed within close range from year to year with a balance of 4,610 in 2015 and a balance of 3,794.8 in 2016. From the financial statistics we have for the net income, income statement, balance sheet among others, it is evident that the company is not making a notable move. The trend seems to be downwards which means that the company is barely making profits. This could suggest that the company is operating using the same methods. To avoid the problem, it is advisable for them to focus on changing the current business models. RECOMMENDATIONS. For this company to improve its financial stability, the key thing is to initiate change in the way of operation. This is specifically in the business models that have a significant influence on the financial performance of a business. Examine the lines of credit. It is hard for a company to operate without credit. Therefore borrowing funds should be done wisely. There should also be a good plan to repay the borrowed money to avoid instability. Borrowing should also be done when it is very necessary. Review your production and overhead expenses. It is necessary to assess the level of expenses because they determine the level of profits. If the expenses are too much, it is likely that the firm will make little or no profits. Create a cash flow budget helps to compare the income and expenditure of every month. With this, the company can know how to allocate the available funds in the most profitable way. Inform the key employees on the effects of losses in the business. The management should make the employees aware that making losses is one of the worst things in business. This helps them to be careful enough to avoid the same. It is also important to identify the chief customers. The company should ensure that it maintains these customers. To
- 3. add on that, the firm should calculate the loss that can be incurred in case any of them is lost. In conclusion, it is evident that a firm can do a lot to ensure that it has stability. If these recommendations are taken into account, the company will improve greatly regarding its financial performance and stability. Running Head: Financial Research Project 1 Financial Research Project 19 Financial Research Project Student’s Name Institutional Affiliation Background and Industry Campbell Soup Company is also known as Campbell’s. The company is based in the United States. It is involved in the
- 4. canning of soup and other related products. The company deals with provision of soups, snacks and beverages. Most of its income however comes from the sale of soup. The company has currently managed to sell its products in over 120 countries. The company is in the food processing industry. The company has been operations since 1869. Common Size Analysis Campbell Soup Income Statement (Values in Millions) Period Ending: 7/31/2016 8/2/2015 8/3/2014 Total Revenue $7,961,000 100% $8,082,000 100% $8,268,000 100% Cost of Revenue $5,181,000 65% $5,300,000 66% $5,297,000 64% Gross Profit $2,780,000 35% $2,782,000 34%
- 5. $2,971,000 36% Operating Expenses Research and Development $124,000 2% $117,000 1% $122,000 1% Sales, General and Admin. $1,665,000 21% $1,509,000 19% $1,527,000 18% Non-Recurring Items $31,000 0% $102,000 1% $55,000 1% Other Operating Items $0 0% $0 0% $0
- 6. 0% Operating Income $960,000 12% $1,054,000 13% $1,267,000 15% Add'l income/expense items $4,000 0% $3,000 0% $3,000 0% Earnings Before Interest and Tax $964,000 12% $1,057,000 13% $1,270,000 15% Interest Expense $115,000 1% $108,000 1% $122,000 1% Earnings Before Tax $849,000 11% $949,000 12% $1,148,000 14%
- 7. Income Tax $286,000 4% $283,000 4% $374,000 5% Minority Interest $0 0% $0 0% $11,000 0% Equity Earnings/Loss Unconsolidated Subsidiary $0 0% $0 0% $0 0% Net Income-Cont. Operations $563,000 7% $666,000 8% $774,000 9% Net Income $563,000 7% $666,000 8% $866,000 10% Campbell Soup
- 8. Balance Sheet (Values in 000's) Period Ending: 7/31/2016 8/2/2015 8/3/2014 Current Assets Cash and Cash Equivalents $296,000 4% $253,000 3% $232,000 3% Short-Term Investments $0 0% $0 0% $0 0% Net Receivables $626,000 8% $647,000 8% $670,000 8%
- 9. Inventory $940,000 12% $995,000 12% $1,016,000 13% Other Current Assets $46,000 1% $198,000 2% $182,000 2% Total Current Assets $1,908,000 24% $2,093,000 26% $2,100,000 26% Long-Term Assets Long-Term Investments $0 0% $0 0% $0 0% Fixed Assets
- 10. $2,407,000 31% $2,347,000 29% $2,318,000 29% Goodwill $2,263,000 29% $2,344,000 29% $2,433,000 30% Intangible Assets $1,152,000 15% $1,205,000 15% $1,175,000 14% Other Assets $107,000 1% $88,000 1% $87,000 1% Deferred Asset Charges $0 0% $0 0% $0 0% Total Assets $7,837,000
- 11. 100% $8,077,000 100% $8,113,000 100% Current Liabilities Accounts Payable $1,336,000 17% $1,263,000 16% $1,218,000 15% Short-Term Debt / Current Portion of Long-Term Debt $1,219,000 16% $1,543,000 19% $1,771,000 22% Other Current Liabilities $0 0% $0 0% $0 0% Total Current Liabilities $2,555,000 33%
- 12. $2,806,000 35% $2,989,000 37% Long-Term Debt $2,314,000 30% $2,539,000 31% $2,244,000 28% Other Liabilities $1,039,000 13% $850,000 11% $729,000 9% Deferred Liability Charges $396,000 5% $505,000 6% $548,000 7% Misc. Stocks $0 0% $0 0% $0 0% Minority Interest $8,000 0% ($4,000)
- 13. 0% ($12,000) 0% Total Liabilities $6,312,000 81% $6,696,000 83% $6,498,000 80% Stock Holders’ Equity Common Stocks $12,000 0% $12,000 0% $12,000 0% Capital Surplus $354,000 5% $339,000 4% $330,000 4% Retained Earnings $1,927,000 25% $1,754,000 22%
- 14. $2,198,000 27% Treasury Stock ($664,000) -8% ($556,000) -7% ($356,000) -4% Other Equity ($104,000) -1% ($168,000) -2% ($569,000) -7% Total Equity $1,525,000 19% $1,381,000 17% $1,615,000 20% Total Liabilities & Equity $7,837,000 100% $8,077,000 100% $8,113,000 100% The company has been going through some tough times. This is evidence by the fact that the percentage of the net income since 2014 has been declining. The company had a net income percentage of 10% in 2014, 8% in 2015 and 7% in 2016. The company’s costs of goods sold does not have the same
- 15. percentage changes as the net income. The company’s operating costs have been increasing over the last three years. This evident from the constant decrease of the earnings before interest and tax. It is therefore clear that the company needs to control its costs especially the operating costs in order to maintain its profitability. The balance sheet does not show any issues that raises any concern. The company has maintained small changes in all its accounts. The changes in the percentage value of the accounts changes with a slight one percent change. There are no large changes that can cause concern. The major change in comparison to the rest is the decrease of the retained earnings of the company in 2015 and an increase in 2016 which is a good sign. There percentage of the total liabilities on the three-year period is high. The company has around 80% of its assets being financed by liability (White, Braentner & Towery, 1993). The income statement mainly raises concern on the decrease in the company’s profitability. The company is also being financed too much by debt which can be risky. From the interest expense however, it is clear that the company can comfortably be able to pay off its debt. The company is stable enough and can be able to pay of its debt. The company needs to make its profitability to be stable in positive and not negative growth. Percentage Change Analysis Campbell Soup Income Statement (Values in Millions) Period Ending: 7/31/2016 Percent Increase (Decrease) 8/2/2015 Percent Increase (Decrease) 8/3/2014 Total Revenue $7,961,000 -4%
- 16. $8,082,000 -2% $8,268,000 Cost of Revenue $5,181,000 -2% $5,300,000 0% $5,297,000 Gross Profit $2,780,000 -6% $2,782,000 -6% $2,971,000 Operating Expenses Research and Development $124,000 2% $117,000 -4% $122,000 Sales, General and Admin. $1,665,000 9% $1,509,000 -1% $1,527,000 Non-Recurring Items $31,000 -44%
- 17. $102,000 85% $55,000 Other Operating Items $0 - $0 $0 Operating Income $960,000 -24% $1,054,000 -17% $1,267,000 Add'l income/expense items $4,000 33% $3,000 0% $3,000 Earnings Before Interest and Tax $964,000 -24% $1,057,000 -17% $1,270,000 Interest Expense $115,000 -6% $108,000 -11% $122,000 Earnings Before Tax $849,000 -26%
- 18. $949,000 -17% $1,148,000 Income Tax $286,000 -24% $283,000 -24% $374,000 Minority Interest $0 -100% $0 -100% $11,000 Equity Earnings/Loss Unconsolidated Subsidiary $0 - $0 - $0 Net Income-Cont. Operations $563,000 -27% $666,000 -14% $774,000 Net Income $563,000 -35% $666,000 -23% $866,000 Campbell Soup Balance Sheet (Values in 000's) Period Ending:
- 19. 7/31/2016 Percent Increase (Decrease) 8/2/2015 Percent Increase (Decrease) 8/3/2014 Current Assets Cash and Cash Equivalents $296,000 28% $253,000 9% $232,000 Short-Term Investments $0 - $0 - $0 Net Receivables $626,000 -7% $647,000 -3% $670,000 Inventory $940,000 -7% $995,000 -2% $1,016,000 Other Current Assets $46,000 -75% $198,000 9% $182,000
- 20. Total Current Assets $1,908,000 -9% $2,093,000 0% $2,100,000 Long-Term Assets Long-Term Investments $0 - $0 - $0 Fixed Assets $2,407,000 4% $2,347,000 1% $2,318,000 Goodwill $2,263,000 -7% $2,344,000 -4% $2,433,000 Intangible Assets $1,152,000 -2% $1,205,000 3% $1,175,000
- 21. Other Assets $107,000 23% $88,000 1% $87,000 Deferred Asset Charges $0 - $0 - $0 Total Assets $7,837,000 -3% $8,077,000 0% $8,113,000 Current Liabilities Accounts Payable $1,336,000 10% $1,263,000 4% $1,218,000 Short-Term Debt / Current Portion of Long-Term Debt $1,219,000 -31% $1,543,000 -13% $1,771,000
- 22. Other Current Liabilities $0 - $0 - $0 Total Current Liabilities $2,555,000 -15% $2,806,000 -6% $2,989,000 Long-Term Debt $2,314,000 3% $2,539,000 13% $2,244,000 Other Liabilities $1,039,000 43% $850,000 17% $729,000 Deferred Liability Charges $396,000 -28% $505,000 -8% $548,000 Misc. Stocks $0 $0 - $0
- 23. Minority Interest $8,000 -167% ($4,000) -67% ($12,000) Total Liabilities $6,312,000 -3% $6,696,000 3% $6,498,000 Stock Holders’ Equity Common Stocks $12,000 0% $12,000 0% $12,000 Capital Surplus $354,000 7% $339,000 3% $330,000 Retained Earnings $1,927,000 -12% $1,754,000 -20% $2,198,000
- 24. Treasury Stock ($664,000) 87% ($556,000) 56% ($356,000) Other Equity ($104,000) -82% ($168,000) -70% ($569,000) Total Equity $1,525,000 -6% $1,381,000 -14% $1,615,000 Total Liabilities & Equity $7,837,000 -3% $8,077,000 0% $8,113,000 As 2014 as the base year, the trend that can be seen from the analysis above is a poor one. The company’s sales have reduced over the last two years. In 2015 the decrease was 2% and in 2016 the decrease was 4%. This raises concern that the company’s market share has been reducing over the years. The company need to carry out marketing activities that are meant to increase its revenues. The company has increased some of its expenses and reduced others. The company in 2016 increased its expenditure in research and development. The company increased its
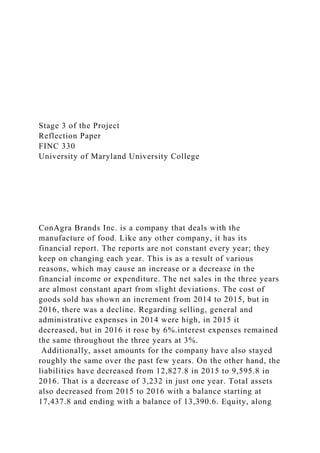
- 25. expenditure on sales, general and administration. The percentage increase is 9% which is worrying. Despite the company reducing its revenues, it accrued a lot of operating expenses and thus there was huge decrease in the company’s operating income in 2016 in comparison to 2014 (White, Braentner & Towery, 1993). The company’s current assets reduced considerably in 2016 in comparison to 2014. The company decreased the amount of short-term debt that it took in 2016 and 2015. The company’s total liabilities however slightly reduced by 3% in 2016 while in 2015 it had increased with the same percentage. The company tried to reduce its debt financing. Equity financing also reduced its more in 2015 and less in 2016. The company’s value of its total assets and the equity and liabilities amount reduced by 3%. Financial Ratio Analysis Financial Ratio Analysis Ratio 2016 2015 2014 Current Ratio 75% 75% 70% Quick Ratio 38% 39% 36% Days Inventory 68.09 69.48 65.97 Receivables Turnover 13.45
- 26. 13.17 12.67 Gross Profit Margin 35% 34% 36% Net Profit Margin 7% 8% 10% ROA 7.07% 8.53% 9.95% ROE 37% 48% 54% In the above ratio analysis, two ratios are used to determine the liquidity of the company. These are the current ratio and quick ratio. The current ratio is the ratio of a company’s current assets to its current liabilities. The quick ratio is the ratio of a company’s most liquid asset which include current assets less inventory to its current liabilities. the ratios are used to show the ability of a company to meets its short-term liabilities using its current assets. The company has low liquidity. This is a problem as the company will have difficulty when paying for its obligations. The company needs to increase the money that it takes from operations and increase its accounts receivable. The company has been able to maintain its liquidity over the last year with small differences between the years. Its quick ratio increased slightly in 2015 but decreased slightly in 2016.
- 27. The profitability ratio that were used in this scenario were the gross margin ratio and net margin. The gross profit margin ratio is a ratio of gross profit to revenues. The net margin ratio is a ratio of net income to total revenues. The company’s gross margin decreased slightly in 2015 and increased in 2016. The company’s net margin ratio has however been decreasing since 2014. The difference between the ratios is a clear sign that the company accrues too much operating costs and its operating costs have been increasing over the last 3 years. The company’s profitability has reduced which is a sign that the company should reduce its expenses and increase its revenues for it to increase its growth (Bodie, 2013). The days inventory turnover shows the period of time it takes for the company’s inventory to be sold. The company takes around 60 days to sell its inventory. This is a long time which the company has to maintain its inventory. this leaves chances of loss of inventory due to storage. The receivables turnover ratio is used to determine the ability of a company in managing its account receivables. The company receives its account receivable about 13 times per year. This means that the company collects accounts receivable in less than a month. The company however needs to improve in order to improve its liquidity. Return on Assets (ROA), is a ratio of net income to total assets. Return on Equity (ROE), is the ratio of net income to total equity. The returns on investment has been reducing over the last three years. The company needs to improve on its net earnings through increasing its revenues and reducing its expenses. An increase in its net earnings will in turn increase the return on the investment made by the company. the company needs to generate more earnings from the assets that it as (Bodie, 2013).
- 28. In order to improve the company’s Cash Conversion Cycle (CCC), the company needs to convince their suppliers to increase the period of time within which the company is expected to meet its obligations. These would increase the time that accounts payable are settled. The management would also need to reduce the period of time that the customers takes to pay the company. this can be done by giving the customers incentive such as discounts for them to pay within a shorter period of time. The company would also need to send invoices to the customers within a short period of time (Lewis, 2017). The company would also need to improve its efficiency. The company should improve its efficiency in the billing and invoicing process. These will contribute to faster time for the company to receive the cash that is owed to it. The company also needs to manage its inventory. The company should manage its inventory such as it does not keep too much inventory. inventory ties up capital for a long period of time. Return on Equity ROE = Net profit margin x Total assets turnover x Equity multiplier 2016 Net profit Margin = 7% Total Asset Turnover = 1.02 Equity Multiplier = 5.14 = 7% * 1.02 * 5.14 =36.70% 2015 Net profit Margin = 8% Total Asset Turnover = 1.00 Equity Multiplier = 5.85 = 8% * 1.00 * 5.85
- 29. = 46.8% 2014 Net profit Margin = 10% Total Asset Turnover = 1.02 Equity Multiplier = 5.02 = 10% * 1.02 * 5.02 = 51.20% DuPont Analysis is of the view that the return on equity is affected by three aspects. The first is the net margin, the second is the asset turnover ratio which in this we use the total asset turnover and the third is the equity multiplier. The company’s return on assets has been deteriorating over the three years. The company’s net margin can be seen to be the most troubled aspect of the company. In 2014, the net margin was 10% and yet by 2016 the company had a net margin ratio of 7%. The company’s operations need to improve. The company’s net margin has been decreasing over the last three years. The company needs to work on its operations (Wahlen, Baginski & Bradshaw, 2014). The company can work on its operations by increasing its revenues through carrying out more marketing in order for the product to reach more of their customers. The company also needs to reduce its expenses. In this case, the company should try to increase its operating activities. By reducing the expenses and increasing the revenues, the company will achieve better net margin ratio. References Bodie, Z. (2013). Investments. McGraw-Hill. Lewis, J., (2017). How Can a Company Shorten Its Cash Cycle? Hearst Newspapers, LLC. Wahlen, J., Baginski, S., & Bradshaw, M. (2014). Financial reporting, financial statement analysis and valuation. Nelson Education.
- 30. White, B., Braentner, L., & Towery, E. (1993). Financial Statement Analysis. New York: Wiley. _1558262554.xls Chart12014201465.9712.670.360.10.09950.542015201569.4813. 170.340.080.08530.482016201668.0913.450.350.070.07070.37 Current Ratio Quick Ratio Days Inventory Receivables Turnover Gross Profit Margin Net Profit Margin ROA ROE Financial Ratios 0.7 0.36 0.75 0.39 0.75 0.38 Sheet1CampBell SoupIncome Statement (Values in Millions)Period Ending:7/31/168/2/158/3/14Total Revenue$7,961,000100%$8,082,000100%$8,268,000100%Cost of Revenue$5,181,00065%$5,300,00066%$5,297,00064%Gross Profit$2,780,00035%$2,782,00034%$2,971,00036%Operating ExpensesResearch and Development$124,0002%$117,0001%$122,0001%Sales, General and Admin.$1,665,00021%$1,509,00019%$1,527,00018%Non- Recurring Items$31,0000%$102,0001%$55,0001%Other Operating Items$00%$00%$00%Operating Income$960,00012%$1,054,00013%$1,267,00015%Add'l income/expense items$4,0000%$3,0000%$3,0000%Earnings Before Interest and Tax$964,00012%$1,057,00013%$1,270,00015%Interest Expense$115,0001%$108,0001%$122,0001%Earnings Before Tax$849,00011%$949,00012%$1,148,00014%Income
- 31. Tax$286,0004%$283,0004%$374,0005%Minority Interest$00%$00%$11,0000%Equity Earnings/Loss Unconsolidated Subsidiary$00%$00%$00%Net Income-Cont. Operations$563,0007%$666,0008%$774,0009%Net Income$563,0007%$666,0008%$866,00010% Sheet2CampBell SoupBalance Sheet (Values in 000's)Period Ending:7/31/168/2/158/3/14Current AssetsCash and Cash Equivalents$296,0004%$253,0003%$232,0003%Short-Term Investments$00%$00%$00%Net Receivables$626,0008%$647,0008%$670,0008%Inventory$940, 00012%$995,00012%$1,016,00013%Other Current Assets$46,0001%$198,0002%$182,0002%Total Current Assets$1,908,00024%$2,093,00026%$2,100,00026%Long-Term AssetsLong-Term Investments$00%$00%$00%Fixed Assets$2,407,00031%$2,347,00029%$2,318,00029%Goodwill$2 ,263,00029%$2,344,00029%$2,433,00030%Intangible Assets$1,152,00015%$1,205,00015%$1,175,00014%Other Assets$107,0001%$88,0001%$87,0001%Deferred Asset Charges$00%$00%$00%Total Assets$7,837,000100%$8,077,000100%$8,113,000100%Current LiabilitiesAccounts Payable$1,336,00017%$1,263,00016%$1,218,00015%Short- Term Debt / Current Portion of Long-Term Debt$1,219,00016%$1,543,00019%$1,771,00022%Other Current Liabilities$00%$00%$00%Total Current Liabilities$2,555,00033%$2,806,00035%$2,989,00037%Long- Term Debt$2,314,00030%$2,539,00031%$2,244,00028%Other Liabilities$1,039,00013%$850,00011%$729,0009%Deferred Liability Charges$396,0005%$505,0006%$548,0007%Misc. Stocks$00%$00%$00%Minority Interest$8,0000%($4,000)- 0%($12,000)-0%Total Liabilities$6,312,00081%$6,696,00083%$6,498,00080%Stock Holders EquityCommon Stocks$12,0000%$12,0000%$12,0000%Capital Surplus$354,0005%$339,0004%$330,0004%Retained Earnings$1,927,00025%$1,754,00022%$2,198,00027%Treasury
- 32. Stock($664,000)-8%($556,000)-7%($356,000)-4%Other Equity($104,000)-1%($168,000)-2%($569,000)-7%Total Equity$1,525,00019%$1,381,00017%$1,615,00020%Total Liabilities & Equity$7,837,000100%$8,077,000100%$8,113,000100% Sheet3CampBell SoupIncome Statement (Values in Millions)Period Ending:7/31/16Percent Increase (Decrease)8/2/15Percent Increase (Decrease)8/3/14Total Revenue$7,961,000-4%$8,082,000-2%$8,268,000Cost of Revenue$5,181,000-2%$5,300,0000.06%$5,297,000Gross Profit$2,780,000-6%$2,782,000-6%$2,971,000Operating ExpensesResearch and Development$124,0002%$117,000- 4%$122,000Sales, General and Admin.$1,665,0009%$1,509,000-1%$1,527,000Non-Recurring Items$31,000-44%$102,00085%$55,000Other Operating Items$0-$0$0Operating Income$960,000-24%$1,054,000- 17%$1,267,000Add'l income/expense items$4,00033%$3,0000%$3,000Earnings Before Interest and Tax$964,000-24%$1,057,000-17%$1,270,000Interest Expense$115,000-6%$108,000-11%$122,000Earnings Before Tax$849,000-26%$949,000-17%$1,148,000Income Tax$286,000-24%$283,000-24%$374,000Minority Interest$0- 100%$0-100%$11,000Equity Earnings/Loss Unconsolidated Subsidiary$0-$0-$0Net Income-Cont. Operations$563,000- 27%$666,000-14%$774,000Net Income$563,000-35%$666,000- 23%$866,000 Sheet4CampBell SoupBalance Sheet (Values in 000's)Period Ending:7/31/16Percent Increase (Decrease)8/2/15Percent Increase (Decrease)8/3/14Current AssetsCash and Cash Equivalents$296,00028%$253,0009%$232,000Short-Term Investments$0-$0-$0Net Receivables$626,000-7%$647,000- 3%$670,000Inventory$940,000-7%$995,000- 2%$1,016,000Other Current Assets$46,000- 75%$198,0009%$182,000Total Current Assets$1,908,000- 9%$2,093,000-0.3%$2,100,000Long-Term AssetsLong-Term Investments$0-$0-$0Fixed
- 33. Assets$2,407,0004%$2,347,0001%$2,318,000Goodwill$2,263,0 00-7%$2,344,000-4%$2,433,000Intangible Assets$1,152,000- 2%$1,205,0003%$1,175,000Other Assets$107,00023%$88,0001%$87,000Deferred Asset Charges$0-$0-$0Total Assets$7,837,000-3%$8,077,000- 0%$8,113,000Current LiabilitiesAccounts Payable$1,336,00010%$1,263,0004%$1,218,000Short-Term Debt / Current Portion of Long-Term Debt$1,219,000- 31%$1,543,000-13%$1,771,000Other Current Liabilities$0-$0- $0Total Current Liabilities$2,555,000-15%$2,806,000- 6%$2,989,000Long-Term Debt$2,314,0003%$2,539,00013%$2,244,000Other Liabilities$1,039,00043%$850,00017%$729,000Deferred Liability Charges$396,000-28%$505,000-8%$548,000Misc. Stocks$0$0-$0Minority Interest$8,000-167%($4,000)- 67%($12,000)Total Liabilities$6,312,000- 3%$6,696,0003%$6,498,000Stock Holders EquityCommon Stocks$12,0000%$12,0000%$12,000Capital Surplus$354,0007%$339,0003%$330,000Retained Earnings$1,927,000-12%$1,754,000-20%$2,198,000Treasury Stock($664,000)87%($556,000)56%($356,000)Other Equity($104,000)-82%($168,000)-70%($569,000)Total Equity$1,525,000-6%$1,381,000-14%$1,615,000Total Liabilities & Equity$7,837,000-3%$8,077,000-0%$8,113,000 Sheet5Financial Ratio AnalysisRatio201620152014Current Ratio75%75%70%Quick Ratio38%39%36%Days Inventory68.0969.4865.97Receivables Turnover13.4513.1712.67Gross Profit Margin35%34%36%Net Profit Margin7%8%10%ROA7.07%8.53%9.95%ROE37%48%54%Curr ent RatioQuick RatioDays InventoryReceivables TurnoverGross Profit MarginNet Profit MarginROAROE201470%36%65.9712.6736%10%9.95%54%201 575%39%69.4813.1734%8%8.53%48%201675%38%68.0913.45 35%7%7.07%37% Sheet5
- 34. Current Ratio Quick Ratio Days Inventory Receivables Turnover Gross Profit Margin Net Profit Margin ROA ROE Financial Ratios Project Stage 4 Ball Corp, BLL FINC 330 6380 June 24, 2017
- 35. Bond Performance Name Maturity date Amount $ Mil Price Coupon % Yield to Maturity Ball 4.375% 12/15/2020 1,000.0 104.0 4.375 3.18 Ball 5.25% 5/1/2025 1,000.0 108.0
- 36. 5.250 4.08 Assuming that par value is $1,000 Last prices of bonds were: ($1000/100) x 104 = $1040.00 ($1000/100) x 108 = $1080.00 Annual coupon interest payments: $1000 x 4.375% = $43.75 $1000 x 5.250% = $52.50 Current yield of bonds: 43.75/104=0.42=42% 52.50/108=0.4861=48.61% Assuming semi-annual coupon payments, annual YTM of bonds: Assuming interest rates are expected to remain at their current level, prices of bonds … Assuming bonds can be called back in one year from today at 105% facevalue, yield to call: Financial Leverage Ratios 2016 2015 2014 Debt ratio Debt to Equity ratio 2.13
- 37. 4.04 2.90 Interest coverage ratio 1.55 3.41 5.04 Write about 1page of the analysis of the ratio results. In your analysis you should answer the following questions. Please explain your answer to each question. How is THE COMPANY financing it's assets? Is it too risky to buy bonds of THE COMPANY? Stock Performance 2016 2015 2014 Earnings per share .81 .99 1.65 Dividends .26 .26 .26 Book value per share 10.62 3.66 4.43 BLL Industry Average
- 38. Price/Earnings 28.9 26.0 Price/ Cash flow 10.6 13.2 b) Write about 1 page of analysis of the market ratio results that you found. Compare the market ratio results against the industry or main competitor. In your report please answer the question: Are the common stockholders receiving an adequate return on their investment? Historical Stock Prices Question 3(a) Market ratios - The complete list of market ratios is in the Homework 1F. The same ratios are in Review for week 1 and in Self-Assessments for week 1 homework 1F. Question 3(d): Historical 52-weeks return shows the past performance of a stock. This return can be used to predict future returns. However historical return is not necessary to be kept in future. Future performance of the stock should be estimated using current and future situation in the company and in the market. CAPM shows theoretical return in accordance with the riskiness of the stock measured by beta. If return calculated using CAPM was higher than what it was calculated using actual 52-weeks data, the company received less return than expected in accordance with the riskiness of stock. This stock is called overvalued. You don’t want to buy
- 39. overvalued stocks! If return calculated using CAPM was lower than what was originally calculated using actual 52-weeks data, the company received higher return than expected in accordance with the riskiness of stock. This stock is called undervalued. Investors are looking for undervalued stocks. Again, historical 52-weeks data should be adjusted in both cases for the future forecast of the performance of the company. We are using 10.5% market return in this part of the project. Actually it should be estimated using performance of S&P500 or any other broad market indexes. This is another reason for the difference between historical return and CAPM required return in this discussion. How to find bonds on www.morningstar.com Step 1: Log on www.morningstar.com website and type the stock symbol in the window Quote on the top of the screen. (See Screenshot 1 attached). If your website looks differently, click on “Go to the Old Morningstar Website” in the very upper right corner of the window. Morningstar is currently working on a new version of the website. Step 2: Click on Bonds (see screenshot #2). It will take 20-30 seconds for the web page to appear. After you got into the web page, scroll all the way down. You will see the list of bonds. Please let me know if something does not work. I checked each company before the semester started, all the companies assigned for the project in this class have bonds listed on this website. All three ratios that are required for the Bonds part of the project can be found on Morningstar website. Debt/Equity and Debt/total assets are listed on the Bonds page. Debt/total assets is called here as Debt/Assets ratio. Interest Coverage ratio is listed on Key Ratios page. Please see attached screenshots.