Xu hướng Digital marketing 2016 -2017 - 2018 - bản đầy đủ nhất Thế giới
YouTube metrics for 2016
1. 1 YEAR- BY THE NUMBERS
A look at YouTube highlights from
Jan. 1, 2016 – Jan. 3, 2017
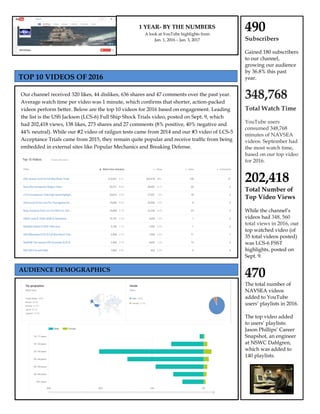
TOP 10 VIDEOS OF 2016
490
Subscribers
Gained 180 subscribers
to our channel,
growing our audience
by 36.8% this past
year.
348,768
Total Watch Time
YouTube users
consumed 348,768
minutes of NAVSEA
videos. September had
the most watch time,
based on our top video
for 2016.
202,418
Total Number of
Top Video Views
While the channel’s
videos had 348, 560
total views in 2016, our
top watched video (of
35 total videos posted)
was LCS-6 FSST
highlights, posted on
Sept. 9.
470
The total number of
NAVSEA videos
added to YouTube
users’ playlists in 2016.
The top video added
to users’ playlists:
Jason Phillips’ Career
Snapshot, an engineer
at NSWC Dahlgren,
which was added to
140 playlists.
AUDIENCE DEMOGRAPHICS
Our channel received 320 likes, 44 dislikes, 636 shares and 47 comments over the past year.
Average watch time per video was 1 minute, which confirms that shorter, action-packed
videos perform better. Below are the top 10 videos for 2016 based on engagement. Leading
the list is the USS Jackson (LCS-6) Full Ship Shock Trials video, posted on Sept. 9, which
had 202,418 views, 138 likes, 273 shares and 27 comments (8% positive, 40% negative and
44% neutral). While our #2 video of railgun tests came from 2014 and our #3 video of LCS-5
Acceptance Trials came from 2015, they remain quite popular and receive traffic from being
embedded in external sites like Popular Mechanics and Breaking Defense.