
Recomendados
Más contenido relacionado
La actualidad más candente
La actualidad más candente (16)
Similar a 2103
Similar a 2103 (20)
Más de yo9889
Último
Último (20)
2103
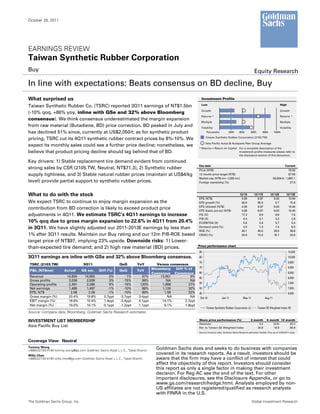
- 1. October 26, 2011 EARNINGS REVIEW Taiwan Synthetic Rubber Corporation Buy Equity Research In line with expectations: Beats consensus on BD decline, Buy What surprised us Investment Profile Low High Taiwan Synthetic Rubber Co. (TSRC) reported 3Q11 earnings of NT$1.5bn Growth Growth (-10% qoq, +86% yoy, inline with GSe and 32% above Bloomberg Returns * Returns * consensus). We think consensus underestimated the margin expansion Multiple Multiple from raw material (Butadiene, BD) price correction. BD peaked in July and Volatility Volatility has declined 51% since, currently at US$2,050/t; as for synthetic product Percentile 20th 40th 60th 80th 100th Taiwan Synthetic Rubber Corporation (2103.TW) pricing, TSRC cut its 4Q11 synthetic rubber contract prices by 8%-10%. We Asia Pacific Autos & Autoparts Peer Group Average expect its monthly sales could see a further price decline; nonetheless, we * Returns = Return on Capital For a complete description of the believe that product pricing decline should lag behind that of BD. investment profile measures please refer to the disclosure section of this document. Key drivers: 1) Stable replacement tire demand evident from continued Key data Current strong sales by CSR (2105.TW, Neutral, NT$71.3), 2) Synthetic rubber Price (NT$) 79.50 supply tightness, and 3) Stable natural rubber prices (maintain at US$4/kg 12 month price target (NT$) 97.00 Market cap (NT$ mn / US$ mn) 56,834.6 / 1,887.1 level) provide partial support to synthetic rubber prices. Foreign ownership (%) 27.0 What to do with the stock 12/10 12/11E 12/12E 12/13E EPS (NT$) 4.59 8.97 9.03 10.44 We expect TSRC to continue to enjoy margin expansion as the EPS growth (%) 40.6 95.5 0.7 15.6 EPS (diluted) (NT$) 4.59 8.97 9.03 10.44 contribution from BD correction is likely to exceed product price EPS (basic pre-ex) (NT$) 4.59 8.97 9.03 10.44 adjustments in 4Q11. We estimate TSRC’s 4Q11 earnings to increase P/E (X) 17.3 8.9 8.8 7.6 P/B (X) 4.4 3.7 3.3 2.8 10% qoq due to gross margin expansion to 22.6% in 4Q11 from 20.4% EV/EBITDA (X) 5.6 5.6 5.7 5.4 in 3Q11. We have slightly adjusted our 2011-2013E earnings by less than Dividend yield (%) 4.0 7.3 7.4 8.5 ROE (%) 26.1 45.5 39.5 39.8 1% after 3Q11 results. Maintain our Buy rating and our 12m P/B-ROE based CROCI (%) 20.8 15.5 16.1 20.6 target price of NT$97, implying 23% upside. Downside risks: 1) Lower- Price performance chart than-expected tire demand; and 2) high raw material (BD) prices. 85 10,500 3Q11 earnings are inline with GSe and 32% above Bloomberg consensus. 80 10,000 75 9,500 TSRC (2103.TW) 3Q11 QoQ YoY Versus consensus Bloomberg Diff % of 70 9,000 P&L (NT$mn) Actual GS est. Diff (%) QoQ YoY Consensus Consensus 65 8,500 Revenue 14,855 14,855 0% 1% 67% 13,951 6% 60 8,000 Gross profits 3,036 2,939 3% -15% 99% NA NA Operating profits 2,491 2,280 9% -16% 120% 1,968 27% 55 7,500 Net earnings 1,485 1,497 -1% -10% 86% 1,126 32% 50 7,000 EPS, NT$ 2.08 2.09 -1% -10% 86% 1.58 32% 45 6,500 Gross margin (%) 20.4% 19.8% 0.7ppt -3.7ppt 3.4ppt NA NA Oct-10 Jan-11 May-11 Aug-11 EBIT margin (%) 16.8% 15.4% 1.4ppt -3.4ppt 4.1ppt 14.1% 2.7ppt Net margin (%) 10.0% 10.1% -0.1ppt -1.2ppt 1.1ppt 8.1% 1.9ppt Taiwan Synthetic Rubber Corporation (L) Taiwan SE Weighted Index (R) Source: Company data, Bloomberg, Goldman Sachs Research estimates INVESTMENT LIST MEMBERSHIP Share price performance (%) 3 month 6 month 12 month Absolute 4.2 (0.5) 53.2 Asia Pacific Buy List Rel. to Taiwan SE Weighted Index 20.8 18.9 69.8 Source: Company data, Goldman Sachs Research estimates, FactSet. Price as of 10/25/2011 close. Coverage View: Neutral Tommy Wong Goldman Sachs does and seeks to do business with companies +886(2)2730-4194 tommy.wong@gs.com Goldman Sachs (Asia) L.L.C., Taipei Branch Willy Chen covered in its research reports. As a result, investors should be +886(2)2730-4183 willy.chen@gs.com Goldman Sachs (Asia) L.L.C., Taipei Branch aware that the firm may have a conflict of interest that could affect the objectivity of this report. Investors should consider this report as only a single factor in making their investment decision. For Reg AC see the end of the text. For other important disclosures, see the Disclosure Appendix, or go to www.gs.com/research/hedge.html. Analysts employed by non- US affiliates are not registered/qualified as research analysts with FINRA in the U.S. The Goldman Sachs Group, Inc. Global Investment Research
- 2. October 26, 2011 Taiwan Synthetic Rubber Corporation (2103.TW) Taiwan Synthetic Rubber Corporation: Summary Financials Profit model (NT$ mn) 12/10 12/11E 12/12E 12/13E Balance sheet (NT$ mn) 12/10 12/11E 12/12E 12/13E Total revenue 36,685.7 56,260.6 54,012.6 57,475.6 Cash & equivalents 4,096.4 804.4 3,080.9 4,910.2 Cost of goods sold (30,100.2) (43,111.0) (41,640.7) (44,722.9) Accounts receivable 5,186.4 6,936.2 6,659.1 7,086.0 SG&A (1,385.4) (1,856.6) (1,620.4) (1,724.3) Inventory 3,675.7 5,241.7 4,934.1 5,296.6 R&D (169.2) (281.3) (270.1) (287.4) Other current assets 780.7 780.7 780.7 780.7 Other operating profit/(expense) 0.0 0.0 0.0 0.0 Total current assets 13,739.2 13,763.1 15,454.8 18,073.6 EBITDA 5,746.9 11,606.6 11,191.9 11,526.3 Net PP&E 6,987.4 12,826.9 12,512.4 11,777.2 Depreciation & amortization (715.9) (594.9) (710.4) (785.3) Net intangibles 410.6 410.6 410.6 410.6 EBIT 5,031.0 11,011.7 10,481.5 10,741.0 Total investments 1,855.1 1,855.1 1,855.1 1,855.1 Interest income 17.6 30.0 30.3 30.1 Other long-term assets 2,089.9 2,298.9 2,528.8 2,781.7 Interest expense (164.4) (255.5) (334.3) (360.5) Total assets 25,082.3 31,154.6 32,761.8 34,898.1 Income/(loss) from uncons. subs. 248.1 200.0 250.0 700.0 Others 122.5 350.0 248.1 0.0 Accounts payable 1,877.3 2,912.1 3,364.1 3,611.3 Pretax profits 5,254.8 11,336.1 10,675.6 11,110.6 Short-term debt 4,513.7 8,013.7 9,013.7 9,513.7 Income tax (1,166.0) (2,323.9) (2,085.1) (1,769.8) Other current liabilities 1,495.8 3,389.0 3,418.0 4,072.3 Minorities (809.6) (2,600.0) (2,133.7) (1,877.4) Total current liabilities 7,886.8 14,314.8 15,795.8 17,197.4 Long-term debt 1,037.4 1,037.4 1,037.4 1,037.4 Net income pre-preferred dividends 3,279.2 6,412.2 6,456.8 7,463.4 Other long-term liabilities 990.3 990.3 990.3 990.3 Preferred dividends 0.0 0.0 0.0 0.0 Total long-term liabilities 2,027.6 2,027.6 2,027.6 2,027.6 Net income (pre-exceptionals) 3,279.2 6,412.2 6,456.8 7,463.4 Total liabilities 9,914.4 16,342.5 17,823.5 19,225.0 Post-tax exceptionals 0.0 0.0 0.0 0.0 Net income 3,279.2 6,412.2 6,456.8 7,463.4 Preferred shares 0.0 0.0 0.0 0.0 Total common equity 12,958.7 15,202.9 17,462.8 20,075.0 EPS (basic, pre-except) (NT$) 4.59 8.97 9.03 10.44 Minority interest 2,209.2 (390.8) (2,524.5) (4,401.9) EPS (basic, post-except) (NT$) 4.59 8.97 9.03 10.44 EPS (diluted, post-except) (NT$) 4.59 8.97 9.03 10.44 Total liabilities & equity 25,082.3 31,154.6 32,761.8 34,898.1 DPS (NT$) 3.18 5.83 5.87 6.79 Dividend payout ratio (%) 69.4 65.0 65.0 65.0 BVPS (NT$) 18.13 21.27 24.43 28.08 Free cash flow yield (%) 10.0 (7.9) 9.6 9.7 Growth & margins (%) 12/10 12/11E 12/12E 12/13E Ratios 12/10 12/11E 12/12E 12/13E Sales growth 65.9 53.4 (4.0) 6.4 CROCI (%) 20.8 15.5 16.1 20.6 EBITDA growth 31.5 102.0 (3.6) 3.0 ROE (%) 26.1 45.5 39.5 39.8 EBIT growth 35.6 118.9 (4.8) 2.5 ROA (%) 13.8 22.8 20.2 22.1 Net income growth 40.6 95.5 0.7 15.6 ROACE (%) 24.8 46.3 39.3 44.5 EPS growth 40.6 95.5 0.7 15.6 Inventory days 51.2 37.7 44.6 41.7 Gross margin 18.0 23.4 22.9 22.2 Receivables days 43.4 39.3 45.9 43.6 EBITDA margin 15.7 20.6 20.7 20.1 Payable days 21.3 20.3 27.5 28.5 EBIT margin 13.7 19.6 19.4 18.7 Net debt/equity (%) 9.6 55.7 46.7 36.0 Interest cover - EBIT (X) 34.3 48.8 34.5 32.5 Cash flow statement (NT$ mn) 12/10 12/11E 12/12E 12/13E Valuation 12/10 12/11E 12/12E 12/13E Net income pre-preferred dividends 3,279.2 6,412.2 6,456.8 7,463.4 D&A add-back 715.9 594.9 710.4 785.3 P/E (analyst) (X) 17.3 8.9 8.8 7.6 Minorities interests add-back (809.6) (2,600.0) (2,133.7) (1,877.4) P/B (X) 4.4 3.7 3.3 2.8 Net (inc)/dec working capital (1,688.8) (2,281.0) 1,036.9 (542.3) EV/EBITDA (X) 5.6 5.6 5.7 5.4 Other operating cash flow 1,920.2 (209.0) (229.9) (252.9) EV/GCI (X) 1.4 2.0 2.0 1.9 Cash flow from operations 3,416.8 1,917.1 5,840.4 5,576.1 Dividend yield (%) 4.0 7.3 7.4 8.5 Capital expenditures (332.8) (6,434.4) (396.0) (50.0) Acquisitions (327.6) 0.0 0.0 0.0 Divestitures 0.0 0.0 0.0 0.0 Others 1,515.6 0.0 0.0 0.0 Cash flow from investments 855.2 (6,434.4) (396.0) (50.0) Dividends paid (common & pref) (2,079.7) (2,274.7) (4,167.9) (4,196.9) Inc/(dec) in debt 343.6 3,500.0 1,000.0 500.0 Common stock issuance (repurchase) 0.0 0.0 0.0 0.0 Other financing cash flows (289.2) 0.0 0.0 0.0 Cash flow from financing (2,025.3) 1,225.3 (3,167.9) (3,696.9) Total cash flow 2,246.7 (3,291.9) 2,276.5 1,829.2 Note: Last actual year may include reported and estimated data. Source: Company data, Goldman Sachs Research estimates. Analyst Contributors Tommy Wong tommy.wong@gs.com Willy Chen willy.chen@gs.com Goldman Sachs Global Investment Research 2
- 3. October 26, 2011 Taiwan Synthetic Rubber Corporation (2103.TW) Exhibit 1: Butadiene spot prices declined by 51% since Exhibit 2: Natural rubber (Singapore RSS3 grade) prices the peak in June and are currently at US$2,050/t. maintain stable at US$4/kg level. 4,500 Butadiene spot price (US$/tonne) 7.00 4,000 Natural rubber (US$/kg) 6.00 3,500 5.00 -51% from peak 3,000 4.00 2,500 3.00 2,000 2.00 1,500 1.00 Jan-10 May-10 Sep-10 Jan-11 May-11 Sep-11 - Jan-08 Aug-08 Mar-09 Oct-09 May-10 Dec-10 Jul-11 Source: TEJ, Goldman Sachs Research. Source: TEJ, Goldman Sachs Research. Exhibit 3: SBR spot prices also experienced 10% revisions Exhibit 4: Current SBR cash spreads are up 197% versus from the peak in August, 2011. the average in 1Q11. 5,500 2,500 SBR spot price (US$/tonne) SBR spread (US$/tonne) 5,000 2,000 4,500 -10% from peak +197% versus 1Q11 avg. 4,000 1,500 3,500 1,000 3,000 2,500 500 2,000 Jan-10 May-10 Sep-10 Jan-11 May-11 Sep-11 - Jan-10 May-10 Sep-10 Jan-11 May-11 Sep-11 Source: TEJ, Goldman Sachs Research. Source: TEJ, Goldman Sachs Research estimates. Goldman Sachs Global Investment Research 3
- 4. October 26, 2011 Taiwan Synthetic Rubber Corporation (2103.TW) Reg AC I, Tommy Wong, hereby certify that all of the views expressed in this report accurately reflect my personal views about the subject company or companies and its or their securities. I also certify that no part of my compensation was, is or will be, directly or indirectly, related to the specific recommendations or views expressed in this report. Investment Profile The Goldman Sachs Investment Profile provides investment context for a security by comparing key attributes of that security to its peer group and market. The four key attributes depicted are: growth, returns, multiple and volatility. Growth, returns and multiple are indexed based on composites of several methodologies to determine the stocks percentile ranking within the region's coverage universe. The precise calculation of each metric may vary depending on the fiscal year, industry and region but the standard approach is as follows: Growth is a composite of next year's estimate over current year's estimate, e.g. EPS, EBITDA, Revenue. Return is a year one prospective aggregate of various return on capital measures, e.g. CROCI, ROACE, and ROE. Multiple is a composite of one-year forward valuation ratios, e.g. P/E, dividend yield, EV/FCF, EV/EBITDA, EV/DACF, Price/Book. Volatility is measured as trailing twelve-month volatility adjusted for dividends. Quantum Quantum is Goldman Sachs' proprietary database providing access to detailed financial statement histories, forecasts and ratios. It can be used for in-depth analysis of a single company, or to make comparisons between companies in different sectors and markets. GS SUSTAIN GS SUSTAIN is a global investment strategy aimed at long-term, long-only performance with a low turnover of ideas. The GS SUSTAIN focus list includes leaders our analysis shows to be well positioned to deliver long term outperformance through sustained competitive advantage and superior returns on capital relative to their global industry peers. Leaders are identified based on quantifiable analysis of three aspects of corporate performance: cash return on cash invested, industry positioning and management quality (the effectiveness of companies' management of the environmental, social and governance issues facing their industry). Disclosure Appendix Coverage group(s) of stocks by primary analyst(s) Tommy Wong: Asia Commodities Companies, Asia Pacific Autos & Auto Parts, Asia Pacific Chemicals, Asia Pacific Energy. Asia Commodities Companies: ACC, Aluminum Corporation of China (A), Aluminum Corporation of China (H), Ambuja Cements, Angang Steel (A), Angang Steel (H), Anhui Conch Cement (A), Anhui Conch Cement (H), Asia Cement, Asia Cement China Holdings, Banpu Public Company, Baoshan Iron & Steel, BBMG Corporation, BBMG Corporation (A), Borneo Lumbung Energi and Metal Tbk PT, Bumi Resources, China Coal Energy (A), China Coal Energy (H), China Molybdenum Co., China National Building Material, China Shenhua Energy (A), China Shenhua Energy (H), China Steel (GDR), China Steel Corporation, Coal India Ltd., Grasim Industries, Harum Energy Tbk PT, Hidili Industry International Development, Hindalco Industries, Hindustan Zinc, India Cements, Jiangxi Copper (A), Jiangxi Copper (H), Korea Zinc, Maanshan Iron & Steel (A), Maanshan Iron & Steel (H), Mongolian Mining Corp., National Aluminium Company, PT Adaro Energy Tbk, PT Indo Tambangraya Megah, PT Tambang Batubara Bukit Asam, Sakari Resources, Shougang Fushan Resources Group, Sterlite Industries (India), Taiwan Cement, Tangshan Jidong Cement Co, TCC International Holdings, Ultratech Cement, Winsway Coking Coal Holdings, Wuhan Iron and Steel, Yanzhou Coal Mining (A), Yanzhou Coal Mining (H). Asia Pacific Autos & Auto Parts: Apollo Tyres, Ashok Leyland, Bajaj Auto, Bharat Forge, Bosch India, Cheng Shin Rubber, Exide Industries, Glovis, Hankook Tire, Hero MotoCorp, Hyundai Mobis, Hyundai Motor, Kia Motors, Mahindra & Mahindra, Mando, Maruti Suzuki India, MRF, Taiwan Synthetic Rubber Corporation, Tata Motors, TVS Motors. Asia Pacific Chemicals: Cheil Industries, Far Eastern New Century Corp., Formosa Chemicals & Fibre, Formosa Plastics, Hanwha Chemical, Honam Petrochemical, KCC Corp, Korea Kumho Petrochemical, KP Chemical, LG Chem, Nan Ya Plastics, Petronas Chemicals Group Berhad, PTT Chemical, Taiwan Fertilizer, Tata Chemicals, United Phosphorus. Asia Pacific Energy: Bharat Petroleum, Cairn India Ltd., China Oilfield Services (A), China Oilfield Services (H), China Petroleum & Chemical (A), China Petroleum and Chemical (ADS), China Petroleum and Chemical (H), CNOOC, CNOOC (ADR), Formosa Petrochemical Corp., Gas Authority of India, GS Holdings, Gujarat State Petronet, Hindustan Petroleum, Indian Oil Corp., OCI Company, Oil & Natural Gas Corp., Oil India, PetroChina (A), PetroChina (ADR), PetroChina (H), Petronet LNG, PTT Aromatics & Refining, PTT Public Company, PTTEP, Reliance Industries, Reliance Industries (GDR), S-Oil Corp., SK Innovation, Thai Oil. Goldman Sachs Global Investment Research 4
- 5. October 26, 2011 Taiwan Synthetic Rubber Corporation (2103.TW) Company-specific regulatory disclosures The following disclosures relate to relationships between The Goldman Sachs Group, Inc. (with its affiliates, "Goldman Sachs") and companies covered by the Global Investment Research Division of Goldman Sachs and referred to in this research. There are no company-specific disclosures for: Taiwan Synthetic Rubber Corporation (NT$79.50) Distribution of ratings/investment banking relationships Goldman Sachs Investment Research global coverage universe Rating Distribution Investment Banking Relationships Buy Hold Sell Buy Hold Sell Global 31% 55% 14% 50% 43% 36% As of October 1, 2011, Goldman Sachs Global Investment Research had investment ratings on 3,198 equity securities. Goldman Sachs assigns stocks as Buys and Sells on various regional Investment Lists; stocks not so assigned are deemed Neutral. Such assignments equate to Buy, Hold and Sell for the purposes of the above disclosure required by NASD/NYSE rules. See 'Ratings, Coverage groups and views and related definitions' below. Price target and rating history chart(s) Taiw an Synthetic Rubber Corporation (2103.TW) Stock Price Currency : Taiw an Dollar Goldman Sachs rating and stock price target history 120 10,000 49.09 53.64 93 100 45.46 9,000 80 8,000 60 7,000 40 95.46 6,000 63.64 98.18 52.73 20 73.64 102.73 5,000 0 4,000 Jan 18 Apr 10 Stock Price Index Price NA B B N D J F MA M J J A S O N D J F MA MJ J A S O N D J F MA M J J A S 2008 2009 2010 2011 Source: Goldman Sachs Investment Research for ratings and price targets; FactSet closing prices as of 9/30/2011. Rating Covered by Tommy Wong, Feb 10, 2011 to N from B Price target as of Jan 18, 2010 Price target at removal Not covered by current analyst Taiw an SE Weighted Index The price targets show n should be considered in the context of all prior published Goldman Sachs research, w hich may or may not have included price targets, as w ell as developments relating to the company, its industry and f inancial markets. Regulatory disclosures Disclosures required by United States laws and regulations See company-specific regulatory disclosures above for any of the following disclosures required as to companies referred to in this report: manager or co-manager in a pending transaction; 1% or other ownership; compensation for certain services; types of client relationships; managed/co- managed public offerings in prior periods; directorships; for equity securities, market making and/or specialist role. Goldman Sachs usually makes a market in fixed income securities of issuers discussed in this report and usually deals as a principal in these securities. The following are additional required disclosures: Ownership and material conflicts of interest: Goldman Sachs policy prohibits its analysts, professionals reporting to analysts and members of their households from owning securities of any company in the analyst's area of coverage. Analyst compensation: Analysts are paid in part based on the profitability of Goldman Sachs, which includes investment banking revenues. Analyst as officer or director: Goldman Sachs policy prohibits its analysts, persons reporting to analysts or members of their households from serving as an officer, director, advisory board member or employee of any company in the analyst's area of coverage. Non-U.S. Analysts: Non-U.S. analysts may not be associated persons of Goldman Sachs & Co. and therefore may not be subject to NASD Rule 2711/NYSE Rules 472 restrictions on communications with subject company, public appearances and trading securities held by the analysts. Distribution of ratings: See the distribution of ratings disclosure above. Price chart: See the price chart, with changes of ratings and price targets in prior periods, above, or, if electronic format or if with respect to multiple companies which are the subject of this report, on the Goldman Sachs website at http://www.gs.com/research/hedge.html. Additional disclosures required under the laws and regulations of jurisdictions other than the United States The following disclosures are those required by the jurisdiction indicated, except to the extent already made above pursuant to United States laws and regulations. Australia: This research, and any access to it, is intended only for "wholesale clients" within the meaning of the Australian Corporations Act. Brazil: Disclosure information in relation to CVM Instruction 483 is available at http://www.gs.com/worldwide/brazil/gir/index.html. Where applicable, the Brazil-registered analyst primarily responsible for the content of this research report, as defined in Article 16 of CVM Instruction 483, is the first author named at the beginning of this report, unless indicated otherwise at the end of the text. Canada: Goldman Sachs & Co. has approved of, and agreed to take responsibility for, this research in Canada if and to the extent it relates to equity securities of Canadian issuers. Analysts may conduct site visits but are prohibited from accepting payment or reimbursement by the company of travel expenses for such visits. Hong Kong: Further information on the securities of covered companies referred to in this research may be obtained on request from Goldman Sachs (Asia) L.L.C. India: Further information on the subject company or companies referred to in this research may be obtained from Goldman Sachs (India) Securities Private Limited; Japan: See below. Korea: Further information on the subject company or companies referred to in this research may be obtained from Goldman Sachs (Asia) L.L.C., Seoul Branch. Russia: Research reports distributed in the Russian Federation are not advertising as defined in the Russian legislation, but are information and analysis not having product promotion as their main purpose and do not provide appraisal within the meaning of the Russian legislation on appraisal activity. Singapore: Further information on the covered companies referred to in this research may be obtained from Goldman Sachs (Singapore) Pte. (Company Number: 198602165W). Taiwan: This material is for reference only and must not be reprinted without permission. Investors should carefully consider their own investment risk. Investment results are the responsibility of the individual investor. United Kingdom: Persons who would be categorized as retail clients in the United Kingdom, as such term is defined in the rules of the Financial Services Authority, should read this research in conjunction with prior Goldman Sachs Global Investment Research 5
- 6. October 26, 2011 Taiwan Synthetic Rubber Corporation (2103.TW) Goldman Sachs research on the covered companies referred to herein and should refer to the risk warnings that have been sent to them by Goldman Sachs International. A copy of these risks warnings, and a glossary of certain financial terms used in this report, are available from Goldman Sachs International on request. European Union: Disclosure information in relation to Article 4 (1) (d) and Article 6 (2) of the European Commission Directive 2003/126/EC is available at http://www.gs.com/client_services/global_investment_research/europeanpolicy.html which states the European Policy for Managing Conflicts of Interest in Connection with Investment Research. Japan: Goldman Sachs Japan Co., Ltd. is a Financial Instrument Dealer under the Financial Instrument and Exchange Law, registered with the Kanto Financial Bureau (Registration No. 69), and is a member of Japan Securities Dealers Association (JSDA) and Financial Futures Association of Japan (FFAJ). Sales and purchase of equities are subject to commission pre-determined with clients plus consumption tax. See company-specific disclosures as to any applicable disclosures required by Japanese stock exchanges, the Japanese Securities Dealers Association or the Japanese Securities Finance Company. Ratings, coverage groups and views and related definitions Buy (B), Neutral (N), Sell (S) -Analysts recommend stocks as Buys or Sells for inclusion on various regional Investment Lists. Being assigned a Buy or Sell on an Investment List is determined by a stock's return potential relative to its coverage group as described below. Any stock not assigned as a Buy or a Sell on an Investment List is deemed Neutral. Each regional Investment Review Committee manages various regional Investment Lists to a global guideline of 25%-35% of stocks as Buy and 10%-15% of stocks as Sell; however, the distribution of Buys and Sells in any particular coverage group may vary as determined by the regional Investment Review Committee. Regional Conviction Buy and Sell lists represent investment recommendations focused on either the size of the potential return or the likelihood of the realization of the return. Return potential represents the price differential between the current share price and the price target expected during the time horizon associated with the price target. Price targets are required for all covered stocks. The return potential, price target and associated time horizon are stated in each report adding or reiterating an Investment List membership. Coverage groups and views: A list of all stocks in each coverage group is available by primary analyst, stock and coverage group at http://www.gs.com/research/hedge.html. The analyst assigns one of the following coverage views which represents the analyst's investment outlook on the coverage group relative to the group's historical fundamentals and/or valuation. Attractive (A). The investment outlook over the following 12 months is favorable relative to the coverage group's historical fundamentals and/or valuation. Neutral (N). The investment outlook over the following 12 months is neutral relative to the coverage group's historical fundamentals and/or valuation. Cautious (C). The investment outlook over the following 12 months is unfavorable relative to the coverage group's historical fundamentals and/or valuation. Not Rated (NR). The investment rating and target price have been removed pursuant to Goldman Sachs policy when Goldman Sachs is acting in an advisory capacity in a merger or strategic transaction involving this company and in certain other circumstances. Rating Suspended (RS). Goldman Sachs Research has suspended the investment rating and price target for this stock, because there is not a sufficient fundamental basis for determining, or there are legal, regulatory or policy constraints around publishing, an investment rating or target. The previous investment rating and price target, if any, are no longer in effect for this stock and should not be relied upon. Coverage Suspended (CS). Goldman Sachs has suspended coverage of this company. Not Covered (NC). Goldman Sachs does not cover this company. Not Available or Not Applicable (NA). The information is not available for display or is not applicable. Not Meaningful (NM). The information is not meaningful and is therefore excluded. Global product; distributing entities The Global Investment Research Division of Goldman Sachs produces and distributes research products for clients of Goldman Sachs, and pursuant to certain contractual arrangements, on a global basis. Analysts based in Goldman Sachs offices around the world produce equity research on industries and companies, and research on macroeconomics, currencies, commodities and portfolio strategy. This research is disseminated in Australia by Goldman Sachs & Partners Australia Pty Ltd (ABN 21 006 797 897) on behalf of Goldman Sachs; in Brazil by Goldman Sachs do Brasil Banco Múltiplo S.A.; in Canada by Goldman Sachs & Co. regarding Canadian equities and by Goldman Sachs & Co. (all other research); in Hong Kong by Goldman Sachs (Asia) L.L.C.; in India by Goldman Sachs (India) Securities Private Ltd.; in Japan by Goldman Sachs Japan Co., Ltd.; in the Republic of Korea by Goldman Sachs (Asia) L.L.C., Seoul Branch; in New Zealand by Goldman Sachs & Partners New Zealand Limited on behalf of Goldman Sachs; in Russia by OOO Goldman Sachs; in Singapore by Goldman Sachs (Singapore) Pte. (Company Number: 198602165W); and in the United States of America by Goldman Sachs & Co. Goldman Sachs International has approved this research in connection with its distribution in the United Kingdom and European Union. European Union: Goldman Sachs International, authorized and regulated by the Financial Services Authority, has approved this research in connection with its distribution in the European Union and United Kingdom; Goldman Sachs AG, regulated by the Bundesanstalt für Finanzdienstleistungsaufsicht, may also distribute research in Germany. General disclosures This research is for our clients only. Other than disclosures relating to Goldman Sachs, this research is based on current public information that we consider reliable, but we do not represent it is accurate or complete, and it should not be relied on as such. We seek to update our research as appropriate, but various regulations may prevent us from doing so. Other than certain industry reports published on a periodic basis, the large majority of reports are published at irregular intervals as appropriate in the analyst's judgment. Goldman Sachs conducts a global full-service, integrated investment banking, investment management, and brokerage business. We have investment banking and other business relationships with a substantial percentage of the companies covered by our Global Investment Research Division. Goldman Sachs & Co., the United States broker dealer, is a member of SIPC (http://www.sipc.org). Our salespeople, traders, and other professionals may provide oral or written market commentary or trading strategies to our clients and our proprietary trading desks that reflect opinions that are contrary to the opinions expressed in this research. Our asset management area, our proprietary trading desks and investing businesses may make investment decisions that are inconsistent with the recommendations or views expressed in this research. The analysts named in this report may have from time to time discussed with our clients, including Goldman Sachs salespersons and traders, or may discuss in this report, trading strategies that reference catalysts or events that may have a near-term impact on the market price of the equity securities discussed in this report, which impact may be directionally counter to the analysts' published price target expectations for such stocks. Any such trading strategies are distinct from and do not affect the analysts' fundamental equity rating for such stocks, which rating reflects a stock's return potential relative to its coverage group as described herein. We and our affiliates, officers, directors, and employees, excluding equity and credit analysts, will from time to time have long or short positions in, act as principal in, and buy or sell, the securities or derivatives, if any, referred to in this research. Goldman Sachs Global Investment Research 6
- 7. October 26, 2011 Taiwan Synthetic Rubber Corporation (2103.TW) This research is not an offer to sell or the solicitation of an offer to buy any security in any jurisdiction where such an offer or solicitation would be illegal. It does not constitute a personal recommendation or take into account the particular investment objectives, financial situations, or needs of individual clients. Clients should consider whether any advice or recommendation in this research is suitable for their particular circumstances and, if appropriate, seek professional advice, including tax advice. The price and value of investments referred to in this research and the income from them may fluctuate. Past performance is not a guide to future performance, future returns are not guaranteed, and a loss of original capital may occur. Fluctuations in exchange rates could have adverse effects on the value or price of, or income derived from, certain investments. Certain transactions, including those involving futures, options, and other derivatives, give rise to substantial risk and are not suitable for all investors. Investors should review current options disclosure documents which are available from Goldman Sachs sales representatives or at http://www.theocc.com/about/publications/character-risks.jsp. Transactions cost may be significant in option strategies calling for multiple purchase and sales of options such as spreads. Supporting documentation will be supplied upon request. All research reports are disseminated and available to all clients simultaneously through electronic publication to our internal client websites. Not all research content is redistributed to our clients or available to third-party aggregators, nor is Goldman Sachs responsible for the redistribution of our research by third party aggregators. For all research available on a particular stock, please contact your sales representative or go to http://360.gs.com. Disclosure information is also available at http://www.gs.com/research/hedge.html or from Research Compliance, 200 West Street, New York, NY 10282. Copyright 2011 Goldman Sachs. No part of this material may be (i) copied, photocopied or duplicated in any form by any means or (ii) redistributed without the prior written consent of The Goldman Sachs Group, Inc. Goldman Sachs Global Investment Research 7