SlideShare una empresa de Scribd logo
1 de 12
Diversified Asset Management
Portfolio Analysis


       Year:                   % Gain/(Loss)   $ Gain/(Loss)   Portfolio Value    S&P Value
       1999                       19.00%         $19,001.54     $119,001.54      $119,530.00
       2000                       2.21%          $2,635.04      $121,636.56      $107,409.66
       2001                       -4.42%         -$5,378.99     $116,257.62       $93,403.45
       2002                      -12.52%        -$14,552.86     $101,704.22       $71,575.07
       2003                       31.57%         $32,111.09     $133,815.29       $90,456.57
       2004                       14.37%         $19,229.97     $153,045.25       $98,588.61
       2005                       6.29%          $9,123.49      $162,668.69      $101,546.26
       2006                       16.44%         $26,748.99     $189,417.57      $104,592.64
       2007                       4.24%          $8,024.92      $197,442.42      $108,284.76
                                 -28.30%        ($55,885.96)    $141,556.39       $66,605.96
      2008 ytd
                                                                    $0.00           $0.00
                                                                    $0.00           $0.00
                                                                    $0.00           $0.00
                                                                    $0.00           $0.00
                                                                    $0.00           $0.00
                                                                    $0.00           $0.00
                                                                    $0.00           $0.00
                                                                    $0.00           $0.00
                                                                    $0.00           $0.00
                                                                    $0.00           $0.00
                                                                    $0.00           $0.00
                                                                    $0.00           $0.00
                                                                    $0.00           $0.00
                                                                    $0.00           $0.00
                                                                    $0.00           $0.00
                                                                    $0.00           $0.00
Diversified Asset Management
Portfolio Analysis


                                                                                          % Diff.
                             Portfolio                     S&P 500                  Portfolio vs.
            2006                           11.06%                      8.03%                        3.03%
    Year:                % Gain / Loss:               % Gain / Loss:                    S&P 500

    Asset Name:                Initial Value        % Gain/(Loss)          $ Gain/(Loss)                    EOY Value
        SPY                      $100.00               8.99%                    $8.99                        $108.99
       MUNT                      $100.00               10.00%                  $10.00                        $110.00
       PTM                       $100.00              -10.00%                 -$10.00                         $90.00
        IWN                      $599.00               20.00%                 $119.80                        $718.80
          Q                      $100.00               2.00%                    $2.00                        $102.00
       RECT                      $100.00               1.00%                    $1.00                        $101.00
       MDY                       $100.00               2.00%                    $2.00                        $102.00
        IWO                      $100.00               10.00%                  $10.00                        $110.00
         IFU                     $100.00               10.00%                  $10.00                        $110.00
       KWJ                       $100.00               12.00%                  $12.00                        $112.00
                                                                                $0.00                         $0.00
                                                                                $0.00                         $0.00
                                                                                $0.00                         $0.00
                                                                                $0.00                         $0.00
                                                                                $0.00                         $0.00
                                                                                $0.00                         $0.00
                                                                                $0.00                         $0.00
                                                                                $0.00                         $0.00
                                                                                $0.00                         $0.00
                                                                                $0.00                         $0.00
                                                                                $0.00                         $0.00
                                                                                $0.00                         $0.00
                                                                                $0.00                         $0.00
                                                                                $0.00                         $0.00
                                                                                $0.00                         $0.00
                                                                                $0.00                         $0.00
                                                                                $0.00                         $0.00
                                                                                $0.00                         $0.00
              Totals:          $1,499.00               11.06%                 $165.79                       $1,664.79
Diversified Asset Management
Portfolio Analysis


                                                                                          % Diff.
                             Portfolio                     S&P 500                  Portfolio vs.
            2005                           10.82%                      8.03%                        2.79%
    Year:                % Gain / Loss:               % Gain / Loss:                    S&P 500

    Asset Name:                Initial Value        % Gain/(Loss)          $ Gain/(Loss)                    EOY Value
        SPY                      $100.00               8.99%                    $8.99                        $108.99
       MUNT                      $100.00               10.00%                  $10.00                        $110.00
       PTM                       $100.00              -10.00%                 -$10.00                         $90.00
        IWN                      $599.00               20.00%                 $119.80                        $718.80
          Q                      $100.00               2.00%                    $2.00                        $102.00
       RECT                      $100.00               1.00%                    $1.00                        $101.00
       MDY                       $100.00               2.00%                    $2.00                        $102.00
        IWO                      $100.00               4.00%                    $4.00                        $104.00
         IFU                     $100.00               10.00%                  $10.00                        $110.00
       KWJ                       $100.00               12.00%                  $12.00                        $112.00
                                 $200.00               12.00%                  $24.00                        $224.00
                                                       0.00%                    $0.00                         $0.00
                                                       0.00%                    $0.00                         $0.00
                                                       0.00%                    $0.00                         $0.00
                                                       0.00%                    $0.00                         $0.00
                                                       0.00%                    $0.00                         $0.00
                                                       0.00%                    $0.00                         $0.00
                                                       0.00%                    $0.00                         $0.00
                                                       0.00%                    $0.00                         $0.00
                                                       0.00%                    $0.00                         $0.00
                                                       0.00%                    $0.00                         $0.00
                                                       0.00%                    $0.00                         $0.00
                                                       0.00%                    $0.00                         $0.00
                                                       0.00%                    $0.00                         $0.00
                                                       0.00%                    $0.00                         $0.00
                                                       0.00%                    $0.00                         $0.00
                                                       0.00%                    $0.00                         $0.00
                                                       0.00%                    $0.00                         $0.00
              Totals:          $1,699.00               10.82%                 $183.79                       $1,882.79
Diversified Asset Management
Portfolio Analysis


                                                                                          % Diff.
                             Portfolio                     S&P 500                  Portfolio vs.
            2004                           10.66%                      8.03%                        2.63%
    Year:                % Gain / Loss:               % Gain / Loss:                    S&P 500

    Asset Name:                Initial Value        % Gain/(Loss)          $ Gain/(Loss)                    EOY Value
        SPY                      $100.00               8.99%                    $8.99                        $108.99
       MUNT                      $100.00               10.00%                  $10.00                        $110.00
       PTM                       $100.00              -10.00%                 -$10.00                         $90.00
        IWN                      $599.00               20.00%                 $119.80                        $718.80
          Q                      $100.00               2.00%                    $2.00                        $102.00
       RECT                      $100.00               1.00%                    $1.00                        $101.00
       MDY                       $100.00               2.00%                    $2.00                        $102.00
        IWO                      $100.00               4.00%                    $4.00                        $104.00
         IFU                     $100.00               10.00%                  $10.00                        $110.00
       KWJ                       $100.00               12.00%                  $12.00                        $112.00
                                                       0.00%                    $0.00                         $0.00
                                                       0.00%                    $0.00                         $0.00
                                                       0.00%                    $0.00                         $0.00
                                                       0.00%                    $0.00                         $0.00
                                                       0.00%                    $0.00                         $0.00
                                                       0.00%                    $0.00                         $0.00
                                                       0.00%                    $0.00                         $0.00
                                                       0.00%                    $0.00                         $0.00
                                                       0.00%                    $0.00                         $0.00
                                                       0.00%                    $0.00                         $0.00
                                                       0.00%                    $0.00                         $0.00
                                                       0.00%                    $0.00                         $0.00
                                                       0.00%                    $0.00                         $0.00
                                                       0.00%                    $0.00                         $0.00
                                                       0.00%                    $0.00                         $0.00
                                                       0.00%                    $0.00                         $0.00
                                                       0.00%                    $0.00                         $0.00
                                                       0.00%                    $0.00                         $0.00
              Totals:          $1,499.00               10.66%                 $159.79                       $1,658.79
Diversified Asset Management
Portfolio Analysis


                                                                                          % Diff.
                             Portfolio                     S&P 500                  Portfolio vs.
            2003                           10.66%                      8.03%                        2.63%
    Year:                % Gain / Loss:               % Gain / Loss:                    S&P 500

    Asset Name:                Initial Value        % Gain/(Loss)          $ Gain/(Loss)                    EOY Value
        SPY                      $100.00               8.99%                    $8.99                        $108.99
       MUNT                      $100.00               10.00%                  $10.00                        $110.00
       PTM                       $100.00              -10.00%                 -$10.00                         $90.00
        IWN                      $599.00               20.00%                 $119.80                        $718.80
          Q                      $100.00               2.00%                    $2.00                        $102.00
       RECT                      $100.00               1.00%                    $1.00                        $101.00
       MDY                       $100.00               2.00%                    $2.00                        $102.00
        IWO                      $100.00               4.00%                    $4.00                        $104.00
         IFU                     $100.00               10.00%                  $10.00                        $110.00
       KWJ                       $100.00               12.00%                  $12.00                        $112.00
                                                       0.00%                    $0.00                         $0.00
                                                       0.00%                    $0.00                         $0.00
                                                       0.00%                    $0.00                         $0.00
                                                       0.00%                    $0.00                         $0.00
                                                       0.00%                    $0.00                         $0.00
                                                       0.00%                    $0.00                         $0.00
                                                       0.00%                    $0.00                         $0.00
                                                       0.00%                    $0.00                         $0.00
                                                       0.00%                    $0.00                         $0.00
                                                       0.00%                    $0.00                         $0.00
                                                       0.00%                    $0.00                         $0.00
                                                       0.00%                    $0.00                         $0.00
                                                       0.00%                    $0.00                         $0.00
                                                       0.00%                    $0.00                         $0.00
                                                       0.00%                    $0.00                         $0.00
                                                       0.00%                    $0.00                         $0.00
                                                       0.00%                    $0.00                         $0.00
                                                       0.00%                    $0.00                         $0.00
              Totals:          $1,499.00               10.66%                 $159.79                       $1,658.79
Diversified Asset Management
Portfolio Analysis


                                                                                          % Diff.
                             Portfolio                     S&P 500                  Portfolio vs.
            2002                           10.66%                      8.03%                        2.63%
    Year:                % Gain / Loss:               % Gain / Loss:                    S&P 500

    Asset Name:                Initial Value        % Gain/(Loss)          $ Gain/(Loss)                    EOY Value
        SPY                      $100.00               8.99%                    $8.99                        $108.99
       MUNT                      $100.00               10.00%                  $10.00                        $110.00
       PTM                       $100.00              -10.00%                 -$10.00                         $90.00
        IWN                      $599.00               20.00%                 $119.80                        $718.80
          Q                      $100.00               2.00%                    $2.00                        $102.00
       RECT                      $100.00               1.00%                    $1.00                        $101.00
       MDY                       $100.00               2.00%                    $2.00                        $102.00
        IWO                      $100.00               4.00%                    $4.00                        $104.00
         IFU                     $100.00               10.00%                  $10.00                        $110.00
       KWJ                       $100.00               12.00%                  $12.00                        $112.00
                                                       0.00%                    $0.00                         $0.00
                                                       0.00%                    $0.00                         $0.00
                                                       0.00%                    $0.00                         $0.00
                                                       0.00%                    $0.00                         $0.00
                                                       0.00%                    $0.00                         $0.00
                                                       0.00%                    $0.00                         $0.00
                                                       0.00%                    $0.00                         $0.00
                                                       0.00%                    $0.00                         $0.00
                                                       0.00%                    $0.00                         $0.00
                                                       0.00%                    $0.00                         $0.00
                                                       0.00%                    $0.00                         $0.00
                                                       0.00%                    $0.00                         $0.00
                                                       0.00%                    $0.00                         $0.00
                                                       0.00%                    $0.00                         $0.00
                                                       0.00%                    $0.00                         $0.00
                                                       0.00%                    $0.00                         $0.00
                                                       0.00%                    $0.00                         $0.00
                                                       0.00%                    $0.00                         $0.00
              Totals:          $1,499.00               10.66%                 $159.79                       $1,658.79
Diversified Asset Management
Portfolio Analysis


                                                                                          % Diff.
                             Portfolio                     S&P 500                  Portfolio vs.
            2001                           10.66%                      8.03%                        2.63%
    Year:                % Gain / Loss:               % Gain / Loss:                    S&P 500

    Asset Name:                Initial Value        % Gain/(Loss)          $ Gain/(Loss)                    EOY Value
        SPY                      $100.00               8.99%                    $8.99                        $108.99
       MUNT                      $100.00               10.00%                  $10.00                        $110.00
       PTM                       $100.00              -10.00%                 -$10.00                         $90.00
        IWN                      $599.00               20.00%                 $119.80                        $718.80
          Q                      $100.00               2.00%                    $2.00                        $102.00
       RECT                      $100.00               1.00%                    $1.00                        $101.00
       MDY                       $100.00               2.00%                    $2.00                        $102.00
        IWO                      $100.00               4.00%                    $4.00                        $104.00
         IFU                     $100.00               10.00%                  $10.00                        $110.00
       KWJ                       $100.00               12.00%                  $12.00                        $112.00
                                                       0.00%                    $0.00                         $0.00
                                                       0.00%                    $0.00                         $0.00
                                                       0.00%                    $0.00                         $0.00
                                                       0.00%                    $0.00                         $0.00
                                                       0.00%                    $0.00                         $0.00
                                                       0.00%                    $0.00                         $0.00
                                                       0.00%                    $0.00                         $0.00
                                                       0.00%                    $0.00                         $0.00
                                                       0.00%                    $0.00                         $0.00
                                                       0.00%                    $0.00                         $0.00
                                                       0.00%                    $0.00                         $0.00
                                                       0.00%                    $0.00                         $0.00
                                                       0.00%                    $0.00                         $0.00
                                                       0.00%                    $0.00                         $0.00
                                                       0.00%                    $0.00                         $0.00
                                                       0.00%                    $0.00                         $0.00
                                                       0.00%                    $0.00                         $0.00
                                                       0.00%                    $0.00                         $0.00
              Totals:          $1,499.00               10.66%                 $159.79                       $1,658.79
Diversified Asset Management
Portfolio Analysis


                                                                                          % Diff.
                             Portfolio                     S&P 500                  Portfolio vs.
            2000                           10.66%                      8.03%                        2.63%
    Year:                % Gain / Loss:               % Gain / Loss:                    S&P 500

    Asset Name:                Initial Value        % Gain/(Loss)          $ Gain/(Loss)                    EOY Value
        SPY                      $100.00               8.99%                    $8.99                        $108.99
       MUNT                      $100.00               10.00%                  $10.00                        $110.00
       PTM                       $100.00              -10.00%                 -$10.00                         $90.00
        IWN                      $599.00               20.00%                 $119.80                        $718.80
          Q                      $100.00               2.00%                    $2.00                        $102.00
       RECT                      $100.00               1.00%                    $1.00                        $101.00
       MDY                       $100.00               2.00%                    $2.00                        $102.00
        IWO                      $100.00               4.00%                    $4.00                        $104.00
         IFU                     $100.00               10.00%                  $10.00                        $110.00
       KWJ                       $100.00               12.00%                  $12.00                        $112.00
                                                       0.00%                    $0.00                         $0.00
                                                       0.00%                    $0.00                         $0.00
                                                       0.00%                    $0.00                         $0.00
                                                       0.00%                    $0.00                         $0.00
                                                       0.00%                    $0.00                         $0.00
                                                       0.00%                    $0.00                         $0.00
                                                       0.00%                    $0.00                         $0.00
                                                       0.00%                    $0.00                         $0.00
                                                       0.00%                    $0.00                         $0.00
                                                       0.00%                    $0.00                         $0.00
                                                       0.00%                    $0.00                         $0.00
                                                       0.00%                    $0.00                         $0.00
                                                       0.00%                    $0.00                         $0.00
                                                       0.00%                    $0.00                         $0.00
                                                       0.00%                    $0.00                         $0.00
                                                       0.00%                    $0.00                         $0.00
                                                       0.00%                    $0.00                         $0.00
                                                       0.00%                    $0.00                         $0.00
              Totals:          $1,499.00               10.66%                 $159.79                       $1,658.79
Diversified Asset Management
Portfolio Analysis


                                                                                          % Diff.
                             Portfolio                     S&P 500                  Portfolio vs.
            1999                           10.66%                      8.03%                        2.63%
    Year:                % Gain / Loss:               % Gain / Loss:                    S&P 500

    Asset Name:                Initial Value        % Gain/(Loss)          $ Gain/(Loss)                    EOY Value
        SPY                      $100.00               8.99%                    $8.99                        $108.99
       MUNT                      $100.00               10.00%                  $10.00                        $110.00
       PTM                       $100.00              -10.00%                 -$10.00                         $90.00
        IWN                      $599.00               20.00%                 $119.80                        $718.80
          Q                      $100.00               2.00%                    $2.00                        $102.00
       RECT                      $100.00               1.00%                    $1.00                        $101.00
       MDY                       $100.00               2.00%                    $2.00                        $102.00
        IWO                      $100.00               4.00%                    $4.00                        $104.00
         IFU                     $100.00               10.00%                  $10.00                        $110.00
       KWJ                       $100.00               12.00%                  $12.00                        $112.00
                                                       0.00%                    $0.00                         $0.00
                                                       0.00%                    $0.00                         $0.00
                                                       0.00%                    $0.00                         $0.00
                                                       0.00%                    $0.00                         $0.00
                                                       0.00%                    $0.00                         $0.00
                                                       0.00%                    $0.00                         $0.00
                                                       0.00%                    $0.00                         $0.00
                                                       0.00%                    $0.00                         $0.00
                                                       0.00%                    $0.00                         $0.00
                                                       0.00%                    $0.00                         $0.00
                                                       0.00%                    $0.00                         $0.00
                                                       0.00%                    $0.00                         $0.00
                                                       0.00%                    $0.00                         $0.00
                                                       0.00%                    $0.00                         $0.00
                                                       0.00%                    $0.00                         $0.00
                                                       0.00%                    $0.00                         $0.00
                                                       0.00%                    $0.00                         $0.00
                                                       0.00%                    $0.00                         $0.00
              Totals:          $1,499.00               10.66%                 $159.79                       $1,658.79
Diversified Asset Management
Portfolio Analysis


                                                                                          % Diff.
                             Portfolio                     S&P 500                  Portfolio vs.
            1998                           10.66%                      8.03%                        2.63%
    Year:                % Gain / Loss:               % Gain / Loss:                    S&P 500

    Asset Name:                Initial Value        % Gain/(Loss)          $ Gain/(Loss)                    EOY Value
        SPY                      $100.00               8.99%                    $8.99                        $108.99
       MUNT                      $100.00               10.00%                  $10.00                        $110.00
       PTM                       $100.00              -10.00%                 -$10.00                         $90.00
        IWN                      $599.00               20.00%                 $119.80                        $718.80
          Q                      $100.00               2.00%                    $2.00                        $102.00
       RECT                      $100.00               1.00%                    $1.00                        $101.00
       MDY                       $100.00               2.00%                    $2.00                        $102.00
        IWO                      $100.00               4.00%                    $4.00                        $104.00
         IFU                     $100.00               10.00%                  $10.00                        $110.00
       KWJ                       $100.00               12.00%                  $12.00                        $112.00
                                                       0.00%                    $0.00                         $0.00
                                                       0.00%                    $0.00                         $0.00
                                                       0.00%                    $0.00                         $0.00
                                                       0.00%                    $0.00                         $0.00
                                                       0.00%                    $0.00                         $0.00
                                                       0.00%                    $0.00                         $0.00
                                                       0.00%                    $0.00                         $0.00
                                                       0.00%                    $0.00                         $0.00
                                                       0.00%                    $0.00                         $0.00
                                                       0.00%                    $0.00                         $0.00
                                                       0.00%                    $0.00                         $0.00
                                                       0.00%                    $0.00                         $0.00
                                                       0.00%                    $0.00                         $0.00
                                                       0.00%                    $0.00                         $0.00
                                                       0.00%                    $0.00                         $0.00
                                                       0.00%                    $0.00                         $0.00
                                                       0.00%                    $0.00                         $0.00
                                                       0.00%                    $0.00                         $0.00
              Totals:          $1,499.00               10.66%                 $159.79                       $1,658.79
Diversified Asset Management
Portfolio Analysis


                                                                                          % Diff.
                             Portfolio                     S&P 500                  Portfolio vs.
            1997                           10.66%                      8.00%                        2.66%
    Year:                % Gain / Loss:               % Gain / Loss:                    S&P 500

    Asset Name:                Initial Value        % Gain/(Loss)          $ Gain/(Loss)                    EOY Value
        SPY                      $100.00               8.99%                    $8.99                        $108.99
       MUNT                      $100.00               10.00%                  $10.00                        $110.00
       PTM                       $100.00              -10.00%                 -$10.00                         $90.00
        IWN                      $599.00               20.00%                 $119.80                        $718.80
          Q                      $100.00               2.00%                    $2.00                        $102.00
       RECT                      $100.00               1.00%                    $1.00                        $101.00
       MDY                       $100.00               2.00%                    $2.00                        $102.00
        IWO                      $100.00               4.00%                    $4.00                        $104.00
         IFU                     $100.00               10.00%                  $10.00                        $110.00
       KWJ                       $100.00               12.00%                  $12.00                        $112.00
                                                       0.00%                    $0.00                         $0.00
                                                       0.00%                    $0.00                         $0.00
                                                       0.00%                    $0.00                         $0.00
                                                       0.00%                    $0.00                         $0.00
                                                       0.00%                    $0.00                         $0.00
                                                       0.00%                    $0.00                         $0.00
                                                       0.00%                    $0.00                         $0.00
                                                       0.00%                    $0.00                         $0.00
                                                       0.00%                    $0.00                         $0.00
                                                       0.00%                    $0.00                         $0.00
                                                       0.00%                    $0.00                         $0.00
                                                       0.00%                    $0.00                         $0.00
                                                       0.00%                    $0.00                         $0.00
                                                       0.00%                    $0.00                         $0.00
                                                       0.00%                    $0.00                         $0.00
                                                       0.00%                    $0.00                         $0.00
                                                       0.00%                    $0.00                         $0.00
                                                       0.00%                    $0.00                         $0.00
              Totals:          $1,499.00               10.66%                 $159.79                       $1,658.79
Diversified Asset Management
Portfolio Analysis


                                                                                          % Diff.
                             Portfolio                     S&P 500                  Portfolio vs.
            1996                           10.66%                      8.03%                        2.63%
    Year:                % Gain / Loss:               % Gain / Loss:                    S&P 500

    Asset Name:                Initial Value        % Gain/(Loss)          $ Gain/(Loss)                    EOY Value
        SPY                      $100.00               8.99%                    $8.99                        $108.99
       MUNT                      $100.00               10.00%                  $10.00                        $110.00
       PTM                       $100.00              -10.00%                 -$10.00                         $90.00
        IWN                      $599.00               20.00%                 $119.80                        $718.80
          Q                      $100.00               2.00%                    $2.00                        $102.00
       RECT                      $100.00               1.00%                    $1.00                        $101.00
       MDY                       $100.00               2.00%                    $2.00                        $102.00
        IWO                      $100.00               4.00%                    $4.00                        $104.00
         IFU                     $100.00               10.00%                  $10.00                        $110.00
       KWJ                       $100.00               12.00%                  $12.00                        $112.00
                                                       0.00%                    $0.00                         $0.00
                                                       0.00%                    $0.00                         $0.00
                                                       0.00%                    $0.00                         $0.00
                                                       0.00%                    $0.00                         $0.00
                                                       0.00%                    $0.00                         $0.00
                                                       0.00%                    $0.00                         $0.00
                                                       0.00%                    $0.00                         $0.00
                                                       0.00%                    $0.00                         $0.00
                                                       0.00%                    $0.00                         $0.00
                                                       0.00%                    $0.00                         $0.00
                                                       0.00%                    $0.00                         $0.00
                                                       0.00%                    $0.00                         $0.00
                                                       0.00%                    $0.00                         $0.00
                                                       0.00%                    $0.00                         $0.00
                                                       0.00%                    $0.00                         $0.00
                                                       0.00%                    $0.00                         $0.00
                                                       0.00%                    $0.00                         $0.00
                                                       0.00%                    $0.00                         $0.00
              Totals:          $1,499.00               10.66%                 $159.79                       $1,658.79

Más contenido relacionado

La actualidad más candente

H W 2011 10 At
H W 2011 10 AtH W 2011 10 At
H W 2011 10 Atchipwags
 
Bnm analisis evolucion depositos - graficos
Bnm   analisis evolucion depositos - graficosBnm   analisis evolucion depositos - graficos
Bnm analisis evolucion depositos - graficosgonzaloromani
 
Annual report ivona poyntz
Annual report ivona poyntzAnnual report ivona poyntz
Annual report ivona poyntzIvonaPoyntz
 
M&A Trends, Valuation and Financial Preparation for an M&A Deal
M&A Trends, Valuation and Financial Preparation for an M&A DealM&A Trends, Valuation and Financial Preparation for an M&A Deal
M&A Trends, Valuation and Financial Preparation for an M&A DealWhitmeyerTuffin
 
Mafia Wars Expense Guide
Mafia Wars Expense GuideMafia Wars Expense Guide
Mafia Wars Expense Guideguest26cede
 
T1FX stable30 investment $30,000
T1FX stable30 investment  $30,000T1FX stable30 investment  $30,000
T1FX stable30 investment $30,000Wendy Foo
 
H W 2010 01 At
H W 2010 01 AtH W 2010 01 At
H W 2010 01 Atchipwags
 
South Carolina Tax Tables
South Carolina Tax TablesSouth Carolina Tax Tables
South Carolina Tax Tablestaxman taxman
 
Ops5 building-a-new-entertainment-brand
Ops5 building-a-new-entertainment-brandOps5 building-a-new-entertainment-brand
Ops5 building-a-new-entertainment-brandbrock55
 
State of California Wireless
State of California WirelessState of California Wireless
State of California WirelessValidas
 
Austin Market Update January 2008
Austin Market Update January 2008Austin Market Update January 2008
Austin Market Update January 2008Dee Patience
 
百萬富翁 03
百萬富翁 03百萬富翁 03
百萬富翁 03Aska Chiu
 

La actualidad más candente (18)

Efficiency maps
Efficiency mapsEfficiency maps
Efficiency maps
 
H W 2011 10 At
H W 2011 10 AtH W 2011 10 At
H W 2011 10 At
 
Bnm analisis evolucion depositos - graficos
Bnm   analisis evolucion depositos - graficosBnm   analisis evolucion depositos - graficos
Bnm analisis evolucion depositos - graficos
 
2010 HAR REALTOR® Expo- Ted Jones, PhD
2010 HAR REALTOR® Expo- Ted Jones, PhD2010 HAR REALTOR® Expo- Ted Jones, PhD
2010 HAR REALTOR® Expo- Ted Jones, PhD
 
Annual report ivona poyntz
Annual report ivona poyntzAnnual report ivona poyntz
Annual report ivona poyntz
 
M&A Trends, Valuation and Financial Preparation for an M&A Deal
M&A Trends, Valuation and Financial Preparation for an M&A DealM&A Trends, Valuation and Financial Preparation for an M&A Deal
M&A Trends, Valuation and Financial Preparation for an M&A Deal
 
Mafia Wars Expense Guide
Mafia Wars Expense GuideMafia Wars Expense Guide
Mafia Wars Expense Guide
 
T1FX stable30 investment $30,000
T1FX stable30 investment  $30,000T1FX stable30 investment  $30,000
T1FX stable30 investment $30,000
 
H W 2010 01 At
H W 2010 01 AtH W 2010 01 At
H W 2010 01 At
 
South Carolina Tax Tables
South Carolina Tax TablesSouth Carolina Tax Tables
South Carolina Tax Tables
 
Ops5 building-a-new-entertainment-brand
Ops5 building-a-new-entertainment-brandOps5 building-a-new-entertainment-brand
Ops5 building-a-new-entertainment-brand
 
State of California Wireless
State of California WirelessState of California Wireless
State of California Wireless
 
Present and Future of Company
Present and Future of CompanyPresent and Future of Company
Present and Future of Company
 
Member tours closing %
Member tours closing %Member tours closing %
Member tours closing %
 
Bob chapman presentation 07
Bob chapman presentation 07Bob chapman presentation 07
Bob chapman presentation 07
 
Austin Market Update January 2008
Austin Market Update January 2008Austin Market Update January 2008
Austin Market Update January 2008
 
百萬富翁 03
百萬富翁 03百萬富翁 03
百萬富翁 03
 
America1st Choice Compensation Pay Plan
America1st Choice Compensation Pay PlanAmerica1st Choice Compensation Pay Plan
America1st Choice Compensation Pay Plan
 

Destacado

Coralmap OpenCoffeeClub prezentacija
Coralmap  OpenCoffeeClub prezentacijaCoralmap  OpenCoffeeClub prezentacija
Coralmap OpenCoffeeClub prezentacijacoralmap.lt
 
Comentari d'una pintura
Comentari d'una pinturaComentari d'una pintura
Comentari d'una pinturatrastosimon
 
2000 anti pronation tape_before_and_after_exercise
2000 anti pronation tape_before_and_after_exercise2000 anti pronation tape_before_and_after_exercise
2000 anti pronation tape_before_and_after_exercisepainfree888
 
Treball d'art alba i judit molina
Treball d'art alba i judit molinaTreball d'art alba i judit molina
Treball d'art alba i judit molinatrastosimon
 
Comentari d'una pintura
Comentari d'una pinturaComentari d'una pintura
Comentari d'una pinturatrastosimon
 
Comentari d'un quadre
Comentari d'un quadreComentari d'un quadre
Comentari d'un quadretrastosimon
 
住院病歷書寫原則
住院病歷書寫原則住院病歷書寫原則
住院病歷書寫原則doctor_service
 
Tajuk Kajian Slide
Tajuk Kajian SlideTajuk Kajian Slide
Tajuk Kajian Slideismailjaafar
 
Karangan Fakta Bengkel Gce N 15072006
Karangan Fakta Bengkel Gce N 15072006Karangan Fakta Bengkel Gce N 15072006
Karangan Fakta Bengkel Gce N 15072006ismailjaafar
 
Kata Ganti Nama Nt
Kata Ganti Nama NtKata Ganti Nama Nt
Kata Ganti Nama Ntismailjaafar
 
Kuih Tradisional Melayu
Kuih Tradisional MelayuKuih Tradisional Melayu
Kuih Tradisional Melayuismailjaafar
 
Dealing With Difficult People Leadership Day
Dealing With Difficult People Leadership DayDealing With Difficult People Leadership Day
Dealing With Difficult People Leadership DayWilliam Chaney
 

Destacado (17)

Cv
CvCv
Cv
 
Coralmap OpenCoffeeClub prezentacija
Coralmap  OpenCoffeeClub prezentacijaCoralmap  OpenCoffeeClub prezentacija
Coralmap OpenCoffeeClub prezentacija
 
Comentari d'una pintura
Comentari d'una pinturaComentari d'una pintura
Comentari d'una pintura
 
2000 anti pronation tape_before_and_after_exercise
2000 anti pronation tape_before_and_after_exercise2000 anti pronation tape_before_and_after_exercise
2000 anti pronation tape_before_and_after_exercise
 
Treball d'art alba i judit molina
Treball d'art alba i judit molinaTreball d'art alba i judit molina
Treball d'art alba i judit molina
 
A Betlem
A BetlemA Betlem
A Betlem
 
Comentari d'una pintura
Comentari d'una pinturaComentari d'una pintura
Comentari d'una pintura
 
Comentari d'un quadre
Comentari d'un quadreComentari d'un quadre
Comentari d'un quadre
 
Abdullah Munsyi
Abdullah MunsyiAbdullah Munsyi
Abdullah Munsyi
 
住院病歷書寫原則
住院病歷書寫原則住院病歷書寫原則
住院病歷書寫原則
 
Tajuk Kajian Slide
Tajuk Kajian SlideTajuk Kajian Slide
Tajuk Kajian Slide
 
Karangan Fakta Bengkel Gce N 15072006
Karangan Fakta Bengkel Gce N 15072006Karangan Fakta Bengkel Gce N 15072006
Karangan Fakta Bengkel Gce N 15072006
 
Kata Ganti Nama Nt
Kata Ganti Nama NtKata Ganti Nama Nt
Kata Ganti Nama Nt
 
spyware
spywarespyware
spyware
 
Kuih Tradisional Melayu
Kuih Tradisional MelayuKuih Tradisional Melayu
Kuih Tradisional Melayu
 
Pantun
PantunPantun
Pantun
 
Dealing With Difficult People Leadership Day
Dealing With Difficult People Leadership DayDealing With Difficult People Leadership Day
Dealing With Difficult People Leadership Day
 

Similar a Analysis Coversheet Final

Similar a Analysis Coversheet Final (20)

FY07 Master .xls
FY07 Master .xlsFY07 Master .xls
FY07 Master .xls
 
Unaudited Actuals
Unaudited ActualsUnaudited Actuals
Unaudited Actuals
 
Calculadora
CalculadoraCalculadora
Calculadora
 
Calculadora
CalculadoraCalculadora
Calculadora
 
Co
CoCo
Co
 
Executive Summary Rough Draft #3
Executive Summary Rough Draft #3Executive Summary Rough Draft #3
Executive Summary Rough Draft #3
 
Social Media Marketing Budget Template
Social Media Marketing Budget TemplateSocial Media Marketing Budget Template
Social Media Marketing Budget Template
 
Maine Tobacco Program Allocations, 2001-2013, Updated July 2011
Maine Tobacco Program Allocations, 2001-2013, Updated July 2011Maine Tobacco Program Allocations, 2001-2013, Updated July 2011
Maine Tobacco Program Allocations, 2001-2013, Updated July 2011
 
Cotizacion Redes Cole
Cotizacion Redes ColeCotizacion Redes Cole
Cotizacion Redes Cole
 
Book1
Book1Book1
Book1
 
Trading plan
Trading planTrading plan
Trading plan
 
"INTRODUCCION DE NUEVAS ESPECIES PARA LA PRODUCCION DE FLORES A CAMPO ABIERTO"
"INTRODUCCION DE NUEVAS ESPECIES PARA LA PRODUCCION DE FLORES A CAMPO ABIERTO""INTRODUCCION DE NUEVAS ESPECIES PARA LA PRODUCCION DE FLORES A CAMPO ABIERTO"
"INTRODUCCION DE NUEVAS ESPECIES PARA LA PRODUCCION DE FLORES A CAMPO ABIERTO"
 
Presupuesto mensual
Presupuesto mensualPresupuesto mensual
Presupuesto mensual
 
事業計画書
事業計画書事業計画書
事業計画書
 
Tabla de Presupuesto
Tabla de PresupuestoTabla de Presupuesto
Tabla de Presupuesto
 
Global Taxation Arbitrage
Global Taxation ArbitrageGlobal Taxation Arbitrage
Global Taxation Arbitrage
 
Factura Excel
Factura ExcelFactura Excel
Factura Excel
 
Factura Excel
Factura ExcelFactura Excel
Factura Excel
 
Bms 9to5 worksched1
Bms 9to5 worksched1Bms 9to5 worksched1
Bms 9to5 worksched1
 
Trabajo
TrabajoTrabajo
Trabajo
 

Último

A Beginners Guide to Building a RAG App Using Open Source Milvus
A Beginners Guide to Building a RAG App Using Open Source MilvusA Beginners Guide to Building a RAG App Using Open Source Milvus
A Beginners Guide to Building a RAG App Using Open Source MilvusZilliz
 
AWS Community Day CPH - Three problems of Terraform
AWS Community Day CPH - Three problems of TerraformAWS Community Day CPH - Three problems of Terraform
AWS Community Day CPH - Three problems of TerraformAndrey Devyatkin
 
Apidays New York 2024 - The Good, the Bad and the Governed by David O'Neill, ...
Apidays New York 2024 - The Good, the Bad and the Governed by David O'Neill, ...Apidays New York 2024 - The Good, the Bad and the Governed by David O'Neill, ...
Apidays New York 2024 - The Good, the Bad and the Governed by David O'Neill, ...apidays
 
"I see eyes in my soup": How Delivery Hero implemented the safety system for ...
"I see eyes in my soup": How Delivery Hero implemented the safety system for ..."I see eyes in my soup": How Delivery Hero implemented the safety system for ...
"I see eyes in my soup": How Delivery Hero implemented the safety system for ...Zilliz
 
ICT role in 21st century education and its challenges
ICT role in 21st century education and its challengesICT role in 21st century education and its challenges
ICT role in 21st century education and its challengesrafiqahmad00786416
 
Automating Google Workspace (GWS) & more with Apps Script
Automating Google Workspace (GWS) & more with Apps ScriptAutomating Google Workspace (GWS) & more with Apps Script
Automating Google Workspace (GWS) & more with Apps Scriptwesley chun
 
Navi Mumbai Call Girls 🥰 8617370543 Service Offer VIP Hot Model
Navi Mumbai Call Girls 🥰 8617370543 Service Offer VIP Hot ModelNavi Mumbai Call Girls 🥰 8617370543 Service Offer VIP Hot Model
Navi Mumbai Call Girls 🥰 8617370543 Service Offer VIP Hot ModelDeepika Singh
 
Strategies for Unlocking Knowledge Management in Microsoft 365 in the Copilot...
Strategies for Unlocking Knowledge Management in Microsoft 365 in the Copilot...Strategies for Unlocking Knowledge Management in Microsoft 365 in the Copilot...
Strategies for Unlocking Knowledge Management in Microsoft 365 in the Copilot...Drew Madelung
 
2024: Domino Containers - The Next Step. News from the Domino Container commu...
2024: Domino Containers - The Next Step. News from the Domino Container commu...2024: Domino Containers - The Next Step. News from the Domino Container commu...
2024: Domino Containers - The Next Step. News from the Domino Container commu...Martijn de Jong
 
TrustArc Webinar - Unlock the Power of AI-Driven Data Discovery
TrustArc Webinar - Unlock the Power of AI-Driven Data DiscoveryTrustArc Webinar - Unlock the Power of AI-Driven Data Discovery
TrustArc Webinar - Unlock the Power of AI-Driven Data DiscoveryTrustArc
 
A Year of the Servo Reboot: Where Are We Now?
A Year of the Servo Reboot: Where Are We Now?A Year of the Servo Reboot: Where Are We Now?
A Year of the Servo Reboot: Where Are We Now?Igalia
 
Emergent Methods: Multi-lingual narrative tracking in the news - real-time ex...
Emergent Methods: Multi-lingual narrative tracking in the news - real-time ex...Emergent Methods: Multi-lingual narrative tracking in the news - real-time ex...
Emergent Methods: Multi-lingual narrative tracking in the news - real-time ex...Zilliz
 
Manulife - Insurer Transformation Award 2024
Manulife - Insurer Transformation Award 2024Manulife - Insurer Transformation Award 2024
Manulife - Insurer Transformation Award 2024The Digital Insurer
 
Ransomware_Q4_2023. The report. [EN].pdf
Ransomware_Q4_2023. The report. [EN].pdfRansomware_Q4_2023. The report. [EN].pdf
Ransomware_Q4_2023. The report. [EN].pdfOverkill Security
 
MINDCTI Revenue Release Quarter One 2024
MINDCTI Revenue Release Quarter One 2024MINDCTI Revenue Release Quarter One 2024
MINDCTI Revenue Release Quarter One 2024MIND CTI
 
MS Copilot expands with MS Graph connectors
MS Copilot expands with MS Graph connectorsMS Copilot expands with MS Graph connectors
MS Copilot expands with MS Graph connectorsNanddeep Nachan
 
Connector Corner: Accelerate revenue generation using UiPath API-centric busi...
Connector Corner: Accelerate revenue generation using UiPath API-centric busi...Connector Corner: Accelerate revenue generation using UiPath API-centric busi...
Connector Corner: Accelerate revenue generation using UiPath API-centric busi...DianaGray10
 
Real Time Object Detection Using Open CV
Real Time Object Detection Using Open CVReal Time Object Detection Using Open CV
Real Time Object Detection Using Open CVKhem
 
AXA XL - Insurer Innovation Award Americas 2024
AXA XL - Insurer Innovation Award Americas 2024AXA XL - Insurer Innovation Award Americas 2024
AXA XL - Insurer Innovation Award Americas 2024The Digital Insurer
 

Último (20)

A Beginners Guide to Building a RAG App Using Open Source Milvus
A Beginners Guide to Building a RAG App Using Open Source MilvusA Beginners Guide to Building a RAG App Using Open Source Milvus
A Beginners Guide to Building a RAG App Using Open Source Milvus
 
AWS Community Day CPH - Three problems of Terraform
AWS Community Day CPH - Three problems of TerraformAWS Community Day CPH - Three problems of Terraform
AWS Community Day CPH - Three problems of Terraform
 
Apidays New York 2024 - The Good, the Bad and the Governed by David O'Neill, ...
Apidays New York 2024 - The Good, the Bad and the Governed by David O'Neill, ...Apidays New York 2024 - The Good, the Bad and the Governed by David O'Neill, ...
Apidays New York 2024 - The Good, the Bad and the Governed by David O'Neill, ...
 
"I see eyes in my soup": How Delivery Hero implemented the safety system for ...
"I see eyes in my soup": How Delivery Hero implemented the safety system for ..."I see eyes in my soup": How Delivery Hero implemented the safety system for ...
"I see eyes in my soup": How Delivery Hero implemented the safety system for ...
 
ICT role in 21st century education and its challenges
ICT role in 21st century education and its challengesICT role in 21st century education and its challenges
ICT role in 21st century education and its challenges
 
Automating Google Workspace (GWS) & more with Apps Script
Automating Google Workspace (GWS) & more with Apps ScriptAutomating Google Workspace (GWS) & more with Apps Script
Automating Google Workspace (GWS) & more with Apps Script
 
Navi Mumbai Call Girls 🥰 8617370543 Service Offer VIP Hot Model
Navi Mumbai Call Girls 🥰 8617370543 Service Offer VIP Hot ModelNavi Mumbai Call Girls 🥰 8617370543 Service Offer VIP Hot Model
Navi Mumbai Call Girls 🥰 8617370543 Service Offer VIP Hot Model
 
Strategies for Unlocking Knowledge Management in Microsoft 365 in the Copilot...
Strategies for Unlocking Knowledge Management in Microsoft 365 in the Copilot...Strategies for Unlocking Knowledge Management in Microsoft 365 in the Copilot...
Strategies for Unlocking Knowledge Management in Microsoft 365 in the Copilot...
 
2024: Domino Containers - The Next Step. News from the Domino Container commu...
2024: Domino Containers - The Next Step. News from the Domino Container commu...2024: Domino Containers - The Next Step. News from the Domino Container commu...
2024: Domino Containers - The Next Step. News from the Domino Container commu...
 
TrustArc Webinar - Unlock the Power of AI-Driven Data Discovery
TrustArc Webinar - Unlock the Power of AI-Driven Data DiscoveryTrustArc Webinar - Unlock the Power of AI-Driven Data Discovery
TrustArc Webinar - Unlock the Power of AI-Driven Data Discovery
 
A Year of the Servo Reboot: Where Are We Now?
A Year of the Servo Reboot: Where Are We Now?A Year of the Servo Reboot: Where Are We Now?
A Year of the Servo Reboot: Where Are We Now?
 
Emergent Methods: Multi-lingual narrative tracking in the news - real-time ex...
Emergent Methods: Multi-lingual narrative tracking in the news - real-time ex...Emergent Methods: Multi-lingual narrative tracking in the news - real-time ex...
Emergent Methods: Multi-lingual narrative tracking in the news - real-time ex...
 
Manulife - Insurer Transformation Award 2024
Manulife - Insurer Transformation Award 2024Manulife - Insurer Transformation Award 2024
Manulife - Insurer Transformation Award 2024
 
Ransomware_Q4_2023. The report. [EN].pdf
Ransomware_Q4_2023. The report. [EN].pdfRansomware_Q4_2023. The report. [EN].pdf
Ransomware_Q4_2023. The report. [EN].pdf
 
MINDCTI Revenue Release Quarter One 2024
MINDCTI Revenue Release Quarter One 2024MINDCTI Revenue Release Quarter One 2024
MINDCTI Revenue Release Quarter One 2024
 
MS Copilot expands with MS Graph connectors
MS Copilot expands with MS Graph connectorsMS Copilot expands with MS Graph connectors
MS Copilot expands with MS Graph connectors
 
Connector Corner: Accelerate revenue generation using UiPath API-centric busi...
Connector Corner: Accelerate revenue generation using UiPath API-centric busi...Connector Corner: Accelerate revenue generation using UiPath API-centric busi...
Connector Corner: Accelerate revenue generation using UiPath API-centric busi...
 
Real Time Object Detection Using Open CV
Real Time Object Detection Using Open CVReal Time Object Detection Using Open CV
Real Time Object Detection Using Open CV
 
AXA XL - Insurer Innovation Award Americas 2024
AXA XL - Insurer Innovation Award Americas 2024AXA XL - Insurer Innovation Award Americas 2024
AXA XL - Insurer Innovation Award Americas 2024
 
+971581248768>> SAFE AND ORIGINAL ABORTION PILLS FOR SALE IN DUBAI AND ABUDHA...
+971581248768>> SAFE AND ORIGINAL ABORTION PILLS FOR SALE IN DUBAI AND ABUDHA...+971581248768>> SAFE AND ORIGINAL ABORTION PILLS FOR SALE IN DUBAI AND ABUDHA...
+971581248768>> SAFE AND ORIGINAL ABORTION PILLS FOR SALE IN DUBAI AND ABUDHA...
 

Analysis Coversheet Final

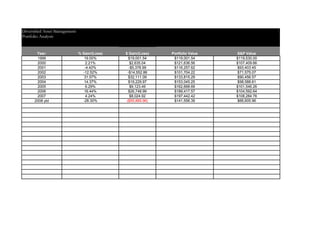
  • 1. Diversified Asset Management Portfolio Analysis Year: % Gain/(Loss) $ Gain/(Loss) Portfolio Value S&P Value 1999 19.00% $19,001.54 $119,001.54 $119,530.00 2000 2.21% $2,635.04 $121,636.56 $107,409.66 2001 -4.42% -$5,378.99 $116,257.62 $93,403.45 2002 -12.52% -$14,552.86 $101,704.22 $71,575.07 2003 31.57% $32,111.09 $133,815.29 $90,456.57 2004 14.37% $19,229.97 $153,045.25 $98,588.61 2005 6.29% $9,123.49 $162,668.69 $101,546.26 2006 16.44% $26,748.99 $189,417.57 $104,592.64 2007 4.24% $8,024.92 $197,442.42 $108,284.76 -28.30% ($55,885.96) $141,556.39 $66,605.96 2008 ytd $0.00 $0.00 $0.00 $0.00 $0.00 $0.00 $0.00 $0.00 $0.00 $0.00 $0.00 $0.00 $0.00 $0.00 $0.00 $0.00 $0.00 $0.00 $0.00 $0.00 $0.00 $0.00 $0.00 $0.00 $0.00 $0.00 $0.00 $0.00 $0.00 $0.00 $0.00 $0.00
  • 2. Diversified Asset Management Portfolio Analysis % Diff. Portfolio S&P 500 Portfolio vs. 2006 11.06% 8.03% 3.03% Year: % Gain / Loss: % Gain / Loss: S&P 500 Asset Name: Initial Value % Gain/(Loss) $ Gain/(Loss) EOY Value SPY $100.00 8.99% $8.99 $108.99 MUNT $100.00 10.00% $10.00 $110.00 PTM $100.00 -10.00% -$10.00 $90.00 IWN $599.00 20.00% $119.80 $718.80 Q $100.00 2.00% $2.00 $102.00 RECT $100.00 1.00% $1.00 $101.00 MDY $100.00 2.00% $2.00 $102.00 IWO $100.00 10.00% $10.00 $110.00 IFU $100.00 10.00% $10.00 $110.00 KWJ $100.00 12.00% $12.00 $112.00 $0.00 $0.00 $0.00 $0.00 $0.00 $0.00 $0.00 $0.00 $0.00 $0.00 $0.00 $0.00 $0.00 $0.00 $0.00 $0.00 $0.00 $0.00 $0.00 $0.00 $0.00 $0.00 $0.00 $0.00 $0.00 $0.00 $0.00 $0.00 $0.00 $0.00 $0.00 $0.00 $0.00 $0.00 $0.00 $0.00 Totals: $1,499.00 11.06% $165.79 $1,664.79
  • 3. Diversified Asset Management Portfolio Analysis % Diff. Portfolio S&P 500 Portfolio vs. 2005 10.82% 8.03% 2.79% Year: % Gain / Loss: % Gain / Loss: S&P 500 Asset Name: Initial Value % Gain/(Loss) $ Gain/(Loss) EOY Value SPY $100.00 8.99% $8.99 $108.99 MUNT $100.00 10.00% $10.00 $110.00 PTM $100.00 -10.00% -$10.00 $90.00 IWN $599.00 20.00% $119.80 $718.80 Q $100.00 2.00% $2.00 $102.00 RECT $100.00 1.00% $1.00 $101.00 MDY $100.00 2.00% $2.00 $102.00 IWO $100.00 4.00% $4.00 $104.00 IFU $100.00 10.00% $10.00 $110.00 KWJ $100.00 12.00% $12.00 $112.00 $200.00 12.00% $24.00 $224.00 0.00% $0.00 $0.00 0.00% $0.00 $0.00 0.00% $0.00 $0.00 0.00% $0.00 $0.00 0.00% $0.00 $0.00 0.00% $0.00 $0.00 0.00% $0.00 $0.00 0.00% $0.00 $0.00 0.00% $0.00 $0.00 0.00% $0.00 $0.00 0.00% $0.00 $0.00 0.00% $0.00 $0.00 0.00% $0.00 $0.00 0.00% $0.00 $0.00 0.00% $0.00 $0.00 0.00% $0.00 $0.00 0.00% $0.00 $0.00 Totals: $1,699.00 10.82% $183.79 $1,882.79
  • 4. Diversified Asset Management Portfolio Analysis % Diff. Portfolio S&P 500 Portfolio vs. 2004 10.66% 8.03% 2.63% Year: % Gain / Loss: % Gain / Loss: S&P 500 Asset Name: Initial Value % Gain/(Loss) $ Gain/(Loss) EOY Value SPY $100.00 8.99% $8.99 $108.99 MUNT $100.00 10.00% $10.00 $110.00 PTM $100.00 -10.00% -$10.00 $90.00 IWN $599.00 20.00% $119.80 $718.80 Q $100.00 2.00% $2.00 $102.00 RECT $100.00 1.00% $1.00 $101.00 MDY $100.00 2.00% $2.00 $102.00 IWO $100.00 4.00% $4.00 $104.00 IFU $100.00 10.00% $10.00 $110.00 KWJ $100.00 12.00% $12.00 $112.00 0.00% $0.00 $0.00 0.00% $0.00 $0.00 0.00% $0.00 $0.00 0.00% $0.00 $0.00 0.00% $0.00 $0.00 0.00% $0.00 $0.00 0.00% $0.00 $0.00 0.00% $0.00 $0.00 0.00% $0.00 $0.00 0.00% $0.00 $0.00 0.00% $0.00 $0.00 0.00% $0.00 $0.00 0.00% $0.00 $0.00 0.00% $0.00 $0.00 0.00% $0.00 $0.00 0.00% $0.00 $0.00 0.00% $0.00 $0.00 0.00% $0.00 $0.00 Totals: $1,499.00 10.66% $159.79 $1,658.79
  • 5. Diversified Asset Management Portfolio Analysis % Diff. Portfolio S&P 500 Portfolio vs. 2003 10.66% 8.03% 2.63% Year: % Gain / Loss: % Gain / Loss: S&P 500 Asset Name: Initial Value % Gain/(Loss) $ Gain/(Loss) EOY Value SPY $100.00 8.99% $8.99 $108.99 MUNT $100.00 10.00% $10.00 $110.00 PTM $100.00 -10.00% -$10.00 $90.00 IWN $599.00 20.00% $119.80 $718.80 Q $100.00 2.00% $2.00 $102.00 RECT $100.00 1.00% $1.00 $101.00 MDY $100.00 2.00% $2.00 $102.00 IWO $100.00 4.00% $4.00 $104.00 IFU $100.00 10.00% $10.00 $110.00 KWJ $100.00 12.00% $12.00 $112.00 0.00% $0.00 $0.00 0.00% $0.00 $0.00 0.00% $0.00 $0.00 0.00% $0.00 $0.00 0.00% $0.00 $0.00 0.00% $0.00 $0.00 0.00% $0.00 $0.00 0.00% $0.00 $0.00 0.00% $0.00 $0.00 0.00% $0.00 $0.00 0.00% $0.00 $0.00 0.00% $0.00 $0.00 0.00% $0.00 $0.00 0.00% $0.00 $0.00 0.00% $0.00 $0.00 0.00% $0.00 $0.00 0.00% $0.00 $0.00 0.00% $0.00 $0.00 Totals: $1,499.00 10.66% $159.79 $1,658.79
  • 6. Diversified Asset Management Portfolio Analysis % Diff. Portfolio S&P 500 Portfolio vs. 2002 10.66% 8.03% 2.63% Year: % Gain / Loss: % Gain / Loss: S&P 500 Asset Name: Initial Value % Gain/(Loss) $ Gain/(Loss) EOY Value SPY $100.00 8.99% $8.99 $108.99 MUNT $100.00 10.00% $10.00 $110.00 PTM $100.00 -10.00% -$10.00 $90.00 IWN $599.00 20.00% $119.80 $718.80 Q $100.00 2.00% $2.00 $102.00 RECT $100.00 1.00% $1.00 $101.00 MDY $100.00 2.00% $2.00 $102.00 IWO $100.00 4.00% $4.00 $104.00 IFU $100.00 10.00% $10.00 $110.00 KWJ $100.00 12.00% $12.00 $112.00 0.00% $0.00 $0.00 0.00% $0.00 $0.00 0.00% $0.00 $0.00 0.00% $0.00 $0.00 0.00% $0.00 $0.00 0.00% $0.00 $0.00 0.00% $0.00 $0.00 0.00% $0.00 $0.00 0.00% $0.00 $0.00 0.00% $0.00 $0.00 0.00% $0.00 $0.00 0.00% $0.00 $0.00 0.00% $0.00 $0.00 0.00% $0.00 $0.00 0.00% $0.00 $0.00 0.00% $0.00 $0.00 0.00% $0.00 $0.00 0.00% $0.00 $0.00 Totals: $1,499.00 10.66% $159.79 $1,658.79
  • 7. Diversified Asset Management Portfolio Analysis % Diff. Portfolio S&P 500 Portfolio vs. 2001 10.66% 8.03% 2.63% Year: % Gain / Loss: % Gain / Loss: S&P 500 Asset Name: Initial Value % Gain/(Loss) $ Gain/(Loss) EOY Value SPY $100.00 8.99% $8.99 $108.99 MUNT $100.00 10.00% $10.00 $110.00 PTM $100.00 -10.00% -$10.00 $90.00 IWN $599.00 20.00% $119.80 $718.80 Q $100.00 2.00% $2.00 $102.00 RECT $100.00 1.00% $1.00 $101.00 MDY $100.00 2.00% $2.00 $102.00 IWO $100.00 4.00% $4.00 $104.00 IFU $100.00 10.00% $10.00 $110.00 KWJ $100.00 12.00% $12.00 $112.00 0.00% $0.00 $0.00 0.00% $0.00 $0.00 0.00% $0.00 $0.00 0.00% $0.00 $0.00 0.00% $0.00 $0.00 0.00% $0.00 $0.00 0.00% $0.00 $0.00 0.00% $0.00 $0.00 0.00% $0.00 $0.00 0.00% $0.00 $0.00 0.00% $0.00 $0.00 0.00% $0.00 $0.00 0.00% $0.00 $0.00 0.00% $0.00 $0.00 0.00% $0.00 $0.00 0.00% $0.00 $0.00 0.00% $0.00 $0.00 0.00% $0.00 $0.00 Totals: $1,499.00 10.66% $159.79 $1,658.79
  • 8. Diversified Asset Management Portfolio Analysis % Diff. Portfolio S&P 500 Portfolio vs. 2000 10.66% 8.03% 2.63% Year: % Gain / Loss: % Gain / Loss: S&P 500 Asset Name: Initial Value % Gain/(Loss) $ Gain/(Loss) EOY Value SPY $100.00 8.99% $8.99 $108.99 MUNT $100.00 10.00% $10.00 $110.00 PTM $100.00 -10.00% -$10.00 $90.00 IWN $599.00 20.00% $119.80 $718.80 Q $100.00 2.00% $2.00 $102.00 RECT $100.00 1.00% $1.00 $101.00 MDY $100.00 2.00% $2.00 $102.00 IWO $100.00 4.00% $4.00 $104.00 IFU $100.00 10.00% $10.00 $110.00 KWJ $100.00 12.00% $12.00 $112.00 0.00% $0.00 $0.00 0.00% $0.00 $0.00 0.00% $0.00 $0.00 0.00% $0.00 $0.00 0.00% $0.00 $0.00 0.00% $0.00 $0.00 0.00% $0.00 $0.00 0.00% $0.00 $0.00 0.00% $0.00 $0.00 0.00% $0.00 $0.00 0.00% $0.00 $0.00 0.00% $0.00 $0.00 0.00% $0.00 $0.00 0.00% $0.00 $0.00 0.00% $0.00 $0.00 0.00% $0.00 $0.00 0.00% $0.00 $0.00 0.00% $0.00 $0.00 Totals: $1,499.00 10.66% $159.79 $1,658.79
  • 9. Diversified Asset Management Portfolio Analysis % Diff. Portfolio S&P 500 Portfolio vs. 1999 10.66% 8.03% 2.63% Year: % Gain / Loss: % Gain / Loss: S&P 500 Asset Name: Initial Value % Gain/(Loss) $ Gain/(Loss) EOY Value SPY $100.00 8.99% $8.99 $108.99 MUNT $100.00 10.00% $10.00 $110.00 PTM $100.00 -10.00% -$10.00 $90.00 IWN $599.00 20.00% $119.80 $718.80 Q $100.00 2.00% $2.00 $102.00 RECT $100.00 1.00% $1.00 $101.00 MDY $100.00 2.00% $2.00 $102.00 IWO $100.00 4.00% $4.00 $104.00 IFU $100.00 10.00% $10.00 $110.00 KWJ $100.00 12.00% $12.00 $112.00 0.00% $0.00 $0.00 0.00% $0.00 $0.00 0.00% $0.00 $0.00 0.00% $0.00 $0.00 0.00% $0.00 $0.00 0.00% $0.00 $0.00 0.00% $0.00 $0.00 0.00% $0.00 $0.00 0.00% $0.00 $0.00 0.00% $0.00 $0.00 0.00% $0.00 $0.00 0.00% $0.00 $0.00 0.00% $0.00 $0.00 0.00% $0.00 $0.00 0.00% $0.00 $0.00 0.00% $0.00 $0.00 0.00% $0.00 $0.00 0.00% $0.00 $0.00 Totals: $1,499.00 10.66% $159.79 $1,658.79
  • 10. Diversified Asset Management Portfolio Analysis % Diff. Portfolio S&P 500 Portfolio vs. 1998 10.66% 8.03% 2.63% Year: % Gain / Loss: % Gain / Loss: S&P 500 Asset Name: Initial Value % Gain/(Loss) $ Gain/(Loss) EOY Value SPY $100.00 8.99% $8.99 $108.99 MUNT $100.00 10.00% $10.00 $110.00 PTM $100.00 -10.00% -$10.00 $90.00 IWN $599.00 20.00% $119.80 $718.80 Q $100.00 2.00% $2.00 $102.00 RECT $100.00 1.00% $1.00 $101.00 MDY $100.00 2.00% $2.00 $102.00 IWO $100.00 4.00% $4.00 $104.00 IFU $100.00 10.00% $10.00 $110.00 KWJ $100.00 12.00% $12.00 $112.00 0.00% $0.00 $0.00 0.00% $0.00 $0.00 0.00% $0.00 $0.00 0.00% $0.00 $0.00 0.00% $0.00 $0.00 0.00% $0.00 $0.00 0.00% $0.00 $0.00 0.00% $0.00 $0.00 0.00% $0.00 $0.00 0.00% $0.00 $0.00 0.00% $0.00 $0.00 0.00% $0.00 $0.00 0.00% $0.00 $0.00 0.00% $0.00 $0.00 0.00% $0.00 $0.00 0.00% $0.00 $0.00 0.00% $0.00 $0.00 0.00% $0.00 $0.00 Totals: $1,499.00 10.66% $159.79 $1,658.79
  • 11. Diversified Asset Management Portfolio Analysis % Diff. Portfolio S&P 500 Portfolio vs. 1997 10.66% 8.00% 2.66% Year: % Gain / Loss: % Gain / Loss: S&P 500 Asset Name: Initial Value % Gain/(Loss) $ Gain/(Loss) EOY Value SPY $100.00 8.99% $8.99 $108.99 MUNT $100.00 10.00% $10.00 $110.00 PTM $100.00 -10.00% -$10.00 $90.00 IWN $599.00 20.00% $119.80 $718.80 Q $100.00 2.00% $2.00 $102.00 RECT $100.00 1.00% $1.00 $101.00 MDY $100.00 2.00% $2.00 $102.00 IWO $100.00 4.00% $4.00 $104.00 IFU $100.00 10.00% $10.00 $110.00 KWJ $100.00 12.00% $12.00 $112.00 0.00% $0.00 $0.00 0.00% $0.00 $0.00 0.00% $0.00 $0.00 0.00% $0.00 $0.00 0.00% $0.00 $0.00 0.00% $0.00 $0.00 0.00% $0.00 $0.00 0.00% $0.00 $0.00 0.00% $0.00 $0.00 0.00% $0.00 $0.00 0.00% $0.00 $0.00 0.00% $0.00 $0.00 0.00% $0.00 $0.00 0.00% $0.00 $0.00 0.00% $0.00 $0.00 0.00% $0.00 $0.00 0.00% $0.00 $0.00 0.00% $0.00 $0.00 Totals: $1,499.00 10.66% $159.79 $1,658.79
  • 12. Diversified Asset Management Portfolio Analysis % Diff. Portfolio S&P 500 Portfolio vs. 1996 10.66% 8.03% 2.63% Year: % Gain / Loss: % Gain / Loss: S&P 500 Asset Name: Initial Value % Gain/(Loss) $ Gain/(Loss) EOY Value SPY $100.00 8.99% $8.99 $108.99 MUNT $100.00 10.00% $10.00 $110.00 PTM $100.00 -10.00% -$10.00 $90.00 IWN $599.00 20.00% $119.80 $718.80 Q $100.00 2.00% $2.00 $102.00 RECT $100.00 1.00% $1.00 $101.00 MDY $100.00 2.00% $2.00 $102.00 IWO $100.00 4.00% $4.00 $104.00 IFU $100.00 10.00% $10.00 $110.00 KWJ $100.00 12.00% $12.00 $112.00 0.00% $0.00 $0.00 0.00% $0.00 $0.00 0.00% $0.00 $0.00 0.00% $0.00 $0.00 0.00% $0.00 $0.00 0.00% $0.00 $0.00 0.00% $0.00 $0.00 0.00% $0.00 $0.00 0.00% $0.00 $0.00 0.00% $0.00 $0.00 0.00% $0.00 $0.00 0.00% $0.00 $0.00 0.00% $0.00 $0.00 0.00% $0.00 $0.00 0.00% $0.00 $0.00 0.00% $0.00 $0.00 0.00% $0.00 $0.00 0.00% $0.00 $0.00 Totals: $1,499.00 10.66% $159.79 $1,658.79