
Recomendados
Más contenido relacionado
Destacado
Destacado (20)
Similar a 10 useful sar (sysstat) examples for unix : linux performance monitoring
Similar a 10 useful sar (sysstat) examples for unix : linux performance monitoring (20)
Más de chinkshady
Más de chinkshady (9)
Último
Último (20)
10 useful sar (sysstat) examples for unix : linux performance monitoring
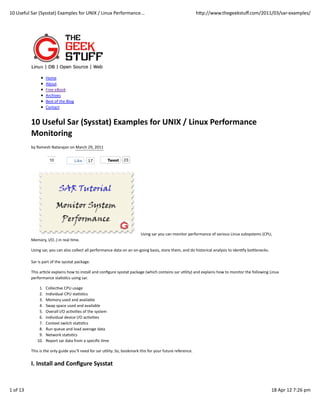
- 1. 10 Useful Sar (Sysstat) Examples for UNIX / Linux Performance... hQp://www.thegeekstuff.com/2011/03/sar-‐examples/ Home About Free eBook Archives Best of the Blog Contact 10 Useful Sar (Sysstat) Examples for UNIX / Linux Performance Monitoring by Ramesh Natarajan on March 29, 2011 10 Like 17 Tweet 23 Using sar you can monitor performance of various Linux subsystems (CPU, Memory, I/O..) in real Nme. Using sar, you can also collect all performance data on an on-‐going basis, store them, and do historical analysis to idenNfy boQlenecks. Sar is part of the sysstat package. This arNcle explains how to install and configure sysstat package (which contains sar uNlity) and explains how to monitor the following Linux performance staNsNcs using sar. 1. CollecNve CPU usage 2. Individual CPU staNsNcs 3. Memory used and available 4. Swap space used and available 5. Overall I/O acNviNes of the system 6. Individual device I/O acNviNes 7. Context switch staNsNcs 8. Run queue and load average data 9. Network staNsNcs 10. Report sar data from a specific Nme This is the only guide you’ll need for sar uNlity. So, bookmark this for your future reference. I. Install and Configure Sysstat 1 of 13 18 Apr 12 7:26 pm
- 2. 10 Useful Sar (Sysstat) Examples for UNIX / Linux Performance... hQp://www.thegeekstuff.com/2011/03/sar-‐examples/ Install Sysstat Package First, make sure the latest version of sar is available on your system. Install it using any one of the following methods depending on your distribuNon. sudo apt-get install sysstat (or) yum install sysstat (or) rpm -ivh sysstat-10.0.0-1.i586.rpm Install Sysstat from Source Download the latest version from sysstat download page. You can also use wget to download the wget http://pagesperso-orange.fr/sebastien.godard/sysstat-10.0.0.tar.bz2 tar xvfj sysstat-10.0.0.tar.bz2 cd sysstat-10.0.0 ./configure --enable-install-cron Note: Make sure to pass the opNon –enable-‐install-‐cron. This does the following automaNcally for you. If you don’t configure sysstat with this opNon, you have to do this ugly job yourself manually. Creates /etc/rc.d/init.d/sysstat Creates appropriate links from /etc/rc.d/rc*.d/ directories to /etc/rc.d/init.d/sysstat to start the sysstat automaNcally during Linux boot process. For example, /etc/rc.d/rc3.d/S01sysstat is linked automaNcally to /etc/rc.d/init.d/sysstat Afer the ./configure, install it as shown below. make make install Note: This will install sar and other systat uNliNes under /usr/local/bin Once installed, verify the sar version using “sar -‐V”. Version 10 is the current stable version of sysstat. $ sar -V sysstat version 10.0.0 (C) Sebastien Godard (sysstat orange.fr) Finally, make sure sar works. For example, the following gives the system CPU staNsNcs 3 Nmes (with 1 second interval). $ sar 1 3 Linux 2.6.18-194.el5PAE (dev-db) 03/26/2011 _i686_ (8 CPU) 01:27:32 PM CPU %user %nice %system %iowait %steal %idle 01:27:33 PM all 0.00 0.00 0.00 0.00 0.00 100.00 01:27:34 PM all 0.25 0.00 0.25 0.00 0.00 99.50 01:27:35 PM all 0.75 0.00 0.25 0.00 0.00 99.00 Average: all 0.33 0.00 0.17 0.00 0.00 99.50 UGliGes part of Sysstat Following are the other sysstat uNliNes. sar collects and displays ALL system acNviNes staNsNcs. sadc stands for “system acNvity data collector”. This is the sar backend tool that does the data collecNon. 2 of 13 18 Apr 12 7:26 pm
- 3. 10 Useful Sar (Sysstat) Examples for UNIX / Linux Performance... hQp://www.thegeekstuff.com/2011/03/sar-‐examples/ sa1 stores system acNviNes in binary data file. sa1 depends on sadc for this purpose. sa1 runs from cron. sa2 creates daily summary of the collected staNsNcs. sa2 runs from cron. sadf can generate sar report in CSV, XML, and various other formats. Use this to integrate sar data with other tools. iostat generates CPU, I/O staNsNcs mpstat displays CPU staNsNcs. pidstat reports staNsNcs based on the process id (PID) nfsiostat displays NFS I/O staNsNcs. cifsiostat generates CIFS staNsNcs. This arNcle focuses on sysstat fundamentals and sar uNlity. Collect the sar staGsGcs using cron job – sa1 and sa2 Create sysstat file under /etc/cron.d directory that will collect the historical sar data. # vi /etc/cron.d/sysstat */10 * * * * root /usr/local/lib/sa/sa1 1 1 53 23 * * * root /usr/local/lib/sa/sa2 -A If you’ve installed sysstat from source, the default locaNon of sa1 and sa2 is /usr/local/lib/sa. If you’ve installed using your distribuNon update method (for example: yum, up2date, or apt-‐get), this might be /usr/lib/sa/sa1 and /usr/lib/sa/sa2. Note: To understand cron entries, read Linux Crontab: 15 Awesome Cron Job Examples. /usr/local/lib/sa/sa1 This runs every 10 minutes and collects sar data for historical reference. If you want to collect sar staNsNcs every 5 minutes, change */10 to */5 in the above /etc/cron.d/sysstat file. This writes the data to /var/log/sa/saXX file. XX is the day of the month. saXX file is a binary file. You cannot view its content by opening it in a text editor. For example, If today is 26th day of the month, sa1 writes the sar data to /var/log/sa/sa26 You can pass two parameters to sa1: interval (in seconds) and count. In the above crontab example: sa1 1 1 means that sa1 collects sar data 1 Nme with 1 second interval (for every 10 mins). /usr/local/lib/sa/sa2 This runs close to midnight (at 23:53) to create the daily summary report of the sar data. sa2 creates /var/log/sa/sarXX file (Note that this is different than saXX file that is created by sa1). This sarXX file created by sa2 is an ascii file that you can view it in a text editor. This will also remove saXX files that are older than a week. So, write a quick shell script that runs every week to copy the /var/log/sa/* files to some other directory to do historical sar data analysis. II. 10 PracGcal Sar Usage Examples There are two ways to invoke sar. 1. sar followed by an opNon (without specifying a saXX data file). This will look for the current day’s saXX data file and report the performance data that was recorded unNl that point for the current day. 2. sar followed by an opNon, and addiNonally specifying a saXX data file using -‐f opNon. This will report the performance data for that parNcular day. i.e XX is the day of the month. In all the examples below, we are going to explain how to view certain performance data for the current day. To look for a specific day, add “-‐f /var/log/sa/saXX” at the end of the sar command. All the sar command will have the following as the 1st line in its output. $ sar -u Linux 2.6.18-194.el5PAE (dev-db) 03/26/2011 _i686_ (8 CPU) Linux 2.6.18-‐194.el5PAE – Linux kernel version of the system. (dev-‐db) – The hostname where the sar data was collected. 3 of 13 18 Apr 12 7:26 pm
- 4. 10 Useful Sar (Sysstat) Examples for UNIX / Linux Performance... hQp://www.thegeekstuff.com/2011/03/sar-‐examples/ 03/26/2011 – The date when the sar data was collected. _i686_ – The system architecture (8 CPU) – Number of CPUs available on this system. On mulN core systems, this indicates the total number of cores. 1. CPU Usage of ALL CPUs (sar -‐u) This gives the cumulaNve real-‐Nme CPU usage of all CPUs. “1 3″₺ reports for every 1 seconds a total of 3 Nmes. Most likely you’ll focus on the last field “%idle” to see the cpu load. $ sar -u 1 3 Linux 2.6.18-194.el5PAE (dev-db) 03/26/2011 _i686_ (8 CPU) 01:27:32 PM CPU %user %nice %system %iowait %steal %idle 01:27:33 PM all 0.00 0.00 0.00 0.00 0.00 100.00 01:27:34 PM all 0.25 0.00 0.25 0.00 0.00 99.50 01:27:35 PM all 0.75 0.00 0.25 0.00 0.00 99.00 Average: all 0.33 0.00 0.17 0.00 0.00 99.50 Following are few variaNons: sar -‐u Displays CPU usage for the current day that was collected unNl that point. sar -‐u 1 3 Displays real Nme CPU usage every 1 second for 3 Nmes. sar -‐u ALL Same as “sar -‐u” but displays addiNonal fields. sar -‐u ALL 1 3 Same as “sar -‐u 1 3″₺ but displays addiNonal fields. sar -‐u -‐f /var/log/sa/sa10 Displays CPU usage for the 10day of the month from the sa10 file. 2. CPU Usage of Individual CPU or Core (sar -‐P) If you have 4 Cores on the machine and would like to see what the individual cores are doing, do the following. “-‐P ALL” indicates that it should displays staNsNcs for ALL the individual Cores. In the following example under “CPU” column 0, 1, 2, and 3 indicates the corresponding CPU core numbers. $ sar -P ALL 1 1 Linux 2.6.18-194.el5PAE (dev-db) 03/26/2011 _i686_ (8 CPU) 01:34:12 PM CPU %user %nice %system %iowait %steal %idle 01:34:13 PM all 11.69 0.00 4.71 0.69 0.00 82.90 01:34:13 PM 0 35.00 0.00 6.00 0.00 0.00 59.00 01:34:13 PM 1 22.00 0.00 5.00 0.00 0.00 73.00 01:34:13 PM 2 3.00 0.00 1.00 0.00 0.00 96.00 01:34:13 PM 3 0.00 0.00 0.00 0.00 0.00 100.00 “-‐P 1″₺ indicates that it should displays staNsNcs only for the 2nd Core. (Note that Core number starts from 0). $ sar -P 1 1 1 Linux 2.6.18-194.el5PAE (dev-db) 03/26/2011 _i686_ (8 CPU) 01:36:25 PM CPU %user %nice %system %iowait %steal %idle 01:36:26 PM 1 8.08 0.00 2.02 1.01 0.00 88.89 Following are few variaNons: sar -‐P ALL Displays CPU usage broken down by all cores for the current day. sar -‐P ALL 1 3 Displays real Nme CPU usage for ALL cores every 1 second for 3 Nmes (broken down by all cores). sar -‐P 1 Displays CPU usage for core number 1 for the current day. sar -‐P 1 1 3 Displays real Nme CPU usage for core number 1, every 1 second for 3 Nmes. sar -‐P ALL -‐f /var/log/sa/sa10 Displays CPU usage broken down by all cores for the 10day day of the month from sa10 file. 3. Memory Free and Used (sar -‐r) This reports the memory staNsNcs. “1 3″₺ reports for every 1 seconds a total of 3 Nmes. Most likely you’ll focus on “kbmemfree” and 4 of 13 18 Apr 12 7:26 pm
- 5. 10 Useful Sar (Sysstat) Examples for UNIX / Linux Performance... hQp://www.thegeekstuff.com/2011/03/sar-‐examples/ “kbmemused” for free and used memory. $ sar -r 1 3 Linux 2.6.18-194.el5PAE (dev-db) 03/26/2011 _i686_ (8 CPU) 07:28:06 AM kbmemfree kbmemused %memused kbbuffers kbcached kbcommit %commit kbactive kbinact 07:28:07 AM 6209248 2097432 25.25 189024 1796544 141372 0.85 1921060 88204 07:28:08 AM 6209248 2097432 25.25 189024 1796544 141372 0.85 1921060 88204 07:28:09 AM 6209248 2097432 25.25 189024 1796544 141372 0.85 1921060 88204 Average: 6209248 2097432 25.25 189024 1796544 141372 0.85 1921060 88204 Following are few variaNons: sar -‐r sar -‐r 1 3 sar -‐r -‐f /var/log/sa/sa10 4. Swap Space Used (sar -‐S) This reports the swap staNsNcs. “1 3″₺ reports for every 1 seconds a total of 3 Nmes. If the “kbswpused” and “%swpused” are at 0, then your system is not swapping. $ sar -S 1 3 Linux 2.6.18-194.el5PAE (dev-db) 03/26/2011 _i686_ (8 CPU) 07:31:06 AM kbswpfree kbswpused %swpused kbswpcad %swpcad 07:31:07 AM 8385920 0 0.00 0 0.00 07:31:08 AM 8385920 0 0.00 0 0.00 07:31:09 AM 8385920 0 0.00 0 0.00 Average: 8385920 0 0.00 0 0.00 Following are few variaNons: sar -‐S sar -‐S 1 3 sar -‐S -‐f /var/log/sa/sa10 Notes: Use “sar -‐R” to idenNfy number of memory pages freed, used, and cached per second by the system. Use “sar -‐H” to idenNfy the hugepages (in KB) that are used and available. Use “sar -‐B” to generate paging staNsNcs. i.e Number of KB paged in (and out) from disk per second. Use “sar -‐W” to generate page swap staNsNcs. i.e Page swap in (and out) per second. 5. Overall I/O AcGviGes (sar -‐b) This reports I/O staNsNcs. “1 3″₺ reports for every 1 seconds a total of 3 Nmes. Following fields are displays in the example below. tps – TransacNons per second (this includes both read and write) rtps – Read transacNons per second wtps – Write transacNons per second bread/s – Bytes read per second bwrtn/s – Bytes wriQen per second $ sar -b 1 3 Linux 2.6.18-194.el5PAE (dev-db) 03/26/2011 _i686_ (8 CPU) 01:56:28 PM tps rtps wtps bread/s bwrtn/s 01:56:29 PM 346.00 264.00 82.00 2208.00 768.00 01:56:30 PM 100.00 36.00 64.00 304.00 816.00 01:56:31 PM 282.83 32.32 250.51 258.59 2537.37 5 of 13 18 Apr 12 7:26 pm
- 6. 10 Useful Sar (Sysstat) Examples for UNIX / Linux Performance... hQp://www.thegeekstuff.com/2011/03/sar-‐examples/ Average: 242.81 111.04 131.77 925.75 1369.90 Following are few variaNons: sar -‐b sar -‐b 1 3 sar -‐b -‐f /var/log/sa/sa10 Note: Use “sar -‐v” to display number of inode handlers, file handlers, and pseudo-‐terminals used by the system. 6. Individual Block Device I/O AcGviGes (sar -‐d) To idenNfy the acNviNes by the individual block devices (i.e a specific mount point, or LUN, or parNNon), use “sar -‐d” $ sar -d 1 1 Linux 2.6.18-194.el5PAE (dev-db) 03/26/2011 _i686_ (8 CPU) 01:59:45 PM DEV tps rd_sec/s wr_sec/s avgrq-sz avgqu-sz await svctm %util 01:59:46 PM dev8-0 1.01 0.00 0.00 0.00 0.00 4.00 1.00 0.10 01:59:46 PM dev8-1 1.01 0.00 0.00 0.00 0.00 4.00 1.00 0.10 01:59:46 PM dev120-64 3.03 64.65 0.00 21.33 0.03 9.33 5.33 1.62 01:59:46 PM dev120-65 3.03 64.65 0.00 21.33 0.03 9.33 5.33 1.62 01:59:46 PM dev120-0 8.08 0.00 105.05 13.00 0.00 0.38 0.38 0.30 01:59:46 PM dev120-1 8.08 0.00 105.05 13.00 0.00 0.38 0.38 0.30 01:59:46 PM dev120-96 1.01 8.08 0.00 8.00 0.01 9.00 9.00 0.91 01:59:46 PM dev120-97 1.01 8.08 0.00 8.00 0.01 9.00 9.00 0.91 In the above example “DEV” indicates the specific block device. For example: “dev53-‐1″₺ means a block device with 53 as major number, and 1 as minor number. The device name (DEV column) can display the actual device name (for example: sda, sda1, sdb1 etc.,), if you use the -‐p opNon (preQy print) as shown below. $ sar -p -d 1 1 Linux 2.6.18-194.el5PAE (dev-db) 03/26/2011 _i686_ (8 CPU) 01:59:45 PM DEV tps rd_sec/s wr_sec/s avgrq-sz avgqu-sz await svctm %util 01:59:46 PM sda 1.01 0.00 0.00 0.00 0.00 4.00 1.00 0.10 01:59:46 PM sda1 1.01 0.00 0.00 0.00 0.00 4.00 1.00 0.10 01:59:46 PM sdb1 3.03 64.65 0.00 21.33 0.03 9.33 5.33 1.62 01:59:46 PM sdc1 3.03 64.65 0.00 21.33 0.03 9.33 5.33 1.62 01:59:46 PM sde1 8.08 0.00 105.05 13.00 0.00 0.38 0.38 0.30 01:59:46 PM sdf1 8.08 0.00 105.05 13.00 0.00 0.38 0.38 0.30 01:59:46 PM sda2 1.01 8.08 0.00 8.00 0.01 9.00 9.00 0.91 01:59:46 PM sdb2 1.01 8.08 0.00 8.00 0.01 9.00 9.00 0.91 Following are few variaNons: sar -‐d sar -‐d 1 3 sar -‐d -‐f /var/log/sa/sa10 sar -‐p -‐d 7. Display context switch per second (sar -‐w) This reports the total number of processes created per second, and total number of context switches per second. “1 3″₺ reports for every 1 seconds a total of 3 Nmes. $ sar -w 1 3 Linux 2.6.18-194.el5PAE (dev-db) 03/26/2011 _i686_ (8 CPU) 08:32:24 AM proc/s cswch/s 08:32:25 AM 3.00 53.00 6 of 13 18 Apr 12 7:26 pm
- 7. 10 Useful Sar (Sysstat) Examples for UNIX / Linux Performance... hQp://www.thegeekstuff.com/2011/03/sar-‐examples/ 08:32:26 AM 4.00 61.39 08:32:27 AM 2.00 57.00 Following are few variaNons: sar -‐w sar -‐w 1 3 sar -‐w -‐f /var/log/sa/sa10 8. Reports run queue and load average (sar -‐q) This reports the run queue size and load average of last 1 minute, 5 minutes, and 15 minutes. “1 3″₺ reports for every 1 seconds a total of 3 Nmes. $ sar -q 1 3 Linux 2.6.18-194.el5PAE (dev-db) 03/26/2011 _i686_ (8 CPU) 06:28:53 AM runq-sz plist-sz ldavg-1 ldavg-5 ldavg-15 blocked 06:28:54 AM 0 230 2.00 3.00 5.00 0 06:28:55 AM 2 210 2.01 3.15 5.15 0 06:28:56 AM 2 230 2.12 3.12 5.12 0 Average: 3 230 3.12 3.12 5.12 0 Note: The “blocked” column displays the number of tasks that are currently blocked and waiNng for I/O operaNon to complete. Following are few variaNons: sar -‐q sar -‐q 1 3 sar -‐q -‐f /var/log/sa/sa10 9. Report network staGsGcs (sar -‐n) This reports various network staNsNcs. For example: number of packets received (transmiQed) through the network card, staNsNcs of packet failure etc.,. “1 3″₺ reports for every 1 seconds a total of 3 Nmes. sar -n KEYWORD KEYWORD can be one of the following: DEV – Displays network devices vital staNsNcs for eth0, eth1, etc., EDEV – Display network device failure staNsNcs NFS – Displays NFS client acNviNes NFSD – Displays NFS server acNviNes SOCK – Displays sockets in use for IPv4 IP – Displays IPv4 network traffic EIP – Displays IPv4 network errors ICMP – Displays ICMPv4 network traffic EICMP – Displays ICMPv4 network errors TCP – Displays TCPv4 network traffic ETCP – Displays TCPv4 network errors UDP – Displays UDPv4 network traffic SOCK6, IP6, EIP6, ICMP6, UDP6 are for IPv6 ALL – This displays all of the above informaNon. The output will be very long. $ sar -n DEV 1 1 Linux 2.6.18-194.el5PAE (dev-db) 03/26/2011 _i686_ (8 CPU) 01:11:13 PM IFACE rxpck/s txpck/s rxbyt/s txbyt/s rxcmp/s txcmp/s rxmcst/s 01:11:14 PM lo 0.00 0.00 0.00 0.00 0.00 0.00 0.00 01:11:14 PM eth0 342.57 342.57 93923.76 141773.27 0.00 0.00 0.00 01:11:14 PM eth1 0.00 0.00 0.00 0.00 0.00 0.00 0.00 7 of 13 18 Apr 12 7:26 pm
- 8. 10 Useful Sar (Sysstat) Examples for UNIX / Linux Performance... hQp://www.thegeekstuff.com/2011/03/sar-‐examples/ 10. Report Sar Data Using Start Time (sar -‐s) When you view historic sar data from the /var/log/sa/saXX file using “sar -‐f ” opNon, it displays all the sar data for that specific day starNng from 12:00 a.m for that day. Using “-‐s hh:mi:ss” opNon, you can specify the start Nme. For example, if you specify “sar -‐s 10:00:00″₺, it will display the sar data starNng from 10 a.m (instead of starNng from midnight) as shown below. You can combine -‐s opNon with other sar opNon. For example, to report the load average on 26th of this month starNng from 10 a.m in the morning, combine the -‐q and -‐s opNon as shown below. $ sar -q -f /var/log/sa/sa23 -s 10:00:01 Linux 2.6.18-194.el5PAE (dev-db) 03/26/2011 _i686_ (8 CPU) 10:00:01 AM runq-sz plist-sz ldavg-1 ldavg-5 ldavg-15 blocked 10:10:01 AM 0 127 2.00 3.00 5.00 0 10:20:01 AM 0 127 2.00 3.00 5.00 0 ... 11:20:01 AM 0 127 5.00 3.00 3.00 0 12:00:01 PM 0 127 4.00 2.00 1.00 0 There is no opNon to limit the end-‐Nme. You just have to get creaNve and use head command as shown below. For example, starNng from 10 a.m, if you want to see 7 entries, you have to pipe the above output to “head -‐n 10″₺. $ sar -q -f /var/log/sa/sa23 -s 10:00:01 | head -n 10 Linux 2.6.18-194.el5PAE (dev-db) 03/26/2011 _i686_ (8 CPU) 10:00:01 AM runq-sz plist-sz ldavg-1 ldavg-5 ldavg-15 blocked 10:10:01 AM 0 127 2.00 3.00 5.00 0 10:20:01 AM 0 127 2.00 3.00 5.00 0 10:30:01 AM 0 127 3.00 5.00 2.00 0 10:40:01 AM 0 127 4.00 2.00 1.00 2 10:50:01 AM 0 127 3.00 5.00 5.00 0 11:00:01 AM 0 127 2.00 1.00 6.00 0 11:10:01 AM 0 127 1.00 3.00 7.00 2 There is lot more to cover in Linux performance monitoring and tuning. We are only gerng started. More arNcles to come in the performance series. Previous arNcles in the Linux performance monitoring and tuning series: Linux Performance Monitoring and Tuning IntroducNon 15 PracNcal Linux Top Command Examples 10 Tweet 23 Like 17 Share Comment If you enjoyed this arGcle, you might also like.. 1. 50 Linux Sysadmin Tutorials Awk IntroducNon – 7 Awk Print Examples 2. 50 Most Frequently Used Linux Commands (With Examples) Advanced Sed SubsNtuNon Examples 3. Top 25 Best Linux Performance Monitoring and Debugging Tools 8 EssenNal Vim Editor NavigaNon Fundamentals 4. Mommy, I found it! – 15 PracNcal Linux Find Command Examples 25 Most Frequently Used Linux IPTables Rules Examples 5. Linux 101 Hacks 2nd EdiNon eBook Turbocharge PuTTY with 12 Powerful Add-‐Ons 8 of 13 18 Apr 12 7:26 pm
- 9. 10 Useful Sar (Sysstat) Examples for UNIX / Linux Performance... hQp://www.thegeekstuff.com/2011/03/sar-‐examples/ Tags: Linux Sar Report, Sar RedHat Examples, Sar Report Linux, Sar Ubuntu, Unix Sar UNlity, Unix Sar wio { 16 comments… read them below or add one } 1 jaxxm March 29, 2011 at 3:08 am Wow, really cool. keep up the good work. This is the most informaNve site on linux. Thanks again. 2 Felix Frank March 29, 2011 at 6:56 am Thanks Ramesh for the nice overview of sar’s opNons. 3 Alex March 29, 2011 at 11:26 am Excelente información, he venido observando tu pagina lo que has publicado esta al día, felicitaciones por tu familia, salu2 desde Venezuela ——–Spanish to English translaNon———-‐ Excellent informaNon, I have been watching your site what you have posted this a day, congratulaNons on your family, salu2 from Venezuela 4 Patrick March 29, 2011 at 8:49 pm In regards to secNon 10 there is an “end” opNon. Sar accepts Nmes in 24 hour format. For instance: sar -‐s 21:00:00 -‐e 21:30:00 -‐q The above would show load staNsNcs starNng at 9:00PM and end at 9:30PM. 5 Phani March 31, 2011 at 7:41 am Thnk you Ramesh Natarajan. nice post 6 MarNn March 31, 2011 at 12:52 pm Thanks Ramesh … I’ve used sar for a while, and your thorugh descripNon sNll adds value. Now off to changing my standard script for collecNng performance data to the management server. Regards MarNn Rønde 7 Rajinder Yadav April 17, 2011 at 11:47 pm Ramesh, you did an excellent job of covering the sar tools, this page is definitely going into my bookmark! Kind Regards, 9 of 13 18 Apr 12 7:26 pm
- 10. 10 Useful Sar (Sysstat) Examples for UNIX / Linux Performance... hQp://www.thegeekstuff.com/2011/03/sar-‐examples/ Rajinder Yadav 8 Kapil June 27, 2011 at 1:46 am Ramesh, Great document for learning sar uNlity for performance. Regards Kapil 9 KirN Ranjan Nayak August 1, 2011 at 3:13 am Awesome tutorial it is this… thanks a lot for helping others. 10 Kamal Kishore August 9, 2011 at 6:12 am Hi Ramesh, In the point no. 10, end opNon can be use as follows. sar -‐q -‐f /var/log/sa/sa08 -‐s 09:04:00 -‐e 15:00:00 this will display between 09:04:00 a.m. to 15:00:00 (3 p.m.) output Thanks to you for such a nice arNcal. Regards, Kamal 11 Ashok September 7, 2011 at 7:23 am “There is no opNon to limit the end-‐Nme. You just have to get creaNve and use head command as shown below.” “sar” command has opNon for End-‐Nme. Something like this: sar -‐r -‐f /var/log/sa/sa07 -‐s 03:00:01 -‐e 05:00:01 hQp://ashok-‐linux-‐Nps.blogspot.com/2011/08/how-‐to-‐analyze-‐past-‐system-‐performance.html Thanks Ashok 12 Chaitanya November 11, 2011 at 4:33 pm very nice arNcle helped me a lot 13 sid November 21, 2011 at 4:36 pm How can we generate graphs and reports from this data? 14 Greg March 12, 2012 at 1:37 pm I am trying to prove to a customer that they have their file systems set up wrong. They have mulNple applicaNons, SAS, ndm, and other running on a system and are using one large mulN-‐terebyte file system for all of them. They keep wanNng to blame disk I/O for poor performance. I realize that is probably the problem but should be addressed by chaning the file system layout to minimize issues first. If you could guide me in how to present either sar, iostat, vmstat, or some other informaNon to them to prove this I would appreciate it. 15 daniel March 25, 2012 at 6:29 pm i am dying to know how to figure this out: I have download the latest version of sysstat (10.0.4) and already did the 2 iniNal steps for the installaNon into my Centos 5 (on a VMWare). The problem is when i type the command “make” afer compiling with “./configure”. I got many errors that don’t let me install the sysstat. This are some of the errors i got: make: o: No se encontró el programa (english= “didn’t find the program) make: [nls/sv.gmo] Error 127 (no Nene efecto) 16 Daniel March 27, 2012 at 9:08 am 10 of 13 18 Apr 12 7:26 pm
- 11. 10 Useful Sar (Sysstat) Examples for UNIX / Linux Performance... hQp://www.thegeekstuff.com/2011/03/sar-‐examples/ you should be able to run yum install sysstat and it will hopefully resolve dependacies for you Leave a Comment Name E-‐mail Website NoNfy me of followup comments via e-‐mail Submit Previous post: Quick Info about the Upcoming eBook Next post: Get Your Copy of Sed and Awk 101 Hacks eBook Sign up for our free email newsleQer you@address.com Sign Up RSS TwiQer Facebook Search EBOOKS 11 of 13 18 Apr 12 7:26 pm
- 12. 10 Useful Sar (Sysstat) Examples for UNIX / Linux Performance... hQp://www.thegeekstuff.com/2011/03/sar-‐examples/ POPULAR POSTS 12 Amazing and EssenNal Linux Books To Enrich Your Brain and Library 50 UNIX / Linux Sysadmin Tutorials 50 Most Frequently Used UNIX / Linux Commands (With Examples) How To Be ProducNve and Get Things Done Using GTD 30 Things To Do When you are Bored and have a Computer Linux Directory Structure (File System Structure) Explained with Examples Linux Crontab: 15 Awesome Cron Job Examples Get a Grip on the Grep! – 15 PracNcal Grep Command Examples Unix LS Command: 15 PracNcal Examples 15 Examples To Master Linux Command Line History Top 10 Open Source Bug Tracking System Vi and Vim Macro Tutorial: How To Record and Play Mommy, I found it! -‐-‐ 15 PracNcal Linux Find Command Examples 15 Awesome Gmail Tips and Tricks 15 Awesome Google Search Tips and Tricks RAID 0, RAID 1, RAID 5, RAID 10 Explained with Diagrams Can You Top This? 15 PracNcal Linux Top Command Examples Top 5 Best System Monitoring Tools Top 5 Best Linux OS DistribuNons How To Monitor Remote Linux Host using Nagios 3.0 Awk IntroducNon Tutorial – 7 Awk Print Examples How to Backup Linux? 15 rsync Command Examples The UlNmate Wget Download Guide With 15 Awesome Examples Top 5 Best Linux Text Editors Packet Analyzer: 15 TCPDUMP Command Examples The UlNmate Bash Array Tutorial with 15 Examples 3 Steps to Perform SSH Login Without Password Using ssh-‐keygen & ssh-‐copy-‐id Unix Sed Tutorial: Advanced Sed SubsNtuNon Examples UNIX / Linux: 10 Netstat Command Examples The UlNmate Guide for CreaNng Strong Passwords 12 of 13 18 Apr 12 7:26 pm
- 13. 10 Useful Sar (Sysstat) Examples for UNIX / Linux Performance... hQp://www.thegeekstuff.com/2011/03/sar-‐examples/ 6 Steps to Secure Your Home Wireless Network Turbocharge PuTTY with 12 Powerful Add-‐Ons About The Geek Stuff My name is Ramesh Natarajan. I will be posNng instrucNon guides, how-‐to, troubleshooNng Nps and tricks on Linux, database, hardware, security and web. My focus is to write arNcles that will either teach you or help you resolve a problem. Read more about Ramesh Natarajan and the blog. Support Us Support this blog by purchasing one of my ebooks. Bash 101 Hacks eBook Sed and Awk 101 Hacks eBook Vim 101 Hacks eBook Nagios Core 3 eBook Contact Us Email Me : Use this Contact Form to get in touch me with your comments, quesNons or suggesNons about this site. You can also simply drop me a line to say hello!. Follow us on TwiQer Become a fan on Facebook Copyright © 2008–2012 Ramesh Natarajan. All rights reserved | Terms of Service | AdverNse 13 of 13 18 Apr 12 7:26 pm