Call Girls Visakhapatnam Just Call 8250077686 Top Class Call Girl Service Ava...
Ectopic pregnancy 2
1. British Journal of Obstetrics and Gynaecology
March 2000, V01107, pp. 369-374
Trends in the incidence of ectopic pregnancy in
England and Wales from 1966 to 1996
*M. Rajkhowa Subspecialist Trainee (ReproductiveMedicine), *M. R. Glass Consultant (Obstetrics and Gynaecology),
*A. J. Rutherford Consultant (Obstetrics and Gynaecology),*A. € . Consultant (obstetrics and Gynaecology),
Balen
I
tV. Sharma Consultant (Obstetricsand Gynaecology),SH. S . Cuckle Professor (ReproductiveEpidemiology)
*Reproductive Medicine Unit, the General Infirmary at Leeds; tAssisted Conception Unit, St James’s University Hospital, Leeds;
$Centre for Reproduction, Growth and Development, School of Medicine, Leeds
Objective To examine the incidence of ectopic pregnancy over the period 1966to 1996.
Setting England and Wales.
Design Use of official statistics on hospital discharges, maternities, legal abortions and estimated popu-
lations of women aged 15-44 years.
Main outcome measures Incidence rates of ectopic pregnancies.
Results Between 1966 to 1970 and 1994 to 1996 the recorded incidence increased 4.5-fold from 3.45
to 15.5 per 1000 maternities, 3.8-fold from 3.25 to 12.4 per 1000 pregnancies and 3.1-foldfrom 30.2
to 94-8 per 100,OOO women aged 1 5 4 . The rate of increase was not uniform. Incidence approxi-
mately doubled between 1966 and 1985, when the official data collection system changed. By 1989,
when data from the new system became available, there had been a further almost doubling of
recorded incidence. Subsequently, the upward trend appears to have continued until 1991 to 1992
and has remained stable in the last four years of the study. The trends were similar in each of three
10-year age groups.
Conclusions The recorded incidence of ectopic pregnancy has increased markedly over the last three
decades. This may be partly due to artefacts of data recording and more sensitive diagnostic tests, but
it is likely that the actual incidence has increased, probably due to a sexually transmitted agent.
INTRODUCTION 1971 and 1972 were much higher (4.0 and 4.1, respec-
tively). There have not been any national statistics pub-
Ectopic pregnancy is of considerable medical impor-
lished since 1972, but a study of a single teaching
tance because it is associated with maternal death, steril-
hospital in Sheffield reported an increase from 8.6 per
ity and adverse outcome in subsequent pregnancies. In
1000 live births in 1977 to 16.5 in 1988-19906.
1988-1990 the death rate in England and Wales was 0.5
We therefore carried out a study of national ectopic
per lo00 estimated ectopic pregnancies and in
pregnancy incidence rates for more recent decades using
1994-1996 that for the United Kingdom was 0.4 per
official statistics. This allowed an assessment of
1000’. In many parts of the world there has been a dra-
whether, as in other countries, there has been an increase
matic increase in incidence over recent decades with
in incidence over time.
most studies showing at least a doubling of the rate2.For
example, in the United States there has been an increase
from 4.5 ectopic pregnancies per 1000 registered preg- METHODS AND RESULTS
nancies in 1970 to 19.7 per 1000 in 1992”‘.
In keeping with other studies, we have expressed
Incidence rates for ectopic pregnancies in England
ectopic pregnancy incidence rates either per 1000
and Wales have been published for the period
maternities, per lo00 pregnancies, including legal abor-
1966-1972 based on national statistics5.There was a
tions, and per 100,000 women of reproductive age,
small increase in incidence between 1966 and 1970
taken to be 1 5 4 4 years.
(from 3.1 to 3.5 per 1000 pregnancies), but the rates in Information on the number of women with an ectopic
Dregnancv was obtained from official statistics of the
X Y
Correspondence: Dr M. Rajkhowa, Reproductive Medicine Hospital Inpatient Enquiry which collected data until
Unit, The ClarendonWing, the General Infmary at Leeds, Leeds 1985 and the Hospital Episode Statistics which started
LS2 9NS, UK. in April 1987. Both systems were used to compile
0 RCOG 2000 British Journal of Obstetrics and Gynaecology 369
2. 370 M . RAJKHOWA E T A L .
information on hospital admissions from the national maternities, a 3.8-fold increase from 3.26 to 12.4 per
standard discharge sheet used throughout the NHS. 1000 pregnancies and 3.1-fold from 30.2 to 94.8 per
Hospital Inpatient Enquiry collected data for England 100,000 women aged 1 5 4 4 .
and Wales until 1981, and for England only from 1982 Table 2 shows that the risk of a given pregnancy being
to 1985. A 10% sample of sheets were examined and ectopic is more than double at age 3 5 4 4 compared with
used to estimate the total number of admissions for each 15-24, although the probability having an ectopic preg-
disease. The Hospital Episode Statistics collected data nancy is highest at age 25-34 since this is the most fer-
for England only and examined a 25% sample of sheets tile group. However, the trends in incidence over time
until April 1994 when all sheets were used. The dis- were similar in magnitude for women in each of these
charge sheet uses the International Classification of Dis- broad age groups.
ease (ICD) system to code each disease. During the
study period the codes relating to ectopic pregnancy
DISCUSSION
changed from the 8th revision (until 1978), the 9th revi-
sion (1979-1994) and the 10th revision thereafter. We have shown that the recorded incidence of ectopic
For the period 1966-1972, the annual number of pregnancy in England and Wales has increased
ectopic pregnancies was obtained from the publication markedly in recent decades reaching a peak incidence
of Beral’ and for 1973-1985 from published statistics by 1991-1992, after which it appears to have remained
of the Hospital Inpatient Enquiry’. For the period stable. There are a number of possible explanations for
1989-1996 the Department of Health provided unpub- this including both statistical artefact and an underlying
lished Hospital Episode Statistics for the purposes of increase in exposure to a causative agent. These results
this study, as the published statistics combined all com- have also to be interpreted in the light of the greater
plications of pregnancy into a single figure*.There was availability of sensitive diagnostic tests, earlier referral
no information from the Hospital Episode Statistics on of patients, and the major advances in the diagnosis of
ectopic pregnancies in 1987 and 1988. The number of ectopic pregnancy in the past two decades during the
ectopic pregnancies in each of three age groups (15-24, course of the study. If the trends are real there is serious
25-34 and 3 5 4 4 years) was obtained for 1966-1972 cause for concern because of the important immediate
from Beral’ and for 1979-1985 and 1989-1996 from and delayed sequelae.
the Department of Heath using unpublished data from The maternal age distribution has changed over the
both the Hospital Inpatient Enquiry and the Hospital study period. Thus 44% of pregnancies in 1966 were in
Episode Statistics. women aged 15-24; by 1996 the proportion was 27%.
Information on the total number of maternities (live Since the risk of ectopic pregnancy increases with age
and stillbirths) in England and Wales from 1966-1981 this will have contributed to the observed upward trend.
and in England thereafter was obtained from published However, the effect is relatively small and the incidence
official statistics of birth notifications’. Similarly, the trend was seen within all age groups.
number of legal abortions during this period were There have been two major advances in the diagnosis
obtained from published statistics on notifications under of ectopic pregnancy in the course of the study. The
the 1967 Act”), and the total number of women aged introduction of laparoscopy in the late 1960’s had a
15-44 years from official estimates of the mid-year pop- major impact on the management of suspected ectopic
ulation”. All three sources publish data broken down pregnancy. The routine use of laparoscopy by 1980’s
into the three age groups, except for maternities in Eng- short circuited the prolonged hospitalisation and per-
land, which were estimated from the England and Wales haps spontaneous resolution of an ectopic pregnancy in
data assuming that the two countries have the same the earlier period of the study. During the 1980’s the
maternal age distribution. introduction of sensitive pregnancy tests and availabil-
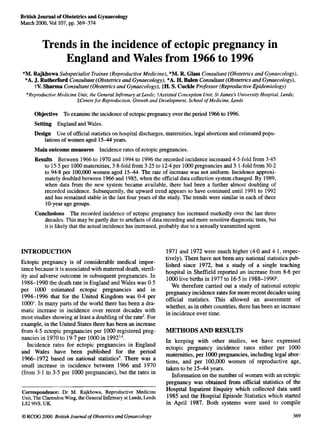
Table 1 and Figure 1 show that the increase in inci- ity of rapid measurement of human chorionic
dence previously reported in the period 1966-1972 con- gonadotrophin (hCG) altered the management of this
tinued over the next 14 years. From 1973 to 1985 the group of patients. In the presence of an positive test or
previous steady upward trend continued. However, an abnormal rise in hCG levels, there was greater likeli-
between 1985 and 1989 there was a sudden increase in hood of the diagnosis of ectopic pregnancy. Both these
reported incidence. Thereafter there was a further advances have had an impact on the number of women
increase until 1992, and the rate appears to have diagnosed to have an ectopic pregnancy, though it is
remained stable in the last four years of the study. These unlikely to explain the fourfold increase in the incidence
trends in incidence were not materially dependent on the seenbetween1966-1970and1994-1996.
type of denominator used in the statistical analysis. Thus There have been changes in the system for collecting
there was a 4.5-fold increase in incidence between information on ectopic pregnancies and the ICD scheme
1966-1970 and 1994-1996 from 3.45 to 15.5 per 1,000 for classifying diseases during the study period. These
0RCOG 2000 Br J Obstet Gynaecol 107,369-374
3. T R E N D S I N E C T O P I C P R E G N A N C Y : 1 9 6 6 TO 1 9 9 6 371
Table 1. Incidence of ectopic pregnancies according to year of diagnosis. NA = not available.
Incidence rate
per 1000 per 1000 per 100,000 women
Year Diagnoses (n) maternities pregnancies* aged 15-44 years
19661970
66 2673 3.14 3-14+ 28.4
67 2777 3.33 3.33' 29.6
68 2849 3.47 3.38* 30.5
69 2805 3.5 1 3.31 30.0
70 3021 3.85 3.5 1 32.3
Mean 3.45 3.26 30.2
1971-1975
71 3549 4.53 4.04 37.8
72 3447 4.75 4.13 36.6
73 4237 6.26 5.38 44.7
74 3800 5.94 5.07 39.9
75 3670 6.09 5.17 38.3
Mean - 5.45 4.72 39.5
1976-1 980
76 3580 6.13 5.22 37.0
77 4050 7.12 6.03 41.4
78 3950 6.64 5.59 39.8
79 4140 6.51 5.47 41.6
80 3790 5.80 4.84 37.5
Mean - 6.42 5.41 39.7
1981-1985
81 4170 6.60 5.49 40.6
82 4270 7.20 5.96 40.9
83 4700 7.88 6.54 44.6
84 4830 8.00 6.58 45.3
85 4620 7.42 6.10 42.9
Mean - 7.4 1 6-13 44.8
19861988 NA - -
1989-1993
89 8958 13.7 11.0 86.2
90 8880 13.3 10.6 85.4
91 9952 15.0 12.1 95.8
92 10,025 15.3 12.4 97.6
93 9664 15.1 12.2 94.9
Mean - 14.5 11.7 91.9
1994-1 996
94 9996 15.8 12.8 98.4
95 9498 15.4 12.4 93.5
96 9401 15.2 12.1 92.4
Mean - 15.5 12.4 94.8
*Maternities and legal abortions.
'Legislation came into effect on 27 April 1968 so the 1966 and 1967 figures do not include legal abortions and the 1968 figure includes only 8
month data.
could have artefactually contributed to the trend. The between 1985 and 1989 than would be expected from the
recorded incidence increased markedly after the change previous or subsequent quinquennia. While the ICD
from the Hospital Inpatient Enquiry to the Hospital codes were revised three times over the study period, this
Episode Statistics data collection system. However, there is unlikely to have had a major influence on reported
was a hiatus of three years when data were unavailable rates as there were no changes in the disease description
during the change of system, and it is possible that this used, the method of grouping similar diseases and the
coincided with a period of rapidly increasing incidence. subgroup classification of type of ectopic pregnancy.
The upward trend was present both before and after the Although some of the increase in reported incidence
change in system, but the increase is much greater may have been due to the change in method for data
0 RCOG 2000 Br J Obstet Gynaecol 107,369-374
4. 372 M . RAJKHOWA ET AL.
100 an ectopic pregnancy incidence of 16.5 per 1000 total
births6, compared with 13.5 per 1000 for the national
F
!
m incidence in 1989-1990. Similarly, in 1980-1984 using
al
80 the records of a single Aberdeen hospital, the reported
7
?
incidence was 8.7 per 1000 maternitiesI8compared with
7.1 per 1000 women for England and Wales. The results
60 from other countries also show large increases in inci-
m
C dence over the same time period. Moreover, for some
40
E
B countries, notably in Scandinavia, the rate of increase
0
changed over time with a slow rise followed by a sharp
0
0 increase in the late 1970's with a peak in the late 1980's
0
20 z and a subsequent plateau. Since this is what we found in
L
(u England and Wales, we conclude that much of our
U
observed trend is real. Furthermore, if the incidence in
0 this country has indeed reached a plateau it will have
1965 1970 1975 1980 1985 1990 1995 2000
peaked at a lower level than seen in North America and
Fig. 1.Trends in the incidence of ectopic pregnancy from 1966 to Scandinavia.
1996. Many risk factors for the development of ectopic
pregnancy have been identified. A meta-analysis of 27
case control studies and nine cohort studies found the
collection in this country, the trend is consistent both highest relative risks to be associated with previous
with other countries and local data collection within the ectopic pregnancy, previous tubal surgery, tubal
UK (Table 3). Thus, in 1988-1990, examination of the pathology, previous sterilisation, pregnancy with an
medical records in a Sheffield teaching hospital yielded intrauterine contraceptive device in situ and exposure
Table 2. Age-specific incidence of ectopic pregnancies according to year of diagnosis. NA = not available.
Age 15-24 Age 25-34 Age 35-44
per lo00 per 1000 per 100,000 per 1000 per 1000 per 100,000 per 1000 per 1000 per 100,OOO
Year maternities pregnancies* women maternities pregnancies* women matemities pregnancies* women
1966 2.08 2.08' 22.6 3.62 3.62' 49.4 5.51 5.51' 15.6
1967 2.12 2.12' 23.0 3.78 3.78' 49.5 6.87 6.87' 18.6
1968 2.17 2.12+ 23.6 4.17 4.08+ 52.9 6.63 6.28+ 16.7
1969 2-09 1.97 22-2 4.27 4.08 52.2 7.33 6.45 17.0
1970 2.23 2.04 23.7 4.87 4.54 57.6 7.73 6.36 16.6
1971 3.35 3.00 35.4 4.72 4.33 55.4 10.9 8.52 22.0
1972 2.74 2.37 26.4 5.71 5.21 62.9 10.8 8.02 19.4
1973-78 NA - - - - - - - -
I979 4.83 3.88 33.5 6.6 1 5.94 66.0 16.6 11.4 21.8
1980 4.3 1 3.45 30.3 6.17 5.52 62.6 12.3 8.46 1.69
1981 4.74 3.76 31.4 6.96 6.22 68.1 14.7 10.2 19.7
1982 3.91 3.08 23.6 8.40 7.50 76.9 16.3 11.7 22.2
1983 4.85 3.81 28.6 9.0 1 8.06 84.2 15.8 11.6 22.2
1984 5.10 3.93 29.9 8.64 7.69 81.9 18.4 13.6 26.2
1985 5.43 4.16 32.4 7.61 6.77 74.0 16.4 12.2 23.6
1986-88 NA - - - - - - - -
1989 9.79 6.98 59.3 17.2 14.8 169 26.8 20.3 43.2
1990 9.63 6.81 58.7 15.0 12.9 151 23.9 18.2 40.2
1991 11.5 8.21 69.2 16.5 14.2 163 26.3 20.2 45.4
1992 11.0 7.88 64.0 16.8 14.5 164 28.2 21.9 52.3
1993 11.5 8.24 64.8 16.5 14.2 158 25.7 20.0 49.7
1994 11.5 8.28 65.2 16.0 13.8 160 28.1 22.2 59.3
1995 10.9 7.82 59.6 15.9 13.7 154 24.1 19.2 52.4
1996 10.5 7.21 57.8 15.4 13.1 148 24.8 19.6 56.3
*Matemities and legal abortions.
'See Table 1. For 1968 the number of abortions broken down by age was not available so and the age distributionwas assumed to be the same
as for 1969.
0 RCOG 2000 Br J Obstet Gynaecol 107,369-374
5. T R E N D S I N ECTOPIC P R E G N A N C Y : 1966 TO 1996 373
Table 3. Incidence of ectopic pregnancy in different countries and time periods. NA = not available.
Incidence rate
per loo0 per loo0 per 100,OOO
Publication Period maternities pregnancies women
Scandinavia
Westrom er al. 1981 (Lund, Sweden)Iz 196064 NA 5.8 60.0
1965-69 - 6.8 80.0
1970-74 - 7.5 90.0
1975-79 - 11.1 1 20
Meirik 1981 (Uppsala, Sweden)" 1961-66 NA 3.1 28.0
1967-72 - 4.9 48.0
1973-77 - 10.0 96.0
Makinen 1987 (Finland)I4 1967-69 7.0 6.7 48.3
1970-74 10.1 6.8 57.4
1975-79 16.2 11.8 99-0
1980-83 23.8 17.8 134
Skjeldestad et al. 1997 (Norway)I5 1970-74 5.2 NA 40.0
1975-79 12.4 - 70.0
1980-84 18.1 - 90.0
1985-89 24.7 - 140
1990-93 23.7 - 160
North America
Chow el al. 1987 (USA)l6 1970* NA 4.5 42.0
1983 - 14.0 126
Goldner er al. 1993 (USA)3 1970-74 NA 5.8 NA
1974-79 - 9.0 -
1980-84 - 13.0 -
1985-89 - 15.5 -
Centers for Disease Control 1995 (USA)4 1992 NA 19.7 NA
Hockin &Jessamine 1984 (Canada)" 1971* NA 5.7 49.9
1980 - 9.3 71.9
Rest of Europe
Flett er al. 1988 (Aberdeen, UK)" 1950-64 3.1 2.8 23.7
196549 3.3 2.9 25.0
1970-74 3.1 2.4 20.0
1975-79 7.8 5-7 39.0
1980-84 8.7 6-4 45.0
Parazinni et al. 1988 (Lombardy, Italy)I9 1979-83* NA 4.7 31.8
Li er al. 1991 (Sheffield, UK)6 1977-79 8.6 NA NA
1985-87 11.8 - -
1988-89 16.5 - -
Coste et al. 1994 (Central France)20 1992 20.2 15.8 95.0
Ankum 1994 (Netherlands)" 1980-84 8-5 NA NA
1985-89 10.6 - -
1990-92 10.3 - -
*Rates in interim years available.
to diethylstilboestrol in utero". However, changes in determined by official laboratory statistics, increased
exposure of small subgroups of the population to large more than fourfold between 1981 and 1986, remaining
relative risks are unlikely to account for the observed stable thereafte?'. Epidemiological surveys show con-
increase in incidence. More moderate risk factors were: siderable variation in the prevalence of genital chlamy-
history of infertility, pelvic infections and previous dia trachomatis infection within different clinical
abdominal or pelvic surgery. Pelvic inflammatory dis- settings, with a substantial reservoir of asymptomatic
ease is of more consequence: although exposure only infection in all clinical settings. A large case control
doubles the chance of ectopic pregnancy21,there are an study in France attributed 43% of cases of ectopic preg-
increasing numbers of women exposed. The most com- nancy to a previous sexually transmitted disease in
mon genitourinary infection in women is currently due either partner, and to seropositivity for Chlamydia tru-
to Chlamydia trachomatis and the rate of exposure, as chomatis2".
0 RCOG 2000 Br J Obsrer Gynaecol 107,369-374
6. 374 M . R A J K H O W A ET AL.
If the increased incidence in ectopic pregnancy in 5 Beral V. An epidemiological study of recent trends in ectopic preg-
nancy. Br J Obstet Gynaecoll975;82: 775-782.
recent decades is due to sexually transmitted disease 6 Li TC, Tristram A, Hill AS, Cooke ID. A review of 254 ectopic preg-
then the health education measures currently being used nancies in a teaching hospital in the Trent Region, 1977-1990. Hum
to increase awareness of safer sex should eventually Reprod 1991; 6: 1002-1007.
7 Department of Health and Social Security. Hospital In-patient
result in a lower incidence. However, the rate of decline Enquiry. Series MB4 1974-1987: Nos. 2-26.
may be less steep than the rise as some of the damage to 8 Department of Health. Hospital Episode Statistics 1990-1997; 1-3.
exposed individuals will not be reversible. One study 9 Ofice of Populations, Censuses and Surveys. Birth Statistics. Series
FMI 1977-1998; Nos. 1-25.
from Norwayz4 confirms this as a 75% fall in Chlamydia 10 Office of Populations, Censuses and Surveys. Abortion Statistics.
trachomatis incidence, and an 80% decline in pelvic Series AB 1968-1997; Nos. 1-24.
inflammatory disease was followed by a reduction in 11 Office of Populations, Censuses and Surveys (now Office of National
Statistics).Population Trends 1979; 18:41,1986; 50:46, 1989;62:43,
ectopic pregnancy incidence but of a smaller degree. 1993;79:50, 1996;91: 58.
We conclude that the recorded incidence of ectopic 12 Westrom L,Bengtsson LPH, Mardh PA. Incidence, trends,and risks of
pregnancy has increased markedly over the last three ectopic pregnancy in a population of women. BMJ 1981;282 15-18.
13 Meirik 0. Ectopic pregnancy during 1961-1978 in Uppsala County,
decades. This may be partly due to artefacts of data Sweden.Acta Obstet Gynecol Scand 1981; 60: 545-548.
recording, as well as the availability newer sensitive diag- 14 Makinen JI. Ectopic pregnancy in Finland 1967-1983: a massive
nostic tools, but it is likely that the actual incidence has increase. BMJ 1987; 294: 740-741.
15 SkjeldestadFE,Kendrick JS, Atrash HK, Daltveit AK. Increasing inci-
increased, probably due to a sexually transmitted agent. dence of ectopic pregnancy in one Norwegian county-a population
based study, 1970-1993. Acta Obstet Gynecol Scand 1997; 7 6
159-165.
Acknowledgements 16 Chow WH, Daling JR, Cates W, Greenberg RS. Epidemiology of
ectopic pregnancy. Epidemiol Rev 1987; 9:70-94.
The authors would like to thank Mr J. Kirk, Ms G. 17 Hockin JG, Jessamine AG. Trends in ectopic pregnancy in Canada.
Baines and Ms M. Grinstead of the Department of CMAJ 1984; 131: 737-740.
18 Flett GMM, Urquhart DR, Fraser C, Terry PB, Fleming JC. Ectopic
Health, Statistics Division, for making unpublished data pregnancy in Aberdeen 1950-1985. Br J Obsret Gynaecol 1988; 95:
from the Hospital Inpatient Enquiry and the Hospital 740-746.
Episode Statistics available for this study. 19 Parazzini F, Ferraroni M, Tozzi L, Ricci E, Mezzopane R, La Vecchia
C. Induced abortions and risk of ectopic pregnancy. Hum Reprod 1995;
10 1841-1844.
20 Coste 1, Job-Spira N, Aublet-Cuvelier B et al. Incidence of ectopic
References pregnancy. First results of a population-based register in France. Hum
1 Department of Health. Why mothers die. Report from the Confidential Reprod 1994;9:742745.
Enquiry into Maternal Deaths in the United Kingdom 1994-1996. 21 Ankum WM. Ectopicpregnancy-a diagnostic challenge [PhD thesis].
London: HSMO, 1998. Amsterdam: University of Amsterdam, 1994.
2 Cuckle HS, Murray J. Epidemiology of ectopic pregnancy. In: 22 Ankum WM, Mol BWJ, Van der Veen F, Bossuyt PMM. Risk factors
Grudzinkas JG, O’Brien PMS, editors. Problems in Early Pregnancy: for ectopic pregnancy-a meta-analysis. Fertil Steril 1996; 65:
Advances in Diagnosis and Management. London: RCOG, 1997: 1093- 1099.
65-76. 23 Simms I, Catchpole M, Brugha R, Rogers P, Mallinson H, Nicoll A.
3 Goldner TE,Lawson HW, Xia Z, Atrash HK. Surveillance for ectopic Epidemiology of genital Chlamydiatrachomatis in England and Wales.
pregnancy: United States, 1970-1989. Mor Mortal Wkly Rep CDC Genitourin Med 1997; 73: 122-126.
Surveill Summ 1993; 42:73-85. 24 Stray-PedersenB. MST prevention-the Norway experience. Contra-
4 Centres for Disease Control. Ectopic pregnancy: United States, cept Fertil Sex 1996; 24: 213-217.
1990-1992. Mor Mortal Wkly Rep CDC Surveill Summ 1995; 44:
46-48. Accepted I1 August 1999
0 RCOG 2000 Br J Ohstet Gynaecol 107,369-374