SlideShare una empresa de Scribd logo
1 de 20
Descargar para leer sin conexión
ELECTRICITY CONSUMPTION
AND ECONOMIC GROWTH:
A Causality Evidence from
Six Economic Corridors of Indonesia, 1984-20101
Timotius D. Harsono
Lecturer in International Relation, National Resilience Institute RI.
Ph.D Candidate, Policy Study,
Gadjah Mada University, Yogyakarta, Indonesia
Email: timotius-d-harsono@lemhannas.go.id
tim.harsono@gmail.com (Phone: +62816856773)

Mudrajad Kuncoro
Professor in Economics, Faculty of Economics & Business,
Gadjah Mada University, Yogyakarta, Indonesia
Email: profmudrajadk@gmail.com
URL: http://www.mudrajad.com (Phone: +62811254255)

ABSTRACT
The relationship between electricity consumption and GDP in Indonesia has been
examined in some previous studies. However, none of them has tested the causal relationship
between electricity consumption and Gross Regional Development Product (GRDP) of
regions within a country. Yudhoyono’s government launched Master Plan for Acceleration
and Expansion of Indonesia Economic Development (MP3EI) by setting six major economic
corridors on 27 of May 2011. However, the regional implementation of electricity
development policy has not been elaborated in MP3EI document. Our study will explore
further the relationship between electricity consumption and economic growth in six
economic corridors as set in the MP3EI. This relationship is important to be identified to
understand the policy implications on electricity in the context of regional autonomy and
development.
Our analysis is a pioneering study of Indonesia’s electricity consumption and economic
growth that incorporates “geography” into economic analysis of causality during 1984-2010.
Using Granger causality tests and Error Correction Model (ECM), our empirical findings
shows that: (1) there is uni-directional short run relationship moving from electricity
consumption per capita to GDP per capita for Indonesia as a single region; (2) the causality
tests for Sumatra economic corridors shows there is an uni-directional short run relationship
moving from electricity consumption to economic growth, meanwhile the tests for
Kalimantan shows an opposite short run uni-directional relationship; (3) the causality tests do
not show any causal relationship for other corridors (Jawa, Sulawesi, Bali-Nusa Tenggara,
and Papua-Kepulauan Maluku).
Finally, the findings suggest that fundamental changes in electricity and regional
development policies are required. Indonesia needs electricity and regional policy that
incorporates regional variations in term of electricity consumption, economic growth, and
GRDP per capita.
Keywords: Electricity Consumption, GDP, GRDP, Corridors, Granger Causality, ECM

1

This paper is presented at the Kuala Lumpur International Business, Economics, and Law Conference KLIBEL
2013, Kuala Lumpur Malaysia, 8-9 April 2013. I am grateful for the comments from the anonymous reviewers of
International Journal of Business, Economics, and Law, volume 2, 2013. Our appreciation also goes to our
assistants, Fatkhu Ridho FEP and M. Irka Irfa’Darojat.

1
1. INTRODUCTION
The relationship between electricity consumption and economic growth has become a
primary topic and controversial issue in the US, Europe, and Asia, since 1970s (e.g.
Kraft & Kraft, 1978; Altinay & Karagol, 2005; Shiu & Lam, 2004; Jumbe, 2004;
Yoo, 2005). The empirical studies found some controversial results with respect to the
causal relationship between electricity consumption and economic growth that can be
summarized into four types, as follows (Chen, et al. 2007): First, the uni-directional
causality moving from electricity consumption to economic growth implies that
restrictions on the use of electricity may affect economic growth adversely while
increases in electricity supply may contribute to economic growth. Second, the unidirectional causality moving from economic growth to electricity consumption would
suggest that a permanent increase in economic growth may result in a permanent
increase in electricity consumption. Third, a bi-directional causal relationship implies
that electricity consumption and economic growth are jointly determined and affected
at the same time. Fourth, the absence of causal relationship implies that: (1) the
electricity consumption is not correlated with economic growth; (2) neither
conservative nor expansive policies related to electricity consumption have any effect
on economic growth.
Indonesia is an excellent laboratory for testing which directions of causality
between electricity consumption and economic growth occur. One of most striking
issues is that generating electric capacity growth in Indonesia has lagged behind the
pace of electricity demand growth, leading to power shortages and a low
electrification ratio. Although Indonesia's generating capacity has increased by more
than a quarter in the last decade, the country has a low electrification ratio compared
to similar income countries. In 2013, around 76% of Indonesia's population had
access to electricity. Indonesian Eastern Regions (Kawasan Timur Indonesia, KTI)
lags behind the Indonesian Western Region (Kawasan Barat Indonesia, KBI), with
some provinces only providing electricity to a third of the population (Figure 1).
Figure 1. Electricity Ratio By Province, Indonesia 2005-2014

Source: Ministry of Energy and Mineral Resource (MEMR) (2011)

US-EIA (2013) indicates two important features of electricity supply. First,
state-owned electric utility company, PT PLN (Perusahaan Listrik Negara), is the
most significant company in the electric power sector. PLN owns and operates about
90% of the country's generating capacity through its subsidiaries, and maintains an
2
effective monopoly over distribution activities. Although the most recent 2009
Electricity Law ends PLN's distribution monopoly, there is a lack of sufficient
regulations to enforce this law. Second, Indonesia had an estimated 44 gigawatts
(GW) of installed capacity in 2011 and generated 192 billion kilowatt-hours (kWh).
In addition, 86% of the power came from conventional thermal sources, with the rest
coming from hydroelectric (9 percent), geothermal (5 percent), and other renewable
sources. Coal accounted for just over half of conventional thermal power.
The outline of this paper is as follows. First, it will highlight some surveys of
literature on causality tests between electricity consumption and GDP. The
relationship between electricity consumption and GDP in Indonesia has been
examined by some previous studies (Murry & Nan, 1996; Yoo, 2006; Chen, et al.,
2006). Second, it will discuss briefly the data and methology used in our study. Third,
our analysis of the relationship between electricity consumption and economic growth
in Indonesia will cover: (a) the causal relationship between national electricity
consumption and Gross Development Product (GDP) and (b) the causal relationship
between Regional Electricity Consumption (REC) and Gross Regional Development
Product (GRDP) of each economic corridor. Our focus of the analysis will be
emphasised on the 6 economic corridors, i.e. Sumatra, Jawa, Kalimantan, Sulawesi,
Bali–Nusa Tenggara, and Papua–Maluku, as set by the recent Master Plan of
Acceleration and Expansion of Indonesia Development (Master Plan Percepatan
Pembangunan Indonesia, MP3EI). Concluding remarks and policy implications are
given in the final section.
2. LITERATURE REVIEW
The electricity Law No. 30 year 2009, in particular article 2.2, indicates that the
essentially purpose of this law is to secure the availability of sufficient and good
quality electric power with effordable price to increase the welfare of all Indonesian
people (MEMR, 2011b). The PLN is a state owned company and mandated by the law
to provide electricity service as a single operator. Esentially, the main objectives of
the electricity law is to support the improvement of people’s welfare and promote
economic growth. In order to achieve these objectives, the goverment has prioritized
to fulfill electricity demand of household and industrial sector (MEMR, 2010). In the
last few years, the electrification ratio has increased significantly from 62% (2005) to
67.2% (2010). In 2014, it is projected to reach 80%. The supply of electricity for
industry and business sectors is closely related to economic growth. On the other
hand, the infrastucture development required to increase the electricity supply needs
huge amount of investment. So far, the electricity policies and regulations has been
focused more on the supply side, rather than serving the demand side.
The policy implementation are incorporated in some official documents, such as
Energy Outlook 2008-2010, Annual State Budget and Expenditure Report (Nota
Keuangan & RAPBN), and MP3EI. The general policy in energy sector (including
electricity) is mostly supply and price oriented. The electricity price is driven by
subsidy level, which is mostly aimed to control the inflation level.
The electricity consumption per annum is increasing rapidly in line with the
increasing national economic growth and the changes of paradigm in the society to
meet their day to day life style needs, especially in household and industrial sector
(Table 1). The electricity demand during 2006-2010 had been increasing with average
growth of 6.3% annually. While the electricity infrastructure development can only
provide additional supply with an average growth of 4.4% in the same period.
3
Table 1. Electricity Consumption and Economic Growth, Indonesia 2000-2010
Population

GDP per Capita

Year
Quantity
2000
2001
2002
2003
2004
2005
2006
2007
2008
2009
2010

205,132.00
208,900.60
212,003.50
215,152.38
217,854.10
220,553.07
223,013.78
225,642.50
228,523.30
231,369.50
237,641.00

Annual
Annual
in Million Rp
Growth (%)
Growth (%)
1.12
6.70
6.25
1.84
7.20
7.46
1.49
7.60
5.56
1.49
8.30
9.21
1.26
10.64
28.19
1.24
12.45
17.01
1.12
15.03
20.72
1.18
17.60
17.10
1.28
21.70
23.30
1.25
24.30
11.98
2.71
27.22
12.02
Average
14.44

Economic
Growth (%)
4.92
3.64
4.50
4.78
5.03
5.69
5.50
6.35
6.01
4.55
6.50
5.22

Electricity
Consumption per
Capita
Annual
KWh
Gwh
Growth (%)
389
3.20
405
4.11
411
1.48
420
2.19
459
9.29
485
5.66
505
4.12
579
14.65
565
-2.42
560
-0.88
619
10.54
4.72

Source: Compiled from BPS (2013); MEMR (2010b)

The disequilibrium between actual demand and the supply of electric power has
created shortage of electricity supply in certain regions, especially those regions
outside PLN interconnective region of Jawa-Madura-Bali. The 1998 economic crisis
has slowed down the development of electricity infrastructure in Indonesia. During
the period of economic recovery, the growth of the installed electric power capacity
was only increased by the rate of 1.13% (MEMR, 2010b).
Electricity consumption of Indonesia increased from 112,609 giga watt hour
(Gwh) in 2006 to 147,297 GWh in 2010, with average increase of 6.6%. Such
increase of electricity comsumption mainly is driven by the increase of consumption
households and industrial sectors. Table 1 shows the trend of electricity consumption
increase was not always followed by economic growth within the period of 2000–
2010. This condition seems to be in line with the finding of Yoo (2006) which argued
that the consumption of electricity in Indonesia did not significantly impact the
economic growth. This condition may be caused by the fact that the consumption of
electricity in Indonesia are used more to meet the need of household sector, while less
portion of electric power are allocated to fullfill the demand of industrial sector and
other economic activities that can stimulate the economic growth strongly (Table 2).
Table 2. Electricity Demand By Group of Users (Gwh), 2006-2010
Household
Commercial
Industry
Others

2006
43.754
18.415
43.615
6.825

Electric Power Consumption (Gwh)
2007
2008
2009
47.324
50.184
54.945
20.608
22.926
24.638
45.802
47.969
46.017
7.510
7.940
8.607

2010
59.825
27.157
50.985
9.330

Total

112.609

121.246

147.297

Group of Users

129.019

134.207

Source: MEMR (2010b)

Causality tests between electricity consumption and GDP in Indonesia have been
examined earlier by Murry & Nan (1996) using 1970-1990 period and Yoo (2006)
using 1971-2002 period (Table 3). Yoo (2006) used the standard Granger causality
test and found uni-directional relationship moving from GDP to electricity
consumption. This finding shows a conformity to the finding of Murry & Nan (1996).
In contrast to the finding of Yoo (2006) and Murry & Nan (1996), the causality
test performed by Chen, et al. (2006) using Granger causality test and Error
Correction Model (ECM) found a long run relationship moving from electricity
consumption to economic growth (Table 3). These studies used single country data set
for each country and also applied data panel for 10 selected countries in Asia.
4
Table 3. Previous Causality Tests Related to
Electricity Consumption and GDP in Indonesia
Authors (Year)
Murry& Nan (1996)
Yoo (2006)
Chen (2006)

Methodology

Time Period

Causal Relationship

Standard Granger causality test
Granger Causality and Error
Correction Model

1970–1990
1971–2002

Income  Electricity

1971-2001

Electricity  Income

Our study uses modified Granger causality test with ECM applied to time
series data within the period of 1984-2010. These model are employed to find the
nature of the causal relationship between electricity consumption and economic
growth, both for Indonesia as a single region and each region of the 6 economic
corridors as set by MP3EI document. Our study sought to inject empirical content to
the emerging interest in the causality literature by examining electricity consumption
and regional economic growth in the context of Indonesia’s recent regional autonomy.
By analyzing 6 regional economic corridors, we attempt to incorporate “geography”
into economic analysis of causality with newer time horizon (1984-2010).
3. METHODOLOGY
3.1. Data
This study will use annual time series data for Indonesia as one single country data
set, as well as for 6 economic corridors within Indonesia, namely Sumatra, Jawa,
Kalimantan, Sulawesi, Bali-Nusa Tenggara, and Papua-Maluku. The annual data for
real GDP is obtained from Badan Pusat Statistik (BPS) and the annual data for electric
power consumption is obtained from PLN. The data period (1984-2010) is determined
based on the availability of regional electricity consumption and regional income data.
The real GDP and GRDP are expressed in rupiah at constant price of year 2000 while
the electric power consumption is expressed in unit of Kilowatt hours (KWh). The
real GDP and real GRDP as well as National Electricity Consumption (NEC) and
Regional Electricity Consumption (REC) are transformed into natural logarithms to
reduce heteroscedasticity. The logarithm variables have its economic meaning since
they are approximated to be viewed as the growth of the respective differenced
variables. The unit roots, cointegration tests, Granger causality tests, and ECM model
estimation are performed by Eviews 6.0.
Instead of using only aggregate data of Indonesia as one unit analysis, this
study will also use a quantitative data of 33 provinces and 14 PLN distributive regions
which are regrouped into 6 economic corridors in line with the MP3EI (Table 4).
Sumatra economic corridor connects its main economic centers from Banda Aceh (in
Aceh province), Medan, Pakanbaru, Jambi, Palembang, and Bandar Lampung (in
Lampung province). Java’s economic corridors connect its main economic centers
from Banten, Jakarta, Bandung, Semarang, Yogyakarta, to Surabaya. Major economic
centers of Kalimantan are Pontianak, Palangkaraya, Banjarmasin, and Samarinda will
be connected with the Corridor Connectivity Lane. Sulawesi corridor is expected to be
Production and Processing Center of Agricultural, Agriculture, Fisheries, Oil and Gas
and Mining National, and become the forefront in serving markets of East Asia,
Australia, Oceania, and America via its major centers (Makasar, Mamuju, Kendali,
Palu, Gorontalo, Manado). Major economic centers of Bali-Nusa Tenggara corridor
are Denpasar, Lombok, Kupang. Papua-Maluku, have been designed to be the Centers
for Development of food, fisheries, energy, and national mining that connects its main
economic centers from Ambon,Sofifie,Sorong,Manokwari,Timika,Jayapura, Merauke.
5
Table 4. Six Economic Corridors based on Electricity Consumption Data of 14 PLN Distributive
Regions, GRDP Data of 33 Provinces, and MP3EI’s Theme
6 Economic
MP3EI’s Theme
14 Distributive Regions of PLN
Corridors
1. NAD: Nangroe Aceh Darusalam (NAD) Province
2. North Sumatra: North Sumatra Province
Center for Production
and Processing of
3. West Sumatra Riau: West Sumatra, Riau and
Natural Resources As
SUMATRA
Riau Islands Provinces
The Nation’s Energy
4. S2JB, Babel & Lampung: Jambi, South
Reserves
Sumatra, Bangka Belitung Islands, Bengkulu and
Lampung Provinces
5. West Java and DKI: Special District of Jakarta,
West Java and Banten Provinces
Driver for National
6. Central Java and DIY: Central Java and
Industry and Services
JAVA
Yogyakarta Special Region Provinces
Provision
7. East Java: East Java Province

9. West Kalimantan: West Kalimantan Province
10. Central-South Kalimantan & East
Kalimantan:
South Kalimantan, Central Kalimantan, and East
Kalimantan Provinces
11. Suluttenggo: North Sulawesi, Gorontalo and
Central Sulawesi Provinces
12. Sulselra: South Sulawesi, West Sulawesi and
South-East Sulawesi Province

BALI – NUSA
TENGGARA

Gateway of Tourism
and Food National
Support

KALIMANTAN

Center for Production
and Processing of
National Mining and
Energy Reserves

SULAWESI

Production and
Processing Center of
Agricultural,
Agriculture, Fisheries,
Oil and Gas and
Mining National

PAPUA –
MALUKU

8. Bali, West Nusa Tenggara and East Nusa
Tenggara: Bali, West Nusa Tenggara and East
Nusa Tenggara Province

Center for
Development of Food,
Fisheries, Energy, and
National Mining

13. Maluku: Maluku and North Maluku Province
14. Papua: Papua and West Papua Provinces

Source: PLN (2011); BPS (2011); CMEA (2011: 51, 74, 96, 120)

3.2. Causality Test
This study will use Granger causality test and ECM including stationary and cointegration test. Prior to applying Granger causality test, it is imparative to ensure that
time series data related to electricity consumption and economic growth are
stationary. The stationarity test is done by applying unit roots tests to find out whether
the two variables (NEC/REC and GDP/GRDP) are stationary at 0 level, first
difference, or second difference. If both variables are not stationary at all level, then
the result of the time series data regression will be spurious, which is indicated by
time series data regression with a high R2 value but the regression coeficient is not
significant (Gujarati, 2003).
In order to make sure the data of two variables are stationary, Augmented Dickey
Fuller (1981) model is used to perform unit root tests. This model is as follows:
∑

(1)
∑

(2)

whereas, y is the variable to be tested and t is the time trend. The first equation uses
no time effect while the second one uses a fixed time effect. The lag length, i, are
6
chosen using Akaike’s Information Criterion (AIC). When the null hypothesis H0 : r =
0 is accepted, this implies that the variable has unit root and is not stationary. The first
difference is thus taken to test for the stationarity of the data set before the Grangercausality test is implemented (Chen, et al., 2006).
ADF model is applied to test the stationary using time fixed effects and no time
effects methods. The time fixed effects methods with trend and intercept is used to
find out at what level the data is stationary. Trend and intercept are to show the result
of unit root test using Random Walk Model (RWM) which indicates the deterministic
trend and the time shift. No time effects method is to show the result of unit root test
without using trend and intercept, hence it does not indicate the time shift. The result
of ADF test will be compared to McKinnon critical value at certain level (α) to find
out if the data is stationary.
It is important to select the optimal lag to be applied in this model because if the
lag used in this stationarity test is too small, then the residual of the regresion will not
show white noise process. At this point, the ADF model cannot estimate the error
accurately. In the contrary, if the selection of lag is too big, it may reduce the
capability to reject the null hypotesis (H0), because if the parameter value is too big
then it will reduce the degree of freedom (Harris, 1995: 65). The selection of optimal
lag can lead to the most appropriate finding with uncorrelated residual.
ADF model applied in this study is to emphazise more on the consistency rather
than efficiency. Therefore, the automatic selection method is performed using EViews
6.0 to determine the optimal lag by using the value of AIC as referrence. The AIC
value is used because it is more consistent compared to the value obtained using
Schwarz Information Criteria (SIC) and Hannan-Quinn Information Criteria (HQIC)
(Shatland, 2008).
Johansen cointegration test is applied to find out whether NEC/REC and
GDP/GRDP has a long run relationship. The optimal lag for each corridor is selected
based on each of its AIC value. If the NEC/REC and GDP/GRDP variables are
stationary at the first difference, then both variables are most probably cointegrated,
hence, Error Correction Terms is applied to perform modified ECM causality test to
find out whether there is any long run causal relationship.
The relationship between electricity consumption and GDP, as well as GDRP,
will be examined by applying Granger causality test and ECM as has been performed
by Chen (2006). These methods are used to show the relationship between electricity
consumption (NEC/REC) and economic growth (GDP/GRDP) in Indonesia, as well
as in each of those 6 economic corridors. The characteristic of the relationship
includes: (1) Is there any uni-directional relationship moving from NEC/REC to
GDP/GRDP?; (2) Is there any uni-directional relationship moving from GDP/GRDP
to NEC/REC?; (3) Is there any bi-directional relationship between GDP/GRDP and
NEC/REC?; (4) Is there no relationship at all between GDP/GRDP and NEC/REC?
(5) Is the nature of the relationship (if any) of both variables show a long run or short
run relationship. It is imparative to understand the characteristic of the relationship
between electricity consumption and the economic growth since the nature of such
relationship has different policy implication toward both sectoral related to electricity
and regional policy. The result of this causality tests implies that the past events have
impacted on the present events, not the future ones.
In the case NEC and GDP variables are not stationary, but become stationary
after unit roots test at the first diferrence, and after further Johansen cointegration test
both variables are not cointegrated, then standard Granger causality test is applied, as
shown in the following equations:
7
∑

∑

(3)

∑

∑

(4)

If the Johansen cointegration shows that both variables are cointegrated, then
modified ECM Granger causality test is applied by using Error Correction Term, as
follows:
∑

∑

∑

∑

(5)

(6)
whereas, NEC is national electricity consumption and GDP is Gross Domestic
Product in the form of natural logarithm, Δ is diferrence operator, q is the lag, α is the
parameter to be estimated, µ is serially uncorrected error term, and
is error
correction term which is obtained from cointegration test. In case the unit roots and
the cointegration test show hat the data is stationary and cointegrated, then modified
ECM causality test is used.
Equations 3 and 4 shows that ∆NEC has short run effects on ∆GDP if the
estimated coefisien (α12s) is stastically significant as shown by the value of statistik F.
Equations 5 and 6 show the application of ECM by including the dependent variables
with each of its lag and the disequilibrium of the previous error correction term,
.
The long run causal relationship can be determined by the level of significance of the
coefisien ( ) for error correction term based on t statistic test. By going through the
same procedure as defined in equation 5, we can test the long run causal relationship
from ∆GDP to ∆NEC (equation 6).
The causality tests between REC and GRDP variables for 6 economic corridors
also use the same model and procedures as the causality test for Indonesia as a single
region. The Method is based on the Granger causality to find the direction of causal
relationship, whereas the ECM is applied by using Error Correction Term to find out
whether there is any long run causal relationship. The equations can be stated as
follows:
∑

∑

∑

(7)

∑

(8)

Modified Granger causality and ECM are applied to examine whether there is
any long run causal relationship by obtaining the residual value and use it as Error
Correction Term, as stated in the following equations:
∑

∑

(9)

∑

∑

(10)

whereas, REC is regional electricity consumption and GRDP is gross regional
development product in the form of natural logarithm.

8
4. FINDINGS AND ANALYSIS
4.1. Unit Roots and Cointegration Tests
4.1.1. Test Result for Indonesia (as a Country Data Set)
The result of ADF test using No Time Effects model shows that the NEC variable is
not stationary at level as well as at first difference with significance of 5%. However,
NEC variable becomes stationary at the first difference with significance of 5% if
time fixed effects is applied. On the other hand, the ADF test using both No Time
Effects and Time Effects model shows that the GDP variable is not stationary at level
with significance of 5%, however, GDP variable becomes stationary at the first
difference with significance of 5% (Table 5).
Table 5. Result for Unit Roots Test between NEC and GDP Variable in
Indonesia, 1984-2010
ADF
Region

Variable

No Time Effects
Lag

NEC

1

GDP

0

Indonesia

Level

Lag

1.54
( 0.9664)
1.93
( 0.9846)

0
0

Time Fixed Effects
∆
-1.59
( 0.1025)
-4.17*
( 0.0002)

Lag
0
1

Level
-0.98
( 0.9291)
-3.35
( 0.0800)

Lag

∆
-4.34*
( 0.0106)
-3.64*
( 0.0491)

0
3

Notes: ∆ denotes first differences. All variables are in natural logarithms; NEC and GDP in per capita;
ADF = Augmented Dickey Fuller; * Means that the null of the unit root in the ADF tests is
rejected; The lag lengths are selected using AIC; Number in parentheses are P-value

The result of stationary test using ADF model with time fixed effect as well as no
time effects show that the data of NEC and GDP is stationary at the first difference,
and therefore we can proceed with Johansen cointegration test. Table 6 shows the
result of cointegration tests between NEC and GDP variables. This test shows that the
trace statistic value and maximum Eigenvalue is smaller than the significance of 5%.
This result shows no cointegration between NEC and GDP. In this case, we cannot
proceed by applying ECM to find whether there is any long run relationship between
the two variables. At this point, standard Granger causality test is applied to examine
whether there is any short run relationship.
Table 6. Results for Cointegration Test between NEC and GDP Variable
in Indonesia, 1984-2011
Region

Null Hypothesis

Lag

Johansen Test
Statistic
Trace
15.99982

15.1362

0.863584

R=0
Indonesia

Cointegraton

Max-eigen

0.863584

1

No

R≤1

Notes: NEC and GDP in per capita; r = the number of the vector cointegration; * means that the null
hyptothesis of no cointegration relationship is rejected at the 5% level; The optimal lag
lengths are selected using Akaike’s information criterion

9
4.1.2. Test Result for Six Economic Corridors
The result of stationary test on both variables (REC and GRDP) using ADF method is
shown in Table 7. ADF tests indicate that REC for Sumatra, Jawa, and Kalimantan
corridors are not stationary at 0 level as well as at the first difference with the
significance of 5%, but become stationary at the first difference with the significance
of 10%. The GRDP variable for the three corridors are stationary at the first difference
with the significance of 5%. The REC and GDRP in Sulawesi, Bali-Nusa Tenggara,
and Papua-Kepulauan Maluku corridors are stationary at the first difference with the
significance of 5%.
Table 7. Results for Unit Roots Test between REC and GRDP Variable in 6
Indonesia’s Economic Corridor, 1984-2010
ADF
Corridors

Variable
Lag

Papua –
Kepulauan
Maluku

4

REC

1
2

REC

0
0

REC

1

GRDP

Bali – Nusa
Tenggara

4

GRDP

Sulawesi

REC

GRDP

Kalimantan

0

GRDP

Jawa

2

GRDP

Sumatra

REC

0

REC

0

No Time Effects
Level
Lag
1.88
(0.9827)
1.10
(0.9252)
0.23
( 0.7442)
3.25
(0.9992)
1.34
(0.9510)
0.20
(0.7380)
9.25
(1.0000)
2.40
(0.9946)
2.36
(0.9940)
1.64
(0.9725)
4.39
(1.0000)
0.13
(0.7165)

1
0
4
0
1
1
1
0
5
0
0

∆
-1.76**
(0.0741)
-4.49*
(0.0001)
-1.8**
( 0.0644)
-4.13
(0.0002)
-1.22
( 0.1948)
-5.11*
(0.0000)
-1.21
(0.1995)
-4.36*
(0.0001)
-1.23
(0.1921)
-5.01*
(0.0000)
-2.53*
(0.0137)
-5.28*
(0.0000)

Lag
2
1
2
0
0
1
0
0
0
0
0

Time Fixed Effects
Level
Lag
∆
-1.79
(0.6737)
-3.07
( 0.1327)
-1.03
(0.9199)
-2.78
(0.2156)
-1.53
( 0.7889)
-3.34
(0.0820)
-2.39
(0.3718)
-1.74
(0.7000)
-0.74
(0.9580)
-2.68
(0.2513)
-2.13
(0.5041)
-3.00
( 0.1498)

3
1
1
3
0
1
0
2
0
3
0

-2.71
(0.2409)
-4.05*
(0.0204)
-4.34*
( 0.0015)
-4.04*
(0.0222)
-3.44**
(0.0676)
-4.98*
( 0.0028)
-4.32*
(0.0111)
-3.23
(0.1027)
-4.98*
(0.0026)
-3.12
( 0.1242)
-4.82*
(0.0039)
-5.10*
(0.0020)

GRDP
0
0
0
0
Notes: ∆ denotes first differences. All variables are in natural logarithms; REC and GRDP in per
capita; ADF = Augmented Dickey Fuller; * Means that the null of the unit root in the ADF tests
is reejected; ** Means that the null of the unit root in the ADF tests is rejected; The lag
lengths are selected using AIC; The number in parentheses are P-value.

Table 8 shows the Johansen cointegration test for variable REC and GRDP for
each corridor during the period of 1984-2010. The optimal lag selected for each
corridor is determined by using the AIC value as reference. The cointegration test
result shows that the trace statistic value and maximum eigenvalue is greater than the
critical value at the significance of 5% for Sumatra, and Kalimantan, Bali–Nusa
Tenggara, and Papua-Kepulauan Maluku. Therefore, the hypotesis which states there
is cointegration between the two variables in Sumatra corridor are proven. As for
Jawa and Sulawesi corridors, the trace statistic value and maximum eigenvalue are
smaller than the critical value at the significance of 5%. The result of these tests
indicates that for Sumatra, Kalimantan, and Bali-Nusa Tenggara, hence, Error
Correction Model may be applied to examine whether there is any long run causality
relationship in those three corridors.
10
Table 8. Results for Cointegration Test between REC and GRDP Variable in
6 Indonesia’s Economic Corridors, 1984-2010
Corridors

Null
Hypothesis

Optimal
Lag

Johansen Test Statistic
Max-eigen

Trace

Cointegration

21.06203*
23.64630*
R=0
1
Yes
2.584269
2.584269
R≤1
14.50134
14.50134
R=0
Jawa
1
No
0.020588
0.020588
R≤1
21.71951*
30.03826*
R=0
Kalimantan
5
Yes
8.318755
8.318755
R≤1
10.43199
10.78349
R=0
Sulawesi
1
No
0.351501
0.351501
R≤1
20.77115*
21.14443*
R=0
Bali1
Yes
Nusa Tenggara
0.373289
0.373289
R≤1
9.299099
12.79955
R=0
Papua1
No
Kepulauan Maluku
3.500455
3.500455
R≤1
Notes: REC and GRDP in per capita; r = the number of the vector cointegration; * means that the
null hyptothesis of no cointegration relationship is rejected at the 5% level; The optimal
lag lengths are selected using Akaike’s information criterion.

Sumatra

4.2. Causality Tests
4.2.1. The result of Causality Tests for Indonesia
The results of Granger causality test for Indonesia is obtained by applying data within
the period of 1984-2010 (Table 9). The result of F statistic shows the evidence of
short run uni-directional relationship moving from economic growth per capita
(∆GDP per capita) to electric consumption growth per capita (∆NEC per capita). The
short run causal relationship between ∆NEC per capita and ∆GDP per capita can be
seen at Table 9 column (3). The statistic F shows that the probability of ∆NEC per
capita does not have any influence to ∆GDP per capita is only 0.0884 or smaller than
the significance of 10%, therefore the null hypotesis which states that ∆NEC do not
have any influence on ∆GDP is rejected. In the contrary, the probability of ∆GDP per
capita does not influence ∆NEC per capita is 0.2319 or it is greater than significance
of 10%. This finding shows that the growth of electricity consumption in Indonesia
has influenced the growth of GDP. In other words, the findings shows that the
electricity consumption in Indonesia tend to be demand driven.
Table 9 column (4) shows that the result of t statistic test does not prove any
long run relationship both from electricity consumption growth per capita (NEC per
capita) to economic growth per capita (GDP per capita) or from economic growth to
electricity consumption growth. This is reflected by the insignificant t-value between
those two variables.
The result of F statistic test does not show any joint short run/long run
relationship moving from electricity consumption growth per capita to economic
growth per capita. This F statistic test also does not show joint short/long run
relationship from the opposite direction. The absence of joint short run/long run
relationship, is shown by Table 9 column (5), whereas the result of F statistic test
indicates that the probability of NEC per capita does not influence the GDP per
capita is 0.9509 or it is greater that the significant level of 5%. This test also shows
that the probability of GDP per capita does not influence the NEC per capita is
0.7540 or it is greater that the significant level of 5%.
11
Table 9. Results for Causality Test between NEC and GDP Variable
in Indonesia, 1984-2010
Sources of Causation
Region
(1)

Null Hypothesis
(2)

Short run
(3)

Long run
(4)

F-statistics

t-statistics

∆NEC
∆NEC does not cause ∆GDP
Indonesia

∆GDP

3.1785**
(0.0884)
1.51130
(0.2319)

∆GDP does not cause ∆NEC

εt-1
1.369681
(0.2988)
1.065393
(0.1853)

Joint (short
run/long run)
(5)
F-statistics
∆NEC,
∆GDP,

εt-1

εt-1

0.00388
(0.9509)
0.10093
(0.7540)

Notes: NEC and GDP in per capita; The lag length are selected using Akaike’s information criterion;
* Means that the null hypothesis of no causation is is rejected at the 5% level; ** Means that
the null hypothesis of no causation is is rejected at the 10% level; The number in parentheses
are P-value.

The finding of causality test in this study does support the finding of Chen, et al.
(2006), whereas the causal relationship is uni-directional moving from electricity
consumption to GDP. However, the finding of this study shows short run relationship,
whilst the relationship found by Chen (2006) is long run. On the other hand, the
finding in this study challenges the finding of Yoo (2006) and Murry & Nan (1996) in
which both findings show uni-directional relationship moving from economic growth
to electricity consumption growth.
The finding in this study shows the presence of short term relationship moving
from electricity consumption per capita to economic growth per capita. This finding
suggests that in short run, the implementation of conservation policy by limiting
electricity consumption may negatively impact the economic growth. Whilst the
increase of electricity demand can lead to an increase the consumption level which
will give positive contribution to the economic growth.
4.2.2. The Result of Causality Tests in Six Corridors
To understand the nature of causal relationship of each economic corridor within
Indonesia, it is necessary to perform causality test by applying the electricity
consumption data of 14 PLN distributive regions and the regional economic data of
33 provinces. Data at provincial level are regrouped into six economic corridors in
line with the directive of MP3EI document. Considering the size of Indonesia territory
and the geographical location of each corridor, it is useful to run causality test for the
six corridors to find out the relationship of regional electric consumption and the
GRDP for each corridor. The objective of this test is to provide evidence that both the
causality between electricity consumption and the economic growth in each region
and their regional variations will offer new insights for regional and national
electricity policy.
The general direction of the policy formulated in MP3EI document essentially is
to accelerate and expand the economic development in each corridor with the main
objective is to create high and sustainable economic growth (above 7%), to reach all
regions and more balanced growth (CMEA,2011). To create high quality economic
growth, the presence of infrastructure development in all economic corridors is
absolutely required to support its regional development.
Table 10 shows the economic indicators and the characteristic of electricity
consumption in each economic corridor indicate regional variations matter. Jawa is
one of the smallest corridor in terms of size of island among others but by far it has
12
the highest concentration of 55.78% of total population, followed by Sumatra with
22.43% of total population. Jawa and Sumatra regions represent the KBI with 30.63%
of the total area and 78.21% of the total population of Indonesia. In terms of GRDP,
KBI contributes 82.12% of the national GDP. In contrast, the other four corridors
within KTI, i.e. Kalimantan, Sulawesi, Bali-Nusa Tenggara, and Papua-Maluku, only
account for 6.11%, 7.17%, 5.78%, and 2.73% of the total Indonesia’s population
respectively.
Table 10. Economic and Electricity Consumption Indicator in 6 Indonesia’s
Economic Corridors (2010)
Corridors

Population

GRDP per capita

%
Millons
%
Sumatra
22.43
50.63
93.98
Jawa
55.78
125.97 109.44
Kalimantan
6.11
13.78 140.33
Sulawesi
7.17
16.21
67.02
Bali-Nusa Tenggara
5.78
13.07
47.80
Papua-Kepulauan Maluku
2.73
6.16
63.63
225.82
100.0
Total (Indonesia) 100.0
Sources: Calculated from BPS (2011); PLN (2011)

Rp Millions
9.24
10.76
13.80
6.59
4.70
6.25
9.84

Electricity
Consumption
per capita
%
KWh
60.30 388.64
135.75 874.70
57.74 372.13
48.58 313.12
50.57 325.90
30.40 195.93
100.0 644.46

KBI region with only representing 30.63% of the national territory has a portion
of 78.21% of national population and 82.12% of GDP. In contrast, KTI region,
representing 69.37% of the national territory, has only a portion of 21.79% population
and contributing only 17.88% of national GDP. The imbalanced population
concentration and economic activities between KBI and KTI regions have created
serious disparity across regions, between and within islands in the Indonesia’s
economic development (Kuncoro, 2013, 2012).
In terms of income per capita, Kalimantan with Rp13.8 millions per capita has
the highest income per capita among all other regions, followed by Jawa (Rp10.76
million per capita), Sumatra (Rp9.24 million per capita), Sulawesi (Rp6.59 million
capita), Papua-Maluku (Rp6.25 million per capita), and Bali-Nusa Tenggara (Rp4.7
million per capita). In terms of electricity consumption, the highest electricity
consumption per capita is in Jawa (874.70 Kwh per capita), followed by Sumatra
(388.64 Kwh per capita), Kalimantan (372.13 Kwh per capita), Bali-Nusa Tenggara
(325.90 Kwh per capita), Sulawesi (313.12 Kwh per capita), and Papua-Kepulauan
Maluku (195.93 Kwh per capita).
Figure 2 shows the regional typology by REC per capita and GRDP per capita
of the six economic corridors. By calculating the average REC per capita as the
vertical axis and the average GRDP per capita as the horizontal axis, the 33 provinces
in Indonesia can be divided into four groups, namely: high electricity consumption
and high income, high income but low electricity consumption, high electricity
consumption but low income, and relatively backward provinces with low electricity
consumption and low income. Jawa corridor has GRDP per capita and REC per capita
far aboved the national average. Whilst, Sumatra and Kalimantan have GRDP per
capita higher than national average, but their electricity consumption per capita are
lower than national average. The three other regions, those are Sulawesi, Bali-Nusa
Tenggara and Papua-Kepualuan Maluku have both REC per capita and GRDP per
capita below the national average.

13
Figure 2. Scatter Plot of GRDP Per Capita and
REC Per Capita in 6 Indonesia’s Economic Corridors, 1984-2010

Sources: Calculated from PLN (2011) and BPS (2011)

In the case of Sumatra, the test result shows a short run uni-directional
relationship moving from electricity consumption (REC per capita) to economic
growth (GRDP per capita). This finding suggests that in the short period of time, any
attempt to subdue the electricity consumption will have effect on economic growth in
Sumatra region. Whilst, the increase of electricity consumption will have a positive
implication on the economic growth of Sumatra region. Figures 3 shows a strong
concurrent upward trend for both electricity consumption and economic growth per
capita. Since 1998 this growth has been consistently staying above the national
average level. This trend indicates that this region is economically more resilient than
Jawa, Sulawesi, Bali-Nusa Tenggara, and Papua-Maluku. Unlike the other corridors,
Sumatra shows a persistent trend of increasing growth of electricity consumption and
GRDP per capita even during Asian crisis (1997-1998) and recent global crisis (20082009).
Figure 3. REC per capita and GRDP per capita, Sumatra 1984-2010

Sources: Calculated from BPS and PLN (2011)

In the case of Kalimantan, the causality tests show a short run uni-directional
relationship moving from economic growth (GRDP per capita) to electricity
consumption (REC per capita) (Table 8). This finding suggests that an increase of
14
economic growth has resulted to an increase of electricity consumption in this region.
Figures 4 shows a strong concurrent upward trend for both electricity consumption
and economic growth per capita. Since 2001, this growth has been consistently high
and staying above the average national level. Recently, the income per capita of
Kalimantan corridor has been the highest among all regions in Indonesia. Similar to
Sumatra, this trend indicates that this region is economically resilient during the
recent global crisis. However, during the Asian Crisis 1997-1998, GRDP per capita
along Kalimantan corridor dropped slightly below that of the national level but REC
per capita persisted to increase above that of the national level.
Figure 4. REC per capita and GRDP per capita, Kalimantan 1984-2010

Sources: Calculated from BPS and PLN (2011)

While both Sumatra and Kalimantan regions show that they have short run unidirectional relationship (but in opposite direction), the other 4 regions (Jawa,
Sulawesi, Bali - Nusa Tenggara, and Papua–Kepulauan Maluku) do not show any
causal relationship between REC and GRDP. Unlike the other 4 other regions,
Sumatra and Kalimantan regions also consistently show a strong concurrent upward
trend for both electricity consumption and economic growth per capita.
The absence of causal relationship is shown in Jawa, Sulawesi, Bali-Nusa
Tenggara, and Papua-Kepulauan Maluku. This finding suggests that electricity
consumption in these four regions were not correlated with economic growth. It also
implies that neither expansive nor conservative policies related to electricity
consumption did have any effects on economic growth. The finding shows that no
causal relationship between electricity consumption and its regional economic growth
is quite surprising, considering that Jawa is the only region that has more electric
consumption in industrial sector rather than household sector. Furthermore, this
region representing the highest portion of population and GRDP (55.78% and 58.66%
respectively).
Eventhough Jawa has the bigest portion of GRDP and also the highest
consumption of electricity per capita, but the income per capita is significantly lower
than Kalimantan. In the contrary to Sumatra and Kalimantan, the trend of Jawa shows
that the rate of growth in electricity consumption has started to decline and the rate of
economic growth has started to slow down (Figure 5).

15
Figure 5. REC per capita and GRDP per capita, Jawa 1984-2010

Sources: Calculated from BPS and PLN (2011)

The trends of all 3 other regions, as shown by Figure 6 to 8, indicate that the
rate of growth on the electricity consumption has started to decline, while their
economic rate of growth significantly lower compared to Kalimantan, Jawa, and
Sumatra. These regions can be catagorized as regions with low growth of income and
electricity consumption.
Figure 6. REC per capita and GRDP per capita, Sulawesi 1984-2010

Sources: Calculated from BPS and PLN (2011)

The growth of electric power supply in the regions outside Jawa are mostly
allocated to meet the consumption sector, i.e. household sector, rather than industrial
or commercial sector. Although the causal relationship did not occur significantly in
this corridor, however Jawa is the only corridor which has the portion of electricity
consumption of industrial sector (41,27%) higher than household sector (36,61%).
Whilst, Sumatera and Kalimantan regions, with the causal relationship are found,
show much lower portion electricity consumption of industrial sector (18.94% and
6.90% respectively) than household sector (51.31% and 59.94% respectively) Table
11 (column 2).

16
Figure 7. REC per capita and GRDP per capita, Bali-Nusa Tenggara 1984-2010

Sources: Calculated from BPS and PLN (2011)

Figure 8. REC per capita and GRDP per capita,
Papua-Kepulauan Maluku 1984-2010

Sources: Calculated from BPS and PLN (2011)

The electricity consumption in the other three corridors, those are Sulawesi,
Bali–Nusa Tenggara, and Papua–Maluku, are also dominated by household sector. As
shown in Table 11, the portion of household sector is between 47.83% to 59.94%,
while the portion of industrial sector is only between 1,23% to 14,96%. The last
supports Kuncoro (2012b)’s finding that those regions are nonindustrial areas with
very few large and medium manufacturing industries. The increase of consumption
portion of household sector in Sumatra (2009-2011) had been the most significant,
followed by Sulawesi, Bali-Nusa Tenggara, Kalimantan, and Papua-Maluku regions.
As for Jawa, the consumption portion had decreased during the same time period.
5. CONCLUSIONS
Using Granger causality tests and Error Correction Model (ECM), applied to the
quantitative data within the period of 1984-2010, our empirical findings shows that:
(1) there is uni-directional short run relationship moving from electricity consumption
17
per capita to GDP per capita for Indonesia as a single country data set; (2) the
causality tests for Sumatera economic corridors shows there is a uni-directional short
run relationship moving from electricity consumption to economic growth, meanwhile
the test for Kalimantan shows an opposite short run uni-directional relationship;
(3) the causality tests do not show any causal relationship for other corridors (Jawa,
Sulawesi, Bali-Nusa Tenggara, and Papua-Kepulauan Maluku).
Table 11. Electricity Consumption by Household and Industry Sectors in 6
Indonesia’s Economic Corridors (%), 2009-2011
2009
(1)

2011
(3)

51.31
18.94

54.52
18.58

37.30
40.47

36.61
41.27

36.76
41.57

60.25
7.19

59.94
6.90

61.59
6.72

52.46
16.13

53.94
14.96

54.83
14.53

48.01
3.43

47.83
3.24

49.66
3.15

57.95
1.07

Sumatra
- Household Sector
- Industry Sector
Jawa
- Household Sector
- Industry Sector
Kalimantan
- Household Sector
- Industry Sector
Sulawesi
- Household Sector
- Industry Sector
Bali-Nusa Tenggara
- Household Sector
- Industry Sector
Papua-Kep Maluku
- Household Sector
- Industry Sector

2010
2)

51.25
20.23

Corridors

57.66
1.23

58.97
1.03

Source: PLN (2012)

To implement MP3EI succesfully, it requires a thorough understanding of
Indonesia’s growth poles and electricity consumptions (and generating power supply)
for each economic corridor. Electricity generating capacity growth in Indonesia has
lagged behind the pace of electricity demand growth, leading to power shortages and
a low electrification ratio. This problem leads to some major challenges to implement
MP3EI (Kuncoro, 2013a, 2012a). Our analysis is a pioneering study of Indonesia’s
electricity consumption and economic growth that incorporates “geography” into
economic analysis of causality during 1984-2010. Before the 1990s, mainstream
economics neglected economic geography, meaning the study of where economic
activity takes place and why (Kuncoro, 2013b, 2012b). Spatial aspects remained a
blind spot for many economists because of their inability to properly model the
various aspects of industrial locations (Krugman, 1995: 31-7). Our study sought to
inject empirical content to the emerging interest in the causality literature by
examining electricity consumption and regional economic growth in the context of
Indonesia’s recent regional autonomy.
Finally, the finding suggest that fundamental changes in electricity and
regional development policies are required. Indonesia needs electricity and regional
development policy that incorporate regional variations in term of electricity
consumption, economic growth, and GRDP per capita (Figure 10). Using the recent
perspectives in the literature of causality, our study demonstrates that Indonesia
represents an excellent example of both the uneven geographic distribution of
electricity consumption and the relationship between electricity consumption and
regional development.

18
Figure 10. National Share of GDRP and Regional Electricity Consumption (2010)
(% share of total Indonesia)

Souce: Compiled from BPS (2011a, 2011c); MEMR (2010b)

REFERENCES
Altinay, G. & Karagol, E. (2005). Electricity consumption and economic growth: Evidence
from Turkey. Energy Economics, Vol. 27, 849-856.
Badan Pusat Statistik (BPS). (2011a). Produk Domestik Regional Bruto Atas Dasar Harga
Konstan 2000 Menurut Provinsi, 2004-2010 [Regional Gross Domestic Products based
on Constant Price 2000 by Provinces, 2004-2010], Retrieved July 25, 2012, from
http://www.bps.go.id/tab_sub/view.php?kat=2&Table=1&daftar=1&id_subyek=52&no
tab=2.
BPS. (2011b). Penduduk Indonesia menurut Provinsi 1971, 1980, 1990, 1995, 2000 and 2010
[Indonesia Population based by Provinces 1971, 1980, 1990, 1995, 2000 and 2010].
Retrieved January 24, 2013, from http://www.bps.go.id/tab_sub/view.php?kat=1&
Table=1&daftar=1&id_subyek=12&notab=1.
BPS. (2011c). Data Sosial Ekonomi [Economic Social Data], 3 August, Jakarta: BPS.
Chen, S. T., Kuo, H. I., & Chen, C. C. (2006). The relationship between GDP and lectricity
consumption in 10 Asian countries. Energy Policy, 35, 2611-2621.
Church, J. & Ware, R. (2000). Industrial Organization: A strategic Aproach. New
York: Irwin McGras-Hill.
Coordinating Minister of Economic Affairs (CMEA) (2011). Masterplan for
acceleration and expansion of Indonesia economic development 2011 -2025.
Jakarta: Coordinating Ministry for Economic Affairs, Republic of Indonesia.
Dickey, D.A., & Fuller, W.A. (1991). Likelihood ratio statistics for autoregressive processes.
Econometrica, 49, 1057-1072.
Engle, R. F., & Granger, C. W. J. (1987). Co-integration and error correction: Representation,
estimation and testing. Econometrica, 55, 251–276.
Ghosh, S. (2002). Electricity consumption and economic growth in India. Energy Policy, 30,
125-129.
Granger, C. W. J. (1969). Investigating causal relation by econometric models and crossspectral methods. Econometrica, 37(3), 424-438.
Granger, C. W. J. & Newbold, P. (1974). Spurious regressions in econometrics. Journal of
Econometrics, 2, 111-120.
19
Gujarati, D. N. (2003). Basic econometrics. 4th edition. New York: McGraw-Hill.
Harris, R. (1995). Cointegration analysis ineconometric modelling. New York: Prentice Hall.
Krugman, P. (1995). Development, geography, and economic theory. Cambridge and London:
The MIT Press.
Kuncoro, M. (2010). Satu tahun SBY-nomics [One year Susilo Bambang Yudhono-nomics.
Retrieved October 21, 2010, from http://cetak.kompas.com/read/2010/10/21/03040298/
satu.tahun.sby-nomics.
Kuncoro, M. (2011a). Koridor Ekonomi Indonesia [Economic Corridors of Indonesia].
Investor Daily, Retrieved February 28, 2011, from http://website.mudrajad.com/
content/koridor-ekonomi-indonesia.
Kuncoro, M. (2011b). MP3EI: mitos atau realitas? [MP3EI: a myth or reality?]. Retrieved
August 1, 2011, from http://cetak.kompas.com/read/2011/08/01/0415106/mp3ei.mitos.
atau.realitas.
Kuncoro, M. (2012a). Perencanaan daerah: bagaimana membangun ekonomi lokal, kota, dan
kawasan [Regional planning: how to develop local economy, cities and zones]. Jakarta:
Salemba Empat.
Kuncoro, M. (2012b). Ekonomika aglomerasi: dinamika dan dimensi spasial kluster industri
Indonesia [Economics of agglomeration: dynamics and spatial dimension of Indonesia’s
industrial clusters]. Yogyakarta: UPP STIM YKPN.
Kuncoro, M. (2013a). Economic geography of Indonesia: can MP3EI reduce inter-regional
inequality? South East Asian Journal of Contemporary Business, Economics, and Law,
2, forthcoming.
Kuncoro, M. (2013b). Economic geography of small and cottage industrial clusters in Java
Island Indonesia. Global Advanced Research Journal of Geography and Regional
Planning, 2(1), 006-018.
Ministry of Energy and Mineral Resources (MEMR). (2009). PLN Targetkan Pemakaian
Energi Listrik Terbarukan 10% [PLN targeted a utilization of 10% renewable electric
energy]. Retrieved 13 January, 2009, from http://www.esdm.go.id/berita/39-listrik/129pln-targetkan-pemakaian-energi-listrik-terbarukan-10.html.
MEMR. (2010a). Pokok-pokok kebijakan energi nasional [Guideline on natioanl energy
policy]. Retrieved 1 May, 2011, from http://www.esdm.go.id/news-archives/56artikel/3342-pokok-pokok-kebijakan-energi-nasional.html.
MEMR. (2010b). Statistik Listrik [Statistic of Electricity]. Retrieved 10 August 10, 2010,
from http://www.esdm.go.id/publikasi/statistik/cat_view/58-publikasi/240-statistik/354statistiklistrik. html.
MEMR. (2011a). Handbook of energy & economic statistics of Indonesia. Retrieved 10
August, 2011, from http://www.esdm.go.id/publikasi/handbook.html.
MEMR. (2011b). Undang undang nomor 30 Tahun 2009 tentang ketenagalistrikan [Law No.
30 Year 2009 on Electricity], Retrieved September 12, 2011, from http://www.esdm.
go.id/regulasi/uu/cat_view/64-regulasi/75-undang-undang/314-tahun-2009.html.
Murry, D. A., & Nan, G. D. (1996). A definition of the gross domestic product–electrification
interrelationship. The Journal of Energy and Development, 19(2), 275-283.
Patterson, Kerry. (2000). An introduction to applied econometrics: a time series approach.
New York: McGraw-Hill.
Perusahaan Listrik Negara (PLN). (2011). Statistik PLN (1984-2010) [PLN by Statistics
(1984-2010)]. Jakarta: PLN
Shatland, Ernest, Moore, S., Dashevsky, I., Miroshnik, I., Cain, E., Barton, M.B. (2008). How
to be a bayesian in SAS: model selection uncertainty in proc logistic and proc genmod.
Boston: Department of Ambulatory Care and Prevention.
US-EIA (United States of Energy Information Administration). (2013). Overview of
Indonesia. Retrieved February 8, 2013, from http://www.eia.gov/countries/
cab.cfm?fips=ID.
Yoo, S. H. (2005). Electricity consumption and economic growth: evidence from Korea.
Energy Policy, 33, 1627-1632.
20

Más contenido relacionado

La actualidad más candente

Haripur npp project
Haripur npp projectHaripur npp project
Haripur npp projectAmit Raj
 
An Examination of the Impact of Power Sector Reform on Manufacturing and Serv...
An Examination of the Impact of Power Sector Reform on Manufacturing and Serv...An Examination of the Impact of Power Sector Reform on Manufacturing and Serv...
An Examination of the Impact of Power Sector Reform on Manufacturing and Serv...IJAAS Team
 
11.0010www.iiste.org call for paper.wind energ 97-107
11.0010www.iiste.org call for paper.wind energ 97-10711.0010www.iiste.org call for paper.wind energ 97-107
11.0010www.iiste.org call for paper.wind energ 97-107Alexander Decker
 
ENERGY STATUS AND ALTERNATIVE ENERGY PLANS OF MAJOR ENERGY CONSUMERS IN SOUTH...
ENERGY STATUS AND ALTERNATIVE ENERGY PLANS OF MAJOR ENERGY CONSUMERS IN SOUTH...ENERGY STATUS AND ALTERNATIVE ENERGY PLANS OF MAJOR ENERGY CONSUMERS IN SOUTH...
ENERGY STATUS AND ALTERNATIVE ENERGY PLANS OF MAJOR ENERGY CONSUMERS IN SOUTH...aeijjournal
 
IRJET- The Power of Electricity and it’s Problems in India
IRJET- The Power of Electricity and it’s Problems in IndiaIRJET- The Power of Electricity and it’s Problems in India
IRJET- The Power of Electricity and it’s Problems in IndiaIRJET Journal
 
Indian electricity sector
Indian electricity sectorIndian electricity sector
Indian electricity sectorshivraj negi
 
7.energy scenarios pp. 7 17
7.energy scenarios pp. 7 177.energy scenarios pp. 7 17
7.energy scenarios pp. 7 17Jhon Smith
 
Economic Impacts of Electricity Price Increases in South Africa, Stephen La...
Economic Impacts of Electricity Price Increases in South Africa,   Stephen La...Economic Impacts of Electricity Price Increases in South Africa,   Stephen La...
Economic Impacts of Electricity Price Increases in South Africa, Stephen La...Stephen Labson
 
06 17 oct16 13017 26870-1-sm(edit)
06 17 oct16 13017 26870-1-sm(edit)06 17 oct16 13017 26870-1-sm(edit)
06 17 oct16 13017 26870-1-sm(edit)IAESIJEECS
 
Energy_Use_Patterns_and_Energy_Efficienc
Energy_Use_Patterns_and_Energy_EfficiencEnergy_Use_Patterns_and_Energy_Efficienc
Energy_Use_Patterns_and_Energy_EfficiencNaod Mekonnen
 
Renewable energy sources – policies of india
Renewable energy sources – policies of indiaRenewable energy sources – policies of india
Renewable energy sources – policies of indiaAngu Ramesh
 
Barriers, Drivers and Policy Options For Improving Industrial Energy Efficien...
Barriers, Drivers and Policy Options For Improving Industrial Energy Efficien...Barriers, Drivers and Policy Options For Improving Industrial Energy Efficien...
Barriers, Drivers and Policy Options For Improving Industrial Energy Efficien...CSCJournals
 
Managing China's energy productivity potential - what lessons for policy makers
Managing China's energy productivity potential - what lessons for policy makersManaging China's energy productivity potential - what lessons for policy makers
Managing China's energy productivity potential - what lessons for policy makersNicholas Howarth
 
“Impacts of Electricity Access to Rural SMEs”
“Impacts of Electricity Access to Rural SMEs”“Impacts of Electricity Access to Rural SMEs”
“Impacts of Electricity Access to Rural SMEs”ijmvsc
 

La actualidad más candente (19)

Haripur npp project
Haripur npp projectHaripur npp project
Haripur npp project
 
An Examination of the Impact of Power Sector Reform on Manufacturing and Serv...
An Examination of the Impact of Power Sector Reform on Manufacturing and Serv...An Examination of the Impact of Power Sector Reform on Manufacturing and Serv...
An Examination of the Impact of Power Sector Reform on Manufacturing and Serv...
 
Policy of central and state
Policy of central and statePolicy of central and state
Policy of central and state
 
11.0010www.iiste.org call for paper.wind energ 97-107
11.0010www.iiste.org call for paper.wind energ 97-10711.0010www.iiste.org call for paper.wind energ 97-107
11.0010www.iiste.org call for paper.wind energ 97-107
 
10.wind energ 97 107
10.wind energ 97 10710.wind energ 97 107
10.wind energ 97 107
 
ENERGY STATUS AND ALTERNATIVE ENERGY PLANS OF MAJOR ENERGY CONSUMERS IN SOUTH...
ENERGY STATUS AND ALTERNATIVE ENERGY PLANS OF MAJOR ENERGY CONSUMERS IN SOUTH...ENERGY STATUS AND ALTERNATIVE ENERGY PLANS OF MAJOR ENERGY CONSUMERS IN SOUTH...
ENERGY STATUS AND ALTERNATIVE ENERGY PLANS OF MAJOR ENERGY CONSUMERS IN SOUTH...
 
Elasticity report
Elasticity reportElasticity report
Elasticity report
 
IRJET- The Power of Electricity and it’s Problems in India
IRJET- The Power of Electricity and it’s Problems in IndiaIRJET- The Power of Electricity and it’s Problems in India
IRJET- The Power of Electricity and it’s Problems in India
 
Indian electricity sector
Indian electricity sectorIndian electricity sector
Indian electricity sector
 
7.energy scenarios pp. 7 17
7.energy scenarios pp. 7 177.energy scenarios pp. 7 17
7.energy scenarios pp. 7 17
 
Economic Impacts of Electricity Price Increases in South Africa, Stephen La...
Economic Impacts of Electricity Price Increases in South Africa,   Stephen La...Economic Impacts of Electricity Price Increases in South Africa,   Stephen La...
Economic Impacts of Electricity Price Increases in South Africa, Stephen La...
 
06 17 oct16 13017 26870-1-sm(edit)
06 17 oct16 13017 26870-1-sm(edit)06 17 oct16 13017 26870-1-sm(edit)
06 17 oct16 13017 26870-1-sm(edit)
 
Energy_Use_Patterns_and_Energy_Efficienc
Energy_Use_Patterns_and_Energy_EfficiencEnergy_Use_Patterns_and_Energy_Efficienc
Energy_Use_Patterns_and_Energy_Efficienc
 
Renewable energy sources – policies of india
Renewable energy sources – policies of indiaRenewable energy sources – policies of india
Renewable energy sources – policies of india
 
World Energy- China Outlook
World Energy- China Outlook World Energy- China Outlook
World Energy- China Outlook
 
Barriers, Drivers and Policy Options For Improving Industrial Energy Efficien...
Barriers, Drivers and Policy Options For Improving Industrial Energy Efficien...Barriers, Drivers and Policy Options For Improving Industrial Energy Efficien...
Barriers, Drivers and Policy Options For Improving Industrial Energy Efficien...
 
Managing China's energy productivity potential - what lessons for policy makers
Managing China's energy productivity potential - what lessons for policy makersManaging China's energy productivity potential - what lessons for policy makers
Managing China's energy productivity potential - what lessons for policy makers
 
“Impacts of Electricity Access to Rural SMEs”
“Impacts of Electricity Access to Rural SMEs”“Impacts of Electricity Access to Rural SMEs”
“Impacts of Electricity Access to Rural SMEs”
 
Analysis of solar energy technology in leading countries
Analysis of solar energy technology in leading countriesAnalysis of solar energy technology in leading countries
Analysis of solar energy technology in leading countries
 

Similar a Final proof electricity ijbel vol 2-2013

ELECTRICITY CONSUMPTION AND ECONOMIC GROWTH IN SWAZILAND
ELECTRICITY CONSUMPTION AND ECONOMIC GROWTH IN SWAZILANDELECTRICITY CONSUMPTION AND ECONOMIC GROWTH IN SWAZILAND
ELECTRICITY CONSUMPTION AND ECONOMIC GROWTH IN SWAZILANDpaperpublications3
 
COINTEGRATION RELATIONSHIP BETWEEN ECONOMIC GROWTH, EXPORT AND ELECTRICITY CO...
COINTEGRATION RELATIONSHIP BETWEEN ECONOMIC GROWTH, EXPORT AND ELECTRICITY CO...COINTEGRATION RELATIONSHIP BETWEEN ECONOMIC GROWTH, EXPORT AND ELECTRICITY CO...
COINTEGRATION RELATIONSHIP BETWEEN ECONOMIC GROWTH, EXPORT AND ELECTRICITY CO...AEIJjournal2
 
Co integration Relationship Between Economic Growth, Export and Electricity C...
Co integration Relationship Between Economic Growth, Export and Electricity C...Co integration Relationship Between Economic Growth, Export and Electricity C...
Co integration Relationship Between Economic Growth, Export and Electricity C...AEIJjournal2
 
National electric energy supply and industrial productivity in nigeria from 1...
National electric energy supply and industrial productivity in nigeria from 1...National electric energy supply and industrial productivity in nigeria from 1...
National electric energy supply and industrial productivity in nigeria from 1...Alexander Decker
 
Analysis of the electricity consumption in the south east geopolitical regi...
Analysis of the electricity consumption in the south   east geopolitical regi...Analysis of the electricity consumption in the south   east geopolitical regi...
Analysis of the electricity consumption in the south east geopolitical regi...Alexander Decker
 
Analysis of Households’ Electricity Consumption with Ordered Logit Models: Ex...
Analysis of Households’ Electricity Consumption with Ordered Logit Models: Ex...Analysis of Households’ Electricity Consumption with Ordered Logit Models: Ex...
Analysis of Households’ Electricity Consumption with Ordered Logit Models: Ex...inventionjournals
 
Energy Status and Alternative Energy Plans of Major Energy Consumers in South...
Energy Status and Alternative Energy Plans of Major Energy Consumers in South...Energy Status and Alternative Energy Plans of Major Energy Consumers in South...
Energy Status and Alternative Energy Plans of Major Energy Consumers in South...AEIJjournal2
 
ENERGY STATUS AND ALTERNATIVE ENERGY PLANS OF MAJOR ENERGY CONSUMERS IN SOUTH...
ENERGY STATUS AND ALTERNATIVE ENERGY PLANS OF MAJOR ENERGY CONSUMERS IN SOUTH...ENERGY STATUS AND ALTERNATIVE ENERGY PLANS OF MAJOR ENERGY CONSUMERS IN SOUTH...
ENERGY STATUS AND ALTERNATIVE ENERGY PLANS OF MAJOR ENERGY CONSUMERS IN SOUTH...AEIJjournal2
 
A var analysis of the relationship between energy
A var analysis of the relationship between energyA var analysis of the relationship between energy
A var analysis of the relationship between energyAlexander Decker
 
A var analysis of the relationship between energy
A var analysis of the relationship between energyA var analysis of the relationship between energy
A var analysis of the relationship between energyAlexander Decker
 
Modeling and forecasting energy consumption in ghana
Modeling and forecasting energy consumption in ghanaModeling and forecasting energy consumption in ghana
Modeling and forecasting energy consumption in ghanaAlexander Decker
 
A Comparative Analysis of Renewable Energy Policies and its Impact on Economi...
A Comparative Analysis of Renewable Energy Policies and its Impact on Economi...A Comparative Analysis of Renewable Energy Policies and its Impact on Economi...
A Comparative Analysis of Renewable Energy Policies and its Impact on Economi...ssuser793b4e
 
Role of women in energy management at household level in peshawar, pakistan
Role of women in energy management at household level in peshawar, pakistanRole of women in energy management at household level in peshawar, pakistan
Role of women in energy management at household level in peshawar, pakistanhunypink
 
Roadmap for Indonesia's Power Sector - Summary for Policy Makers
Roadmap for Indonesia's Power Sector - Summary for Policy MakersRoadmap for Indonesia's Power Sector - Summary for Policy Makers
Roadmap for Indonesia's Power Sector - Summary for Policy MakersGandabhaskara Saputra
 
CAUSALITY EFFECT OF ENERGY CONSUMPTION AND ECONOMIC GROWTH IN NIGERIA (1980-2...
CAUSALITY EFFECT OF ENERGY CONSUMPTION AND ECONOMIC GROWTH IN NIGERIA (1980-2...CAUSALITY EFFECT OF ENERGY CONSUMPTION AND ECONOMIC GROWTH IN NIGERIA (1980-2...
CAUSALITY EFFECT OF ENERGY CONSUMPTION AND ECONOMIC GROWTH IN NIGERIA (1980-2...paperpublications3
 
Assessing Energy Policies, Legislation and Socio-Economic Impacts in the Ques...
Assessing Energy Policies, Legislation and Socio-Economic Impacts in the Ques...Assessing Energy Policies, Legislation and Socio-Economic Impacts in the Ques...
Assessing Energy Policies, Legislation and Socio-Economic Impacts in the Ques...ssuser793b4e
 
Awareness on energy management in residential buildings a case study in kajan...
Awareness on energy management in residential buildings a case study in kajan...Awareness on energy management in residential buildings a case study in kajan...
Awareness on energy management in residential buildings a case study in kajan...Basrah University for Oil and Gas
 

Similar a Final proof electricity ijbel vol 2-2013 (20)

ELECTRICITY CONSUMPTION AND ECONOMIC GROWTH IN SWAZILAND
ELECTRICITY CONSUMPTION AND ECONOMIC GROWTH IN SWAZILANDELECTRICITY CONSUMPTION AND ECONOMIC GROWTH IN SWAZILAND
ELECTRICITY CONSUMPTION AND ECONOMIC GROWTH IN SWAZILAND
 
COINTEGRATION RELATIONSHIP BETWEEN ECONOMIC GROWTH, EXPORT AND ELECTRICITY CO...
COINTEGRATION RELATIONSHIP BETWEEN ECONOMIC GROWTH, EXPORT AND ELECTRICITY CO...COINTEGRATION RELATIONSHIP BETWEEN ECONOMIC GROWTH, EXPORT AND ELECTRICITY CO...
COINTEGRATION RELATIONSHIP BETWEEN ECONOMIC GROWTH, EXPORT AND ELECTRICITY CO...
 
Co integration Relationship Between Economic Growth, Export and Electricity C...
Co integration Relationship Between Economic Growth, Export and Electricity C...Co integration Relationship Between Economic Growth, Export and Electricity C...
Co integration Relationship Between Economic Growth, Export and Electricity C...
 
National electric energy supply and industrial productivity in nigeria from 1...
National electric energy supply and industrial productivity in nigeria from 1...National electric energy supply and industrial productivity in nigeria from 1...
National electric energy supply and industrial productivity in nigeria from 1...
 
Analysis of the electricity consumption in the south east geopolitical regi...
Analysis of the electricity consumption in the south   east geopolitical regi...Analysis of the electricity consumption in the south   east geopolitical regi...
Analysis of the electricity consumption in the south east geopolitical regi...
 
PUBLISHED PAPER1
PUBLISHED PAPER1PUBLISHED PAPER1
PUBLISHED PAPER1
 
17084834
1708483417084834
17084834
 
Analysis of Households’ Electricity Consumption with Ordered Logit Models: Ex...
Analysis of Households’ Electricity Consumption with Ordered Logit Models: Ex...Analysis of Households’ Electricity Consumption with Ordered Logit Models: Ex...
Analysis of Households’ Electricity Consumption with Ordered Logit Models: Ex...
 
Energy Status and Alternative Energy Plans of Major Energy Consumers in South...
Energy Status and Alternative Energy Plans of Major Energy Consumers in South...Energy Status and Alternative Energy Plans of Major Energy Consumers in South...
Energy Status and Alternative Energy Plans of Major Energy Consumers in South...
 
ENERGY STATUS AND ALTERNATIVE ENERGY PLANS OF MAJOR ENERGY CONSUMERS IN SOUTH...
ENERGY STATUS AND ALTERNATIVE ENERGY PLANS OF MAJOR ENERGY CONSUMERS IN SOUTH...ENERGY STATUS AND ALTERNATIVE ENERGY PLANS OF MAJOR ENERGY CONSUMERS IN SOUTH...
ENERGY STATUS AND ALTERNATIVE ENERGY PLANS OF MAJOR ENERGY CONSUMERS IN SOUTH...
 
A var analysis of the relationship between energy
A var analysis of the relationship between energyA var analysis of the relationship between energy
A var analysis of the relationship between energy
 
A var analysis of the relationship between energy
A var analysis of the relationship between energyA var analysis of the relationship between energy
A var analysis of the relationship between energy
 
Promoting massive renewable energy by benjamin
Promoting massive renewable energy by benjaminPromoting massive renewable energy by benjamin
Promoting massive renewable energy by benjamin
 
Modeling and forecasting energy consumption in ghana
Modeling and forecasting energy consumption in ghanaModeling and forecasting energy consumption in ghana
Modeling and forecasting energy consumption in ghana
 
A Comparative Analysis of Renewable Energy Policies and its Impact on Economi...
A Comparative Analysis of Renewable Energy Policies and its Impact on Economi...A Comparative Analysis of Renewable Energy Policies and its Impact on Economi...
A Comparative Analysis of Renewable Energy Policies and its Impact on Economi...
 
Role of women in energy management at household level in peshawar, pakistan
Role of women in energy management at household level in peshawar, pakistanRole of women in energy management at household level in peshawar, pakistan
Role of women in energy management at household level in peshawar, pakistan
 
Roadmap for Indonesia's Power Sector - Summary for Policy Makers
Roadmap for Indonesia's Power Sector - Summary for Policy MakersRoadmap for Indonesia's Power Sector - Summary for Policy Makers
Roadmap for Indonesia's Power Sector - Summary for Policy Makers
 
CAUSALITY EFFECT OF ENERGY CONSUMPTION AND ECONOMIC GROWTH IN NIGERIA (1980-2...
CAUSALITY EFFECT OF ENERGY CONSUMPTION AND ECONOMIC GROWTH IN NIGERIA (1980-2...CAUSALITY EFFECT OF ENERGY CONSUMPTION AND ECONOMIC GROWTH IN NIGERIA (1980-2...
CAUSALITY EFFECT OF ENERGY CONSUMPTION AND ECONOMIC GROWTH IN NIGERIA (1980-2...
 
Assessing Energy Policies, Legislation and Socio-Economic Impacts in the Ques...
Assessing Energy Policies, Legislation and Socio-Economic Impacts in the Ques...Assessing Energy Policies, Legislation and Socio-Economic Impacts in the Ques...
Assessing Energy Policies, Legislation and Socio-Economic Impacts in the Ques...
 
Awareness on energy management in residential buildings a case study in kajan...
Awareness on energy management in residential buildings a case study in kajan...Awareness on energy management in residential buildings a case study in kajan...
Awareness on energy management in residential buildings a case study in kajan...
 

Último

Introduction to AI in Higher Education_draft.pptx
Introduction to AI in Higher Education_draft.pptxIntroduction to AI in Higher Education_draft.pptx
Introduction to AI in Higher Education_draft.pptxpboyjonauth
 
The basics of sentences session 2pptx copy.pptx
The basics of sentences session 2pptx copy.pptxThe basics of sentences session 2pptx copy.pptx
The basics of sentences session 2pptx copy.pptxheathfieldcps1
 
microwave assisted reaction. General introduction
microwave assisted reaction. General introductionmicrowave assisted reaction. General introduction
microwave assisted reaction. General introductionMaksud Ahmed
 
Organic Name Reactions for the students and aspirants of Chemistry12th.pptx
Organic Name Reactions  for the students and aspirants of Chemistry12th.pptxOrganic Name Reactions  for the students and aspirants of Chemistry12th.pptx
Organic Name Reactions for the students and aspirants of Chemistry12th.pptxVS Mahajan Coaching Centre
 
Sanyam Choudhary Chemistry practical.pdf
Sanyam Choudhary Chemistry practical.pdfSanyam Choudhary Chemistry practical.pdf
Sanyam Choudhary Chemistry practical.pdfsanyamsingh5019
 
Solving Puzzles Benefits Everyone (English).pptx
Solving Puzzles Benefits Everyone (English).pptxSolving Puzzles Benefits Everyone (English).pptx
Solving Puzzles Benefits Everyone (English).pptxOH TEIK BIN
 
SOCIAL AND HISTORICAL CONTEXT - LFTVD.pptx
SOCIAL AND HISTORICAL CONTEXT - LFTVD.pptxSOCIAL AND HISTORICAL CONTEXT - LFTVD.pptx
SOCIAL AND HISTORICAL CONTEXT - LFTVD.pptxiammrhaywood
 
Concept of Vouching. B.Com(Hons) /B.Compdf
Concept of Vouching. B.Com(Hons) /B.CompdfConcept of Vouching. B.Com(Hons) /B.Compdf
Concept of Vouching. B.Com(Hons) /B.CompdfUmakantAnnand
 
Mastering the Unannounced Regulatory Inspection
Mastering the Unannounced Regulatory InspectionMastering the Unannounced Regulatory Inspection
Mastering the Unannounced Regulatory InspectionSafetyChain Software
 
Separation of Lanthanides/ Lanthanides and Actinides
Separation of Lanthanides/ Lanthanides and ActinidesSeparation of Lanthanides/ Lanthanides and Actinides
Separation of Lanthanides/ Lanthanides and ActinidesFatimaKhan178732
 
CARE OF CHILD IN INCUBATOR..........pptx
CARE OF CHILD IN INCUBATOR..........pptxCARE OF CHILD IN INCUBATOR..........pptx
CARE OF CHILD IN INCUBATOR..........pptxGaneshChakor2
 
APM Welcome, APM North West Network Conference, Synergies Across Sectors
APM Welcome, APM North West Network Conference, Synergies Across SectorsAPM Welcome, APM North West Network Conference, Synergies Across Sectors
APM Welcome, APM North West Network Conference, Synergies Across SectorsAssociation for Project Management
 
Software Engineering Methodologies (overview)
Software Engineering Methodologies (overview)Software Engineering Methodologies (overview)
Software Engineering Methodologies (overview)eniolaolutunde
 
Call Girls in Dwarka Mor Delhi Contact Us 9654467111
Call Girls in Dwarka Mor Delhi Contact Us 9654467111Call Girls in Dwarka Mor Delhi Contact Us 9654467111
Call Girls in Dwarka Mor Delhi Contact Us 9654467111Sapana Sha
 
Measures of Central Tendency: Mean, Median and Mode
Measures of Central Tendency: Mean, Median and ModeMeasures of Central Tendency: Mean, Median and Mode
Measures of Central Tendency: Mean, Median and ModeThiyagu K
 
Accessible design: Minimum effort, maximum impact
Accessible design: Minimum effort, maximum impactAccessible design: Minimum effort, maximum impact
Accessible design: Minimum effort, maximum impactdawncurless
 
The Most Excellent Way | 1 Corinthians 13
The Most Excellent Way | 1 Corinthians 13The Most Excellent Way | 1 Corinthians 13
The Most Excellent Way | 1 Corinthians 13Steve Thomason
 
Contemporary philippine arts from the regions_PPT_Module_12 [Autosaved] (1).pptx
Contemporary philippine arts from the regions_PPT_Module_12 [Autosaved] (1).pptxContemporary philippine arts from the regions_PPT_Module_12 [Autosaved] (1).pptx
Contemporary philippine arts from the regions_PPT_Module_12 [Autosaved] (1).pptxRoyAbrique
 

Último (20)

Introduction to AI in Higher Education_draft.pptx
Introduction to AI in Higher Education_draft.pptxIntroduction to AI in Higher Education_draft.pptx
Introduction to AI in Higher Education_draft.pptx
 
The basics of sentences session 2pptx copy.pptx
The basics of sentences session 2pptx copy.pptxThe basics of sentences session 2pptx copy.pptx
The basics of sentences session 2pptx copy.pptx
 
microwave assisted reaction. General introduction
microwave assisted reaction. General introductionmicrowave assisted reaction. General introduction
microwave assisted reaction. General introduction
 
Organic Name Reactions for the students and aspirants of Chemistry12th.pptx
Organic Name Reactions  for the students and aspirants of Chemistry12th.pptxOrganic Name Reactions  for the students and aspirants of Chemistry12th.pptx
Organic Name Reactions for the students and aspirants of Chemistry12th.pptx
 
Código Creativo y Arte de Software | Unidad 1
Código Creativo y Arte de Software | Unidad 1Código Creativo y Arte de Software | Unidad 1
Código Creativo y Arte de Software | Unidad 1
 
Sanyam Choudhary Chemistry practical.pdf
Sanyam Choudhary Chemistry practical.pdfSanyam Choudhary Chemistry practical.pdf
Sanyam Choudhary Chemistry practical.pdf
 
Solving Puzzles Benefits Everyone (English).pptx
Solving Puzzles Benefits Everyone (English).pptxSolving Puzzles Benefits Everyone (English).pptx
Solving Puzzles Benefits Everyone (English).pptx
 
SOCIAL AND HISTORICAL CONTEXT - LFTVD.pptx
SOCIAL AND HISTORICAL CONTEXT - LFTVD.pptxSOCIAL AND HISTORICAL CONTEXT - LFTVD.pptx
SOCIAL AND HISTORICAL CONTEXT - LFTVD.pptx
 
Concept of Vouching. B.Com(Hons) /B.Compdf
Concept of Vouching. B.Com(Hons) /B.CompdfConcept of Vouching. B.Com(Hons) /B.Compdf
Concept of Vouching. B.Com(Hons) /B.Compdf
 
Mastering the Unannounced Regulatory Inspection
Mastering the Unannounced Regulatory InspectionMastering the Unannounced Regulatory Inspection
Mastering the Unannounced Regulatory Inspection
 
Separation of Lanthanides/ Lanthanides and Actinides
Separation of Lanthanides/ Lanthanides and ActinidesSeparation of Lanthanides/ Lanthanides and Actinides
Separation of Lanthanides/ Lanthanides and Actinides
 
Model Call Girl in Tilak Nagar Delhi reach out to us at 🔝9953056974🔝
Model Call Girl in Tilak Nagar Delhi reach out to us at 🔝9953056974🔝Model Call Girl in Tilak Nagar Delhi reach out to us at 🔝9953056974🔝
Model Call Girl in Tilak Nagar Delhi reach out to us at 🔝9953056974🔝
 
CARE OF CHILD IN INCUBATOR..........pptx
CARE OF CHILD IN INCUBATOR..........pptxCARE OF CHILD IN INCUBATOR..........pptx
CARE OF CHILD IN INCUBATOR..........pptx
 
APM Welcome, APM North West Network Conference, Synergies Across Sectors
APM Welcome, APM North West Network Conference, Synergies Across SectorsAPM Welcome, APM North West Network Conference, Synergies Across Sectors
APM Welcome, APM North West Network Conference, Synergies Across Sectors
 
Software Engineering Methodologies (overview)
Software Engineering Methodologies (overview)Software Engineering Methodologies (overview)
Software Engineering Methodologies (overview)
 
Call Girls in Dwarka Mor Delhi Contact Us 9654467111
Call Girls in Dwarka Mor Delhi Contact Us 9654467111Call Girls in Dwarka Mor Delhi Contact Us 9654467111
Call Girls in Dwarka Mor Delhi Contact Us 9654467111
 
Measures of Central Tendency: Mean, Median and Mode
Measures of Central Tendency: Mean, Median and ModeMeasures of Central Tendency: Mean, Median and Mode
Measures of Central Tendency: Mean, Median and Mode
 
Accessible design: Minimum effort, maximum impact
Accessible design: Minimum effort, maximum impactAccessible design: Minimum effort, maximum impact
Accessible design: Minimum effort, maximum impact
 
The Most Excellent Way | 1 Corinthians 13
The Most Excellent Way | 1 Corinthians 13The Most Excellent Way | 1 Corinthians 13
The Most Excellent Way | 1 Corinthians 13
 
Contemporary philippine arts from the regions_PPT_Module_12 [Autosaved] (1).pptx
Contemporary philippine arts from the regions_PPT_Module_12 [Autosaved] (1).pptxContemporary philippine arts from the regions_PPT_Module_12 [Autosaved] (1).pptx
Contemporary philippine arts from the regions_PPT_Module_12 [Autosaved] (1).pptx
 

Final proof electricity ijbel vol 2-2013

  • 1. ELECTRICITY CONSUMPTION AND ECONOMIC GROWTH: A Causality Evidence from Six Economic Corridors of Indonesia, 1984-20101 Timotius D. Harsono Lecturer in International Relation, National Resilience Institute RI. Ph.D Candidate, Policy Study, Gadjah Mada University, Yogyakarta, Indonesia Email: timotius-d-harsono@lemhannas.go.id tim.harsono@gmail.com (Phone: +62816856773) Mudrajad Kuncoro Professor in Economics, Faculty of Economics & Business, Gadjah Mada University, Yogyakarta, Indonesia Email: profmudrajadk@gmail.com URL: http://www.mudrajad.com (Phone: +62811254255) ABSTRACT The relationship between electricity consumption and GDP in Indonesia has been examined in some previous studies. However, none of them has tested the causal relationship between electricity consumption and Gross Regional Development Product (GRDP) of regions within a country. Yudhoyono’s government launched Master Plan for Acceleration and Expansion of Indonesia Economic Development (MP3EI) by setting six major economic corridors on 27 of May 2011. However, the regional implementation of electricity development policy has not been elaborated in MP3EI document. Our study will explore further the relationship between electricity consumption and economic growth in six economic corridors as set in the MP3EI. This relationship is important to be identified to understand the policy implications on electricity in the context of regional autonomy and development. Our analysis is a pioneering study of Indonesia’s electricity consumption and economic growth that incorporates “geography” into economic analysis of causality during 1984-2010. Using Granger causality tests and Error Correction Model (ECM), our empirical findings shows that: (1) there is uni-directional short run relationship moving from electricity consumption per capita to GDP per capita for Indonesia as a single region; (2) the causality tests for Sumatra economic corridors shows there is an uni-directional short run relationship moving from electricity consumption to economic growth, meanwhile the tests for Kalimantan shows an opposite short run uni-directional relationship; (3) the causality tests do not show any causal relationship for other corridors (Jawa, Sulawesi, Bali-Nusa Tenggara, and Papua-Kepulauan Maluku). Finally, the findings suggest that fundamental changes in electricity and regional development policies are required. Indonesia needs electricity and regional policy that incorporates regional variations in term of electricity consumption, economic growth, and GRDP per capita. Keywords: Electricity Consumption, GDP, GRDP, Corridors, Granger Causality, ECM 1 This paper is presented at the Kuala Lumpur International Business, Economics, and Law Conference KLIBEL 2013, Kuala Lumpur Malaysia, 8-9 April 2013. I am grateful for the comments from the anonymous reviewers of International Journal of Business, Economics, and Law, volume 2, 2013. Our appreciation also goes to our assistants, Fatkhu Ridho FEP and M. Irka Irfa’Darojat. 1
  • 2. 1. INTRODUCTION The relationship between electricity consumption and economic growth has become a primary topic and controversial issue in the US, Europe, and Asia, since 1970s (e.g. Kraft & Kraft, 1978; Altinay & Karagol, 2005; Shiu & Lam, 2004; Jumbe, 2004; Yoo, 2005). The empirical studies found some controversial results with respect to the causal relationship between electricity consumption and economic growth that can be summarized into four types, as follows (Chen, et al. 2007): First, the uni-directional causality moving from electricity consumption to economic growth implies that restrictions on the use of electricity may affect economic growth adversely while increases in electricity supply may contribute to economic growth. Second, the unidirectional causality moving from economic growth to electricity consumption would suggest that a permanent increase in economic growth may result in a permanent increase in electricity consumption. Third, a bi-directional causal relationship implies that electricity consumption and economic growth are jointly determined and affected at the same time. Fourth, the absence of causal relationship implies that: (1) the electricity consumption is not correlated with economic growth; (2) neither conservative nor expansive policies related to electricity consumption have any effect on economic growth. Indonesia is an excellent laboratory for testing which directions of causality between electricity consumption and economic growth occur. One of most striking issues is that generating electric capacity growth in Indonesia has lagged behind the pace of electricity demand growth, leading to power shortages and a low electrification ratio. Although Indonesia's generating capacity has increased by more than a quarter in the last decade, the country has a low electrification ratio compared to similar income countries. In 2013, around 76% of Indonesia's population had access to electricity. Indonesian Eastern Regions (Kawasan Timur Indonesia, KTI) lags behind the Indonesian Western Region (Kawasan Barat Indonesia, KBI), with some provinces only providing electricity to a third of the population (Figure 1). Figure 1. Electricity Ratio By Province, Indonesia 2005-2014 Source: Ministry of Energy and Mineral Resource (MEMR) (2011) US-EIA (2013) indicates two important features of electricity supply. First, state-owned electric utility company, PT PLN (Perusahaan Listrik Negara), is the most significant company in the electric power sector. PLN owns and operates about 90% of the country's generating capacity through its subsidiaries, and maintains an 2
  • 3. effective monopoly over distribution activities. Although the most recent 2009 Electricity Law ends PLN's distribution monopoly, there is a lack of sufficient regulations to enforce this law. Second, Indonesia had an estimated 44 gigawatts (GW) of installed capacity in 2011 and generated 192 billion kilowatt-hours (kWh). In addition, 86% of the power came from conventional thermal sources, with the rest coming from hydroelectric (9 percent), geothermal (5 percent), and other renewable sources. Coal accounted for just over half of conventional thermal power. The outline of this paper is as follows. First, it will highlight some surveys of literature on causality tests between electricity consumption and GDP. The relationship between electricity consumption and GDP in Indonesia has been examined by some previous studies (Murry & Nan, 1996; Yoo, 2006; Chen, et al., 2006). Second, it will discuss briefly the data and methology used in our study. Third, our analysis of the relationship between electricity consumption and economic growth in Indonesia will cover: (a) the causal relationship between national electricity consumption and Gross Development Product (GDP) and (b) the causal relationship between Regional Electricity Consumption (REC) and Gross Regional Development Product (GRDP) of each economic corridor. Our focus of the analysis will be emphasised on the 6 economic corridors, i.e. Sumatra, Jawa, Kalimantan, Sulawesi, Bali–Nusa Tenggara, and Papua–Maluku, as set by the recent Master Plan of Acceleration and Expansion of Indonesia Development (Master Plan Percepatan Pembangunan Indonesia, MP3EI). Concluding remarks and policy implications are given in the final section. 2. LITERATURE REVIEW The electricity Law No. 30 year 2009, in particular article 2.2, indicates that the essentially purpose of this law is to secure the availability of sufficient and good quality electric power with effordable price to increase the welfare of all Indonesian people (MEMR, 2011b). The PLN is a state owned company and mandated by the law to provide electricity service as a single operator. Esentially, the main objectives of the electricity law is to support the improvement of people’s welfare and promote economic growth. In order to achieve these objectives, the goverment has prioritized to fulfill electricity demand of household and industrial sector (MEMR, 2010). In the last few years, the electrification ratio has increased significantly from 62% (2005) to 67.2% (2010). In 2014, it is projected to reach 80%. The supply of electricity for industry and business sectors is closely related to economic growth. On the other hand, the infrastucture development required to increase the electricity supply needs huge amount of investment. So far, the electricity policies and regulations has been focused more on the supply side, rather than serving the demand side. The policy implementation are incorporated in some official documents, such as Energy Outlook 2008-2010, Annual State Budget and Expenditure Report (Nota Keuangan & RAPBN), and MP3EI. The general policy in energy sector (including electricity) is mostly supply and price oriented. The electricity price is driven by subsidy level, which is mostly aimed to control the inflation level. The electricity consumption per annum is increasing rapidly in line with the increasing national economic growth and the changes of paradigm in the society to meet their day to day life style needs, especially in household and industrial sector (Table 1). The electricity demand during 2006-2010 had been increasing with average growth of 6.3% annually. While the electricity infrastructure development can only provide additional supply with an average growth of 4.4% in the same period. 3
  • 4. Table 1. Electricity Consumption and Economic Growth, Indonesia 2000-2010 Population GDP per Capita Year Quantity 2000 2001 2002 2003 2004 2005 2006 2007 2008 2009 2010 205,132.00 208,900.60 212,003.50 215,152.38 217,854.10 220,553.07 223,013.78 225,642.50 228,523.30 231,369.50 237,641.00 Annual Annual in Million Rp Growth (%) Growth (%) 1.12 6.70 6.25 1.84 7.20 7.46 1.49 7.60 5.56 1.49 8.30 9.21 1.26 10.64 28.19 1.24 12.45 17.01 1.12 15.03 20.72 1.18 17.60 17.10 1.28 21.70 23.30 1.25 24.30 11.98 2.71 27.22 12.02 Average 14.44 Economic Growth (%) 4.92 3.64 4.50 4.78 5.03 5.69 5.50 6.35 6.01 4.55 6.50 5.22 Electricity Consumption per Capita Annual KWh Gwh Growth (%) 389 3.20 405 4.11 411 1.48 420 2.19 459 9.29 485 5.66 505 4.12 579 14.65 565 -2.42 560 -0.88 619 10.54 4.72 Source: Compiled from BPS (2013); MEMR (2010b) The disequilibrium between actual demand and the supply of electric power has created shortage of electricity supply in certain regions, especially those regions outside PLN interconnective region of Jawa-Madura-Bali. The 1998 economic crisis has slowed down the development of electricity infrastructure in Indonesia. During the period of economic recovery, the growth of the installed electric power capacity was only increased by the rate of 1.13% (MEMR, 2010b). Electricity consumption of Indonesia increased from 112,609 giga watt hour (Gwh) in 2006 to 147,297 GWh in 2010, with average increase of 6.6%. Such increase of electricity comsumption mainly is driven by the increase of consumption households and industrial sectors. Table 1 shows the trend of electricity consumption increase was not always followed by economic growth within the period of 2000– 2010. This condition seems to be in line with the finding of Yoo (2006) which argued that the consumption of electricity in Indonesia did not significantly impact the economic growth. This condition may be caused by the fact that the consumption of electricity in Indonesia are used more to meet the need of household sector, while less portion of electric power are allocated to fullfill the demand of industrial sector and other economic activities that can stimulate the economic growth strongly (Table 2). Table 2. Electricity Demand By Group of Users (Gwh), 2006-2010 Household Commercial Industry Others 2006 43.754 18.415 43.615 6.825 Electric Power Consumption (Gwh) 2007 2008 2009 47.324 50.184 54.945 20.608 22.926 24.638 45.802 47.969 46.017 7.510 7.940 8.607 2010 59.825 27.157 50.985 9.330 Total 112.609 121.246 147.297 Group of Users 129.019 134.207 Source: MEMR (2010b) Causality tests between electricity consumption and GDP in Indonesia have been examined earlier by Murry & Nan (1996) using 1970-1990 period and Yoo (2006) using 1971-2002 period (Table 3). Yoo (2006) used the standard Granger causality test and found uni-directional relationship moving from GDP to electricity consumption. This finding shows a conformity to the finding of Murry & Nan (1996). In contrast to the finding of Yoo (2006) and Murry & Nan (1996), the causality test performed by Chen, et al. (2006) using Granger causality test and Error Correction Model (ECM) found a long run relationship moving from electricity consumption to economic growth (Table 3). These studies used single country data set for each country and also applied data panel for 10 selected countries in Asia. 4
  • 5. Table 3. Previous Causality Tests Related to Electricity Consumption and GDP in Indonesia Authors (Year) Murry& Nan (1996) Yoo (2006) Chen (2006) Methodology Time Period Causal Relationship Standard Granger causality test Standard Granger causality test Granger Causality and Error Correction Model 1970–1990 1971–2002 Income  Electricity Income  Electricity 1971-2001 Electricity  Income Our study uses modified Granger causality test with ECM applied to time series data within the period of 1984-2010. These model are employed to find the nature of the causal relationship between electricity consumption and economic growth, both for Indonesia as a single region and each region of the 6 economic corridors as set by MP3EI document. Our study sought to inject empirical content to the emerging interest in the causality literature by examining electricity consumption and regional economic growth in the context of Indonesia’s recent regional autonomy. By analyzing 6 regional economic corridors, we attempt to incorporate “geography” into economic analysis of causality with newer time horizon (1984-2010). 3. METHODOLOGY 3.1. Data This study will use annual time series data for Indonesia as one single country data set, as well as for 6 economic corridors within Indonesia, namely Sumatra, Jawa, Kalimantan, Sulawesi, Bali-Nusa Tenggara, and Papua-Maluku. The annual data for real GDP is obtained from Badan Pusat Statistik (BPS) and the annual data for electric power consumption is obtained from PLN. The data period (1984-2010) is determined based on the availability of regional electricity consumption and regional income data. The real GDP and GRDP are expressed in rupiah at constant price of year 2000 while the electric power consumption is expressed in unit of Kilowatt hours (KWh). The real GDP and real GRDP as well as National Electricity Consumption (NEC) and Regional Electricity Consumption (REC) are transformed into natural logarithms to reduce heteroscedasticity. The logarithm variables have its economic meaning since they are approximated to be viewed as the growth of the respective differenced variables. The unit roots, cointegration tests, Granger causality tests, and ECM model estimation are performed by Eviews 6.0. Instead of using only aggregate data of Indonesia as one unit analysis, this study will also use a quantitative data of 33 provinces and 14 PLN distributive regions which are regrouped into 6 economic corridors in line with the MP3EI (Table 4). Sumatra economic corridor connects its main economic centers from Banda Aceh (in Aceh province), Medan, Pakanbaru, Jambi, Palembang, and Bandar Lampung (in Lampung province). Java’s economic corridors connect its main economic centers from Banten, Jakarta, Bandung, Semarang, Yogyakarta, to Surabaya. Major economic centers of Kalimantan are Pontianak, Palangkaraya, Banjarmasin, and Samarinda will be connected with the Corridor Connectivity Lane. Sulawesi corridor is expected to be Production and Processing Center of Agricultural, Agriculture, Fisheries, Oil and Gas and Mining National, and become the forefront in serving markets of East Asia, Australia, Oceania, and America via its major centers (Makasar, Mamuju, Kendali, Palu, Gorontalo, Manado). Major economic centers of Bali-Nusa Tenggara corridor are Denpasar, Lombok, Kupang. Papua-Maluku, have been designed to be the Centers for Development of food, fisheries, energy, and national mining that connects its main economic centers from Ambon,Sofifie,Sorong,Manokwari,Timika,Jayapura, Merauke. 5
  • 6. Table 4. Six Economic Corridors based on Electricity Consumption Data of 14 PLN Distributive Regions, GRDP Data of 33 Provinces, and MP3EI’s Theme 6 Economic MP3EI’s Theme 14 Distributive Regions of PLN Corridors 1. NAD: Nangroe Aceh Darusalam (NAD) Province 2. North Sumatra: North Sumatra Province Center for Production and Processing of 3. West Sumatra Riau: West Sumatra, Riau and Natural Resources As SUMATRA Riau Islands Provinces The Nation’s Energy 4. S2JB, Babel & Lampung: Jambi, South Reserves Sumatra, Bangka Belitung Islands, Bengkulu and Lampung Provinces 5. West Java and DKI: Special District of Jakarta, West Java and Banten Provinces Driver for National 6. Central Java and DIY: Central Java and Industry and Services JAVA Yogyakarta Special Region Provinces Provision 7. East Java: East Java Province 9. West Kalimantan: West Kalimantan Province 10. Central-South Kalimantan & East Kalimantan: South Kalimantan, Central Kalimantan, and East Kalimantan Provinces 11. Suluttenggo: North Sulawesi, Gorontalo and Central Sulawesi Provinces 12. Sulselra: South Sulawesi, West Sulawesi and South-East Sulawesi Province BALI – NUSA TENGGARA Gateway of Tourism and Food National Support KALIMANTAN Center for Production and Processing of National Mining and Energy Reserves SULAWESI Production and Processing Center of Agricultural, Agriculture, Fisheries, Oil and Gas and Mining National PAPUA – MALUKU 8. Bali, West Nusa Tenggara and East Nusa Tenggara: Bali, West Nusa Tenggara and East Nusa Tenggara Province Center for Development of Food, Fisheries, Energy, and National Mining 13. Maluku: Maluku and North Maluku Province 14. Papua: Papua and West Papua Provinces Source: PLN (2011); BPS (2011); CMEA (2011: 51, 74, 96, 120) 3.2. Causality Test This study will use Granger causality test and ECM including stationary and cointegration test. Prior to applying Granger causality test, it is imparative to ensure that time series data related to electricity consumption and economic growth are stationary. The stationarity test is done by applying unit roots tests to find out whether the two variables (NEC/REC and GDP/GRDP) are stationary at 0 level, first difference, or second difference. If both variables are not stationary at all level, then the result of the time series data regression will be spurious, which is indicated by time series data regression with a high R2 value but the regression coeficient is not significant (Gujarati, 2003). In order to make sure the data of two variables are stationary, Augmented Dickey Fuller (1981) model is used to perform unit root tests. This model is as follows: ∑ (1) ∑ (2) whereas, y is the variable to be tested and t is the time trend. The first equation uses no time effect while the second one uses a fixed time effect. The lag length, i, are 6
  • 7. chosen using Akaike’s Information Criterion (AIC). When the null hypothesis H0 : r = 0 is accepted, this implies that the variable has unit root and is not stationary. The first difference is thus taken to test for the stationarity of the data set before the Grangercausality test is implemented (Chen, et al., 2006). ADF model is applied to test the stationary using time fixed effects and no time effects methods. The time fixed effects methods with trend and intercept is used to find out at what level the data is stationary. Trend and intercept are to show the result of unit root test using Random Walk Model (RWM) which indicates the deterministic trend and the time shift. No time effects method is to show the result of unit root test without using trend and intercept, hence it does not indicate the time shift. The result of ADF test will be compared to McKinnon critical value at certain level (α) to find out if the data is stationary. It is important to select the optimal lag to be applied in this model because if the lag used in this stationarity test is too small, then the residual of the regresion will not show white noise process. At this point, the ADF model cannot estimate the error accurately. In the contrary, if the selection of lag is too big, it may reduce the capability to reject the null hypotesis (H0), because if the parameter value is too big then it will reduce the degree of freedom (Harris, 1995: 65). The selection of optimal lag can lead to the most appropriate finding with uncorrelated residual. ADF model applied in this study is to emphazise more on the consistency rather than efficiency. Therefore, the automatic selection method is performed using EViews 6.0 to determine the optimal lag by using the value of AIC as referrence. The AIC value is used because it is more consistent compared to the value obtained using Schwarz Information Criteria (SIC) and Hannan-Quinn Information Criteria (HQIC) (Shatland, 2008). Johansen cointegration test is applied to find out whether NEC/REC and GDP/GRDP has a long run relationship. The optimal lag for each corridor is selected based on each of its AIC value. If the NEC/REC and GDP/GRDP variables are stationary at the first difference, then both variables are most probably cointegrated, hence, Error Correction Terms is applied to perform modified ECM causality test to find out whether there is any long run causal relationship. The relationship between electricity consumption and GDP, as well as GDRP, will be examined by applying Granger causality test and ECM as has been performed by Chen (2006). These methods are used to show the relationship between electricity consumption (NEC/REC) and economic growth (GDP/GRDP) in Indonesia, as well as in each of those 6 economic corridors. The characteristic of the relationship includes: (1) Is there any uni-directional relationship moving from NEC/REC to GDP/GRDP?; (2) Is there any uni-directional relationship moving from GDP/GRDP to NEC/REC?; (3) Is there any bi-directional relationship between GDP/GRDP and NEC/REC?; (4) Is there no relationship at all between GDP/GRDP and NEC/REC? (5) Is the nature of the relationship (if any) of both variables show a long run or short run relationship. It is imparative to understand the characteristic of the relationship between electricity consumption and the economic growth since the nature of such relationship has different policy implication toward both sectoral related to electricity and regional policy. The result of this causality tests implies that the past events have impacted on the present events, not the future ones. In the case NEC and GDP variables are not stationary, but become stationary after unit roots test at the first diferrence, and after further Johansen cointegration test both variables are not cointegrated, then standard Granger causality test is applied, as shown in the following equations: 7
  • 8. ∑ ∑ (3) ∑ ∑ (4) If the Johansen cointegration shows that both variables are cointegrated, then modified ECM Granger causality test is applied by using Error Correction Term, as follows: ∑ ∑ ∑ ∑ (5) (6) whereas, NEC is national electricity consumption and GDP is Gross Domestic Product in the form of natural logarithm, Δ is diferrence operator, q is the lag, α is the parameter to be estimated, µ is serially uncorrected error term, and is error correction term which is obtained from cointegration test. In case the unit roots and the cointegration test show hat the data is stationary and cointegrated, then modified ECM causality test is used. Equations 3 and 4 shows that ∆NEC has short run effects on ∆GDP if the estimated coefisien (α12s) is stastically significant as shown by the value of statistik F. Equations 5 and 6 show the application of ECM by including the dependent variables with each of its lag and the disequilibrium of the previous error correction term, . The long run causal relationship can be determined by the level of significance of the coefisien ( ) for error correction term based on t statistic test. By going through the same procedure as defined in equation 5, we can test the long run causal relationship from ∆GDP to ∆NEC (equation 6). The causality tests between REC and GRDP variables for 6 economic corridors also use the same model and procedures as the causality test for Indonesia as a single region. The Method is based on the Granger causality to find the direction of causal relationship, whereas the ECM is applied by using Error Correction Term to find out whether there is any long run causal relationship. The equations can be stated as follows: ∑ ∑ ∑ (7) ∑ (8) Modified Granger causality and ECM are applied to examine whether there is any long run causal relationship by obtaining the residual value and use it as Error Correction Term, as stated in the following equations: ∑ ∑ (9) ∑ ∑ (10) whereas, REC is regional electricity consumption and GRDP is gross regional development product in the form of natural logarithm. 8
  • 9. 4. FINDINGS AND ANALYSIS 4.1. Unit Roots and Cointegration Tests 4.1.1. Test Result for Indonesia (as a Country Data Set) The result of ADF test using No Time Effects model shows that the NEC variable is not stationary at level as well as at first difference with significance of 5%. However, NEC variable becomes stationary at the first difference with significance of 5% if time fixed effects is applied. On the other hand, the ADF test using both No Time Effects and Time Effects model shows that the GDP variable is not stationary at level with significance of 5%, however, GDP variable becomes stationary at the first difference with significance of 5% (Table 5). Table 5. Result for Unit Roots Test between NEC and GDP Variable in Indonesia, 1984-2010 ADF Region Variable No Time Effects Lag NEC 1 GDP 0 Indonesia Level Lag 1.54 ( 0.9664) 1.93 ( 0.9846) 0 0 Time Fixed Effects ∆ -1.59 ( 0.1025) -4.17* ( 0.0002) Lag 0 1 Level -0.98 ( 0.9291) -3.35 ( 0.0800) Lag ∆ -4.34* ( 0.0106) -3.64* ( 0.0491) 0 3 Notes: ∆ denotes first differences. All variables are in natural logarithms; NEC and GDP in per capita; ADF = Augmented Dickey Fuller; * Means that the null of the unit root in the ADF tests is rejected; The lag lengths are selected using AIC; Number in parentheses are P-value The result of stationary test using ADF model with time fixed effect as well as no time effects show that the data of NEC and GDP is stationary at the first difference, and therefore we can proceed with Johansen cointegration test. Table 6 shows the result of cointegration tests between NEC and GDP variables. This test shows that the trace statistic value and maximum Eigenvalue is smaller than the significance of 5%. This result shows no cointegration between NEC and GDP. In this case, we cannot proceed by applying ECM to find whether there is any long run relationship between the two variables. At this point, standard Granger causality test is applied to examine whether there is any short run relationship. Table 6. Results for Cointegration Test between NEC and GDP Variable in Indonesia, 1984-2011 Region Null Hypothesis Lag Johansen Test Statistic Trace 15.99982 15.1362 0.863584 R=0 Indonesia Cointegraton Max-eigen 0.863584 1 No R≤1 Notes: NEC and GDP in per capita; r = the number of the vector cointegration; * means that the null hyptothesis of no cointegration relationship is rejected at the 5% level; The optimal lag lengths are selected using Akaike’s information criterion 9
  • 10. 4.1.2. Test Result for Six Economic Corridors The result of stationary test on both variables (REC and GRDP) using ADF method is shown in Table 7. ADF tests indicate that REC for Sumatra, Jawa, and Kalimantan corridors are not stationary at 0 level as well as at the first difference with the significance of 5%, but become stationary at the first difference with the significance of 10%. The GRDP variable for the three corridors are stationary at the first difference with the significance of 5%. The REC and GDRP in Sulawesi, Bali-Nusa Tenggara, and Papua-Kepulauan Maluku corridors are stationary at the first difference with the significance of 5%. Table 7. Results for Unit Roots Test between REC and GRDP Variable in 6 Indonesia’s Economic Corridor, 1984-2010 ADF Corridors Variable Lag Papua – Kepulauan Maluku 4 REC 1 2 REC 0 0 REC 1 GRDP Bali – Nusa Tenggara 4 GRDP Sulawesi REC GRDP Kalimantan 0 GRDP Jawa 2 GRDP Sumatra REC 0 REC 0 No Time Effects Level Lag 1.88 (0.9827) 1.10 (0.9252) 0.23 ( 0.7442) 3.25 (0.9992) 1.34 (0.9510) 0.20 (0.7380) 9.25 (1.0000) 2.40 (0.9946) 2.36 (0.9940) 1.64 (0.9725) 4.39 (1.0000) 0.13 (0.7165) 1 0 4 0 1 1 1 0 5 0 0 ∆ -1.76** (0.0741) -4.49* (0.0001) -1.8** ( 0.0644) -4.13 (0.0002) -1.22 ( 0.1948) -5.11* (0.0000) -1.21 (0.1995) -4.36* (0.0001) -1.23 (0.1921) -5.01* (0.0000) -2.53* (0.0137) -5.28* (0.0000) Lag 2 1 2 0 0 1 0 0 0 0 0 Time Fixed Effects Level Lag ∆ -1.79 (0.6737) -3.07 ( 0.1327) -1.03 (0.9199) -2.78 (0.2156) -1.53 ( 0.7889) -3.34 (0.0820) -2.39 (0.3718) -1.74 (0.7000) -0.74 (0.9580) -2.68 (0.2513) -2.13 (0.5041) -3.00 ( 0.1498) 3 1 1 3 0 1 0 2 0 3 0 -2.71 (0.2409) -4.05* (0.0204) -4.34* ( 0.0015) -4.04* (0.0222) -3.44** (0.0676) -4.98* ( 0.0028) -4.32* (0.0111) -3.23 (0.1027) -4.98* (0.0026) -3.12 ( 0.1242) -4.82* (0.0039) -5.10* (0.0020) GRDP 0 0 0 0 Notes: ∆ denotes first differences. All variables are in natural logarithms; REC and GRDP in per capita; ADF = Augmented Dickey Fuller; * Means that the null of the unit root in the ADF tests is reejected; ** Means that the null of the unit root in the ADF tests is rejected; The lag lengths are selected using AIC; The number in parentheses are P-value. Table 8 shows the Johansen cointegration test for variable REC and GRDP for each corridor during the period of 1984-2010. The optimal lag selected for each corridor is determined by using the AIC value as reference. The cointegration test result shows that the trace statistic value and maximum eigenvalue is greater than the critical value at the significance of 5% for Sumatra, and Kalimantan, Bali–Nusa Tenggara, and Papua-Kepulauan Maluku. Therefore, the hypotesis which states there is cointegration between the two variables in Sumatra corridor are proven. As for Jawa and Sulawesi corridors, the trace statistic value and maximum eigenvalue are smaller than the critical value at the significance of 5%. The result of these tests indicates that for Sumatra, Kalimantan, and Bali-Nusa Tenggara, hence, Error Correction Model may be applied to examine whether there is any long run causality relationship in those three corridors. 10
  • 11. Table 8. Results for Cointegration Test between REC and GRDP Variable in 6 Indonesia’s Economic Corridors, 1984-2010 Corridors Null Hypothesis Optimal Lag Johansen Test Statistic Max-eigen Trace Cointegration 21.06203* 23.64630* R=0 1 Yes 2.584269 2.584269 R≤1 14.50134 14.50134 R=0 Jawa 1 No 0.020588 0.020588 R≤1 21.71951* 30.03826* R=0 Kalimantan 5 Yes 8.318755 8.318755 R≤1 10.43199 10.78349 R=0 Sulawesi 1 No 0.351501 0.351501 R≤1 20.77115* 21.14443* R=0 Bali1 Yes Nusa Tenggara 0.373289 0.373289 R≤1 9.299099 12.79955 R=0 Papua1 No Kepulauan Maluku 3.500455 3.500455 R≤1 Notes: REC and GRDP in per capita; r = the number of the vector cointegration; * means that the null hyptothesis of no cointegration relationship is rejected at the 5% level; The optimal lag lengths are selected using Akaike’s information criterion. Sumatra 4.2. Causality Tests 4.2.1. The result of Causality Tests for Indonesia The results of Granger causality test for Indonesia is obtained by applying data within the period of 1984-2010 (Table 9). The result of F statistic shows the evidence of short run uni-directional relationship moving from economic growth per capita (∆GDP per capita) to electric consumption growth per capita (∆NEC per capita). The short run causal relationship between ∆NEC per capita and ∆GDP per capita can be seen at Table 9 column (3). The statistic F shows that the probability of ∆NEC per capita does not have any influence to ∆GDP per capita is only 0.0884 or smaller than the significance of 10%, therefore the null hypotesis which states that ∆NEC do not have any influence on ∆GDP is rejected. In the contrary, the probability of ∆GDP per capita does not influence ∆NEC per capita is 0.2319 or it is greater than significance of 10%. This finding shows that the growth of electricity consumption in Indonesia has influenced the growth of GDP. In other words, the findings shows that the electricity consumption in Indonesia tend to be demand driven. Table 9 column (4) shows that the result of t statistic test does not prove any long run relationship both from electricity consumption growth per capita (NEC per capita) to economic growth per capita (GDP per capita) or from economic growth to electricity consumption growth. This is reflected by the insignificant t-value between those two variables. The result of F statistic test does not show any joint short run/long run relationship moving from electricity consumption growth per capita to economic growth per capita. This F statistic test also does not show joint short/long run relationship from the opposite direction. The absence of joint short run/long run relationship, is shown by Table 9 column (5), whereas the result of F statistic test indicates that the probability of NEC per capita does not influence the GDP per capita is 0.9509 or it is greater that the significant level of 5%. This test also shows that the probability of GDP per capita does not influence the NEC per capita is 0.7540 or it is greater that the significant level of 5%. 11
  • 12. Table 9. Results for Causality Test between NEC and GDP Variable in Indonesia, 1984-2010 Sources of Causation Region (1) Null Hypothesis (2) Short run (3) Long run (4) F-statistics t-statistics ∆NEC ∆NEC does not cause ∆GDP Indonesia ∆GDP 3.1785** (0.0884) 1.51130 (0.2319) ∆GDP does not cause ∆NEC εt-1 1.369681 (0.2988) 1.065393 (0.1853) Joint (short run/long run) (5) F-statistics ∆NEC, ∆GDP, εt-1 εt-1 0.00388 (0.9509) 0.10093 (0.7540) Notes: NEC and GDP in per capita; The lag length are selected using Akaike’s information criterion; * Means that the null hypothesis of no causation is is rejected at the 5% level; ** Means that the null hypothesis of no causation is is rejected at the 10% level; The number in parentheses are P-value. The finding of causality test in this study does support the finding of Chen, et al. (2006), whereas the causal relationship is uni-directional moving from electricity consumption to GDP. However, the finding of this study shows short run relationship, whilst the relationship found by Chen (2006) is long run. On the other hand, the finding in this study challenges the finding of Yoo (2006) and Murry & Nan (1996) in which both findings show uni-directional relationship moving from economic growth to electricity consumption growth. The finding in this study shows the presence of short term relationship moving from electricity consumption per capita to economic growth per capita. This finding suggests that in short run, the implementation of conservation policy by limiting electricity consumption may negatively impact the economic growth. Whilst the increase of electricity demand can lead to an increase the consumption level which will give positive contribution to the economic growth. 4.2.2. The Result of Causality Tests in Six Corridors To understand the nature of causal relationship of each economic corridor within Indonesia, it is necessary to perform causality test by applying the electricity consumption data of 14 PLN distributive regions and the regional economic data of 33 provinces. Data at provincial level are regrouped into six economic corridors in line with the directive of MP3EI document. Considering the size of Indonesia territory and the geographical location of each corridor, it is useful to run causality test for the six corridors to find out the relationship of regional electric consumption and the GRDP for each corridor. The objective of this test is to provide evidence that both the causality between electricity consumption and the economic growth in each region and their regional variations will offer new insights for regional and national electricity policy. The general direction of the policy formulated in MP3EI document essentially is to accelerate and expand the economic development in each corridor with the main objective is to create high and sustainable economic growth (above 7%), to reach all regions and more balanced growth (CMEA,2011). To create high quality economic growth, the presence of infrastructure development in all economic corridors is absolutely required to support its regional development. Table 10 shows the economic indicators and the characteristic of electricity consumption in each economic corridor indicate regional variations matter. Jawa is one of the smallest corridor in terms of size of island among others but by far it has 12
  • 13. the highest concentration of 55.78% of total population, followed by Sumatra with 22.43% of total population. Jawa and Sumatra regions represent the KBI with 30.63% of the total area and 78.21% of the total population of Indonesia. In terms of GRDP, KBI contributes 82.12% of the national GDP. In contrast, the other four corridors within KTI, i.e. Kalimantan, Sulawesi, Bali-Nusa Tenggara, and Papua-Maluku, only account for 6.11%, 7.17%, 5.78%, and 2.73% of the total Indonesia’s population respectively. Table 10. Economic and Electricity Consumption Indicator in 6 Indonesia’s Economic Corridors (2010) Corridors Population GRDP per capita % Millons % Sumatra 22.43 50.63 93.98 Jawa 55.78 125.97 109.44 Kalimantan 6.11 13.78 140.33 Sulawesi 7.17 16.21 67.02 Bali-Nusa Tenggara 5.78 13.07 47.80 Papua-Kepulauan Maluku 2.73 6.16 63.63 225.82 100.0 Total (Indonesia) 100.0 Sources: Calculated from BPS (2011); PLN (2011) Rp Millions 9.24 10.76 13.80 6.59 4.70 6.25 9.84 Electricity Consumption per capita % KWh 60.30 388.64 135.75 874.70 57.74 372.13 48.58 313.12 50.57 325.90 30.40 195.93 100.0 644.46 KBI region with only representing 30.63% of the national territory has a portion of 78.21% of national population and 82.12% of GDP. In contrast, KTI region, representing 69.37% of the national territory, has only a portion of 21.79% population and contributing only 17.88% of national GDP. The imbalanced population concentration and economic activities between KBI and KTI regions have created serious disparity across regions, between and within islands in the Indonesia’s economic development (Kuncoro, 2013, 2012). In terms of income per capita, Kalimantan with Rp13.8 millions per capita has the highest income per capita among all other regions, followed by Jawa (Rp10.76 million per capita), Sumatra (Rp9.24 million per capita), Sulawesi (Rp6.59 million capita), Papua-Maluku (Rp6.25 million per capita), and Bali-Nusa Tenggara (Rp4.7 million per capita). In terms of electricity consumption, the highest electricity consumption per capita is in Jawa (874.70 Kwh per capita), followed by Sumatra (388.64 Kwh per capita), Kalimantan (372.13 Kwh per capita), Bali-Nusa Tenggara (325.90 Kwh per capita), Sulawesi (313.12 Kwh per capita), and Papua-Kepulauan Maluku (195.93 Kwh per capita). Figure 2 shows the regional typology by REC per capita and GRDP per capita of the six economic corridors. By calculating the average REC per capita as the vertical axis and the average GRDP per capita as the horizontal axis, the 33 provinces in Indonesia can be divided into four groups, namely: high electricity consumption and high income, high income but low electricity consumption, high electricity consumption but low income, and relatively backward provinces with low electricity consumption and low income. Jawa corridor has GRDP per capita and REC per capita far aboved the national average. Whilst, Sumatra and Kalimantan have GRDP per capita higher than national average, but their electricity consumption per capita are lower than national average. The three other regions, those are Sulawesi, Bali-Nusa Tenggara and Papua-Kepualuan Maluku have both REC per capita and GRDP per capita below the national average. 13
  • 14. Figure 2. Scatter Plot of GRDP Per Capita and REC Per Capita in 6 Indonesia’s Economic Corridors, 1984-2010 Sources: Calculated from PLN (2011) and BPS (2011) In the case of Sumatra, the test result shows a short run uni-directional relationship moving from electricity consumption (REC per capita) to economic growth (GRDP per capita). This finding suggests that in the short period of time, any attempt to subdue the electricity consumption will have effect on economic growth in Sumatra region. Whilst, the increase of electricity consumption will have a positive implication on the economic growth of Sumatra region. Figures 3 shows a strong concurrent upward trend for both electricity consumption and economic growth per capita. Since 1998 this growth has been consistently staying above the national average level. This trend indicates that this region is economically more resilient than Jawa, Sulawesi, Bali-Nusa Tenggara, and Papua-Maluku. Unlike the other corridors, Sumatra shows a persistent trend of increasing growth of electricity consumption and GRDP per capita even during Asian crisis (1997-1998) and recent global crisis (20082009). Figure 3. REC per capita and GRDP per capita, Sumatra 1984-2010 Sources: Calculated from BPS and PLN (2011) In the case of Kalimantan, the causality tests show a short run uni-directional relationship moving from economic growth (GRDP per capita) to electricity consumption (REC per capita) (Table 8). This finding suggests that an increase of 14
  • 15. economic growth has resulted to an increase of electricity consumption in this region. Figures 4 shows a strong concurrent upward trend for both electricity consumption and economic growth per capita. Since 2001, this growth has been consistently high and staying above the average national level. Recently, the income per capita of Kalimantan corridor has been the highest among all regions in Indonesia. Similar to Sumatra, this trend indicates that this region is economically resilient during the recent global crisis. However, during the Asian Crisis 1997-1998, GRDP per capita along Kalimantan corridor dropped slightly below that of the national level but REC per capita persisted to increase above that of the national level. Figure 4. REC per capita and GRDP per capita, Kalimantan 1984-2010 Sources: Calculated from BPS and PLN (2011) While both Sumatra and Kalimantan regions show that they have short run unidirectional relationship (but in opposite direction), the other 4 regions (Jawa, Sulawesi, Bali - Nusa Tenggara, and Papua–Kepulauan Maluku) do not show any causal relationship between REC and GRDP. Unlike the other 4 other regions, Sumatra and Kalimantan regions also consistently show a strong concurrent upward trend for both electricity consumption and economic growth per capita. The absence of causal relationship is shown in Jawa, Sulawesi, Bali-Nusa Tenggara, and Papua-Kepulauan Maluku. This finding suggests that electricity consumption in these four regions were not correlated with economic growth. It also implies that neither expansive nor conservative policies related to electricity consumption did have any effects on economic growth. The finding shows that no causal relationship between electricity consumption and its regional economic growth is quite surprising, considering that Jawa is the only region that has more electric consumption in industrial sector rather than household sector. Furthermore, this region representing the highest portion of population and GRDP (55.78% and 58.66% respectively). Eventhough Jawa has the bigest portion of GRDP and also the highest consumption of electricity per capita, but the income per capita is significantly lower than Kalimantan. In the contrary to Sumatra and Kalimantan, the trend of Jawa shows that the rate of growth in electricity consumption has started to decline and the rate of economic growth has started to slow down (Figure 5). 15
  • 16. Figure 5. REC per capita and GRDP per capita, Jawa 1984-2010 Sources: Calculated from BPS and PLN (2011) The trends of all 3 other regions, as shown by Figure 6 to 8, indicate that the rate of growth on the electricity consumption has started to decline, while their economic rate of growth significantly lower compared to Kalimantan, Jawa, and Sumatra. These regions can be catagorized as regions with low growth of income and electricity consumption. Figure 6. REC per capita and GRDP per capita, Sulawesi 1984-2010 Sources: Calculated from BPS and PLN (2011) The growth of electric power supply in the regions outside Jawa are mostly allocated to meet the consumption sector, i.e. household sector, rather than industrial or commercial sector. Although the causal relationship did not occur significantly in this corridor, however Jawa is the only corridor which has the portion of electricity consumption of industrial sector (41,27%) higher than household sector (36,61%). Whilst, Sumatera and Kalimantan regions, with the causal relationship are found, show much lower portion electricity consumption of industrial sector (18.94% and 6.90% respectively) than household sector (51.31% and 59.94% respectively) Table 11 (column 2). 16
  • 17. Figure 7. REC per capita and GRDP per capita, Bali-Nusa Tenggara 1984-2010 Sources: Calculated from BPS and PLN (2011) Figure 8. REC per capita and GRDP per capita, Papua-Kepulauan Maluku 1984-2010 Sources: Calculated from BPS and PLN (2011) The electricity consumption in the other three corridors, those are Sulawesi, Bali–Nusa Tenggara, and Papua–Maluku, are also dominated by household sector. As shown in Table 11, the portion of household sector is between 47.83% to 59.94%, while the portion of industrial sector is only between 1,23% to 14,96%. The last supports Kuncoro (2012b)’s finding that those regions are nonindustrial areas with very few large and medium manufacturing industries. The increase of consumption portion of household sector in Sumatra (2009-2011) had been the most significant, followed by Sulawesi, Bali-Nusa Tenggara, Kalimantan, and Papua-Maluku regions. As for Jawa, the consumption portion had decreased during the same time period. 5. CONCLUSIONS Using Granger causality tests and Error Correction Model (ECM), applied to the quantitative data within the period of 1984-2010, our empirical findings shows that: (1) there is uni-directional short run relationship moving from electricity consumption 17
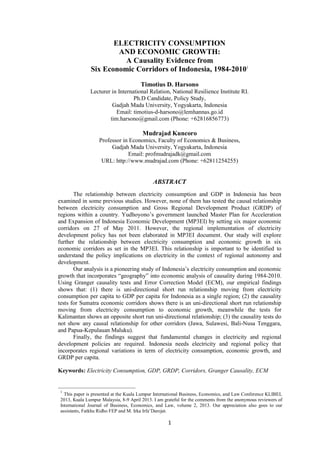
  • 18. per capita to GDP per capita for Indonesia as a single country data set; (2) the causality tests for Sumatera economic corridors shows there is a uni-directional short run relationship moving from electricity consumption to economic growth, meanwhile the test for Kalimantan shows an opposite short run uni-directional relationship; (3) the causality tests do not show any causal relationship for other corridors (Jawa, Sulawesi, Bali-Nusa Tenggara, and Papua-Kepulauan Maluku). Table 11. Electricity Consumption by Household and Industry Sectors in 6 Indonesia’s Economic Corridors (%), 2009-2011 2009 (1) 2011 (3) 51.31 18.94 54.52 18.58 37.30 40.47 36.61 41.27 36.76 41.57 60.25 7.19 59.94 6.90 61.59 6.72 52.46 16.13 53.94 14.96 54.83 14.53 48.01 3.43 47.83 3.24 49.66 3.15 57.95 1.07 Sumatra - Household Sector - Industry Sector Jawa - Household Sector - Industry Sector Kalimantan - Household Sector - Industry Sector Sulawesi - Household Sector - Industry Sector Bali-Nusa Tenggara - Household Sector - Industry Sector Papua-Kep Maluku - Household Sector - Industry Sector 2010 2) 51.25 20.23 Corridors 57.66 1.23 58.97 1.03 Source: PLN (2012) To implement MP3EI succesfully, it requires a thorough understanding of Indonesia’s growth poles and electricity consumptions (and generating power supply) for each economic corridor. Electricity generating capacity growth in Indonesia has lagged behind the pace of electricity demand growth, leading to power shortages and a low electrification ratio. This problem leads to some major challenges to implement MP3EI (Kuncoro, 2013a, 2012a). Our analysis is a pioneering study of Indonesia’s electricity consumption and economic growth that incorporates “geography” into economic analysis of causality during 1984-2010. Before the 1990s, mainstream economics neglected economic geography, meaning the study of where economic activity takes place and why (Kuncoro, 2013b, 2012b). Spatial aspects remained a blind spot for many economists because of their inability to properly model the various aspects of industrial locations (Krugman, 1995: 31-7). Our study sought to inject empirical content to the emerging interest in the causality literature by examining electricity consumption and regional economic growth in the context of Indonesia’s recent regional autonomy. Finally, the finding suggest that fundamental changes in electricity and regional development policies are required. Indonesia needs electricity and regional development policy that incorporate regional variations in term of electricity consumption, economic growth, and GRDP per capita (Figure 10). Using the recent perspectives in the literature of causality, our study demonstrates that Indonesia represents an excellent example of both the uneven geographic distribution of electricity consumption and the relationship between electricity consumption and regional development. 18
  • 19. Figure 10. National Share of GDRP and Regional Electricity Consumption (2010) (% share of total Indonesia) Souce: Compiled from BPS (2011a, 2011c); MEMR (2010b) REFERENCES Altinay, G. & Karagol, E. (2005). Electricity consumption and economic growth: Evidence from Turkey. Energy Economics, Vol. 27, 849-856. Badan Pusat Statistik (BPS). (2011a). Produk Domestik Regional Bruto Atas Dasar Harga Konstan 2000 Menurut Provinsi, 2004-2010 [Regional Gross Domestic Products based on Constant Price 2000 by Provinces, 2004-2010], Retrieved July 25, 2012, from http://www.bps.go.id/tab_sub/view.php?kat=2&Table=1&daftar=1&id_subyek=52&no tab=2. BPS. (2011b). Penduduk Indonesia menurut Provinsi 1971, 1980, 1990, 1995, 2000 and 2010 [Indonesia Population based by Provinces 1971, 1980, 1990, 1995, 2000 and 2010]. Retrieved January 24, 2013, from http://www.bps.go.id/tab_sub/view.php?kat=1& Table=1&daftar=1&id_subyek=12&notab=1. BPS. (2011c). Data Sosial Ekonomi [Economic Social Data], 3 August, Jakarta: BPS. Chen, S. T., Kuo, H. I., & Chen, C. C. (2006). The relationship between GDP and lectricity consumption in 10 Asian countries. Energy Policy, 35, 2611-2621. Church, J. & Ware, R. (2000). Industrial Organization: A strategic Aproach. New York: Irwin McGras-Hill. Coordinating Minister of Economic Affairs (CMEA) (2011). Masterplan for acceleration and expansion of Indonesia economic development 2011 -2025. Jakarta: Coordinating Ministry for Economic Affairs, Republic of Indonesia. Dickey, D.A., & Fuller, W.A. (1991). Likelihood ratio statistics for autoregressive processes. Econometrica, 49, 1057-1072. Engle, R. F., & Granger, C. W. J. (1987). Co-integration and error correction: Representation, estimation and testing. Econometrica, 55, 251–276. Ghosh, S. (2002). Electricity consumption and economic growth in India. Energy Policy, 30, 125-129. Granger, C. W. J. (1969). Investigating causal relation by econometric models and crossspectral methods. Econometrica, 37(3), 424-438. Granger, C. W. J. & Newbold, P. (1974). Spurious regressions in econometrics. Journal of Econometrics, 2, 111-120. 19
  • 20. Gujarati, D. N. (2003). Basic econometrics. 4th edition. New York: McGraw-Hill. Harris, R. (1995). Cointegration analysis ineconometric modelling. New York: Prentice Hall. Krugman, P. (1995). Development, geography, and economic theory. Cambridge and London: The MIT Press. Kuncoro, M. (2010). Satu tahun SBY-nomics [One year Susilo Bambang Yudhono-nomics. Retrieved October 21, 2010, from http://cetak.kompas.com/read/2010/10/21/03040298/ satu.tahun.sby-nomics. Kuncoro, M. (2011a). Koridor Ekonomi Indonesia [Economic Corridors of Indonesia]. Investor Daily, Retrieved February 28, 2011, from http://website.mudrajad.com/ content/koridor-ekonomi-indonesia. Kuncoro, M. (2011b). MP3EI: mitos atau realitas? [MP3EI: a myth or reality?]. Retrieved August 1, 2011, from http://cetak.kompas.com/read/2011/08/01/0415106/mp3ei.mitos. atau.realitas. Kuncoro, M. (2012a). Perencanaan daerah: bagaimana membangun ekonomi lokal, kota, dan kawasan [Regional planning: how to develop local economy, cities and zones]. Jakarta: Salemba Empat. Kuncoro, M. (2012b). Ekonomika aglomerasi: dinamika dan dimensi spasial kluster industri Indonesia [Economics of agglomeration: dynamics and spatial dimension of Indonesia’s industrial clusters]. Yogyakarta: UPP STIM YKPN. Kuncoro, M. (2013a). Economic geography of Indonesia: can MP3EI reduce inter-regional inequality? South East Asian Journal of Contemporary Business, Economics, and Law, 2, forthcoming. Kuncoro, M. (2013b). Economic geography of small and cottage industrial clusters in Java Island Indonesia. Global Advanced Research Journal of Geography and Regional Planning, 2(1), 006-018. Ministry of Energy and Mineral Resources (MEMR). (2009). PLN Targetkan Pemakaian Energi Listrik Terbarukan 10% [PLN targeted a utilization of 10% renewable electric energy]. Retrieved 13 January, 2009, from http://www.esdm.go.id/berita/39-listrik/129pln-targetkan-pemakaian-energi-listrik-terbarukan-10.html. MEMR. (2010a). Pokok-pokok kebijakan energi nasional [Guideline on natioanl energy policy]. Retrieved 1 May, 2011, from http://www.esdm.go.id/news-archives/56artikel/3342-pokok-pokok-kebijakan-energi-nasional.html. MEMR. (2010b). Statistik Listrik [Statistic of Electricity]. Retrieved 10 August 10, 2010, from http://www.esdm.go.id/publikasi/statistik/cat_view/58-publikasi/240-statistik/354statistiklistrik. html. MEMR. (2011a). Handbook of energy & economic statistics of Indonesia. Retrieved 10 August, 2011, from http://www.esdm.go.id/publikasi/handbook.html. MEMR. (2011b). Undang undang nomor 30 Tahun 2009 tentang ketenagalistrikan [Law No. 30 Year 2009 on Electricity], Retrieved September 12, 2011, from http://www.esdm. go.id/regulasi/uu/cat_view/64-regulasi/75-undang-undang/314-tahun-2009.html. Murry, D. A., & Nan, G. D. (1996). A definition of the gross domestic product–electrification interrelationship. The Journal of Energy and Development, 19(2), 275-283. Patterson, Kerry. (2000). An introduction to applied econometrics: a time series approach. New York: McGraw-Hill. Perusahaan Listrik Negara (PLN). (2011). Statistik PLN (1984-2010) [PLN by Statistics (1984-2010)]. Jakarta: PLN Shatland, Ernest, Moore, S., Dashevsky, I., Miroshnik, I., Cain, E., Barton, M.B. (2008). How to be a bayesian in SAS: model selection uncertainty in proc logistic and proc genmod. Boston: Department of Ambulatory Care and Prevention. US-EIA (United States of Energy Information Administration). (2013). Overview of Indonesia. Retrieved February 8, 2013, from http://www.eia.gov/countries/ cab.cfm?fips=ID. Yoo, S. H. (2005). Electricity consumption and economic growth: evidence from Korea. Energy Policy, 33, 1627-1632. 20