Double Side Band – Suppressed Carrier (DSB-SC) Modulation Demodulation using MATLAB SIMULINK model
•
3 recomendaciones•6,726 vistas


Recomendados
Recomendados
Más contenido relacionado
La actualidad más candente
La actualidad más candente (20)
Destacado
Destacado (20)
Similar a Double Side Band – Suppressed Carrier (DSB-SC) Modulation Demodulation using MATLAB SIMULINK model
Similar a Double Side Band – Suppressed Carrier (DSB-SC) Modulation Demodulation using MATLAB SIMULINK model (20)
Más de Akshay Sharma
Más de Akshay Sharma (14)
Último
Último (20)
Double Side Band – Suppressed Carrier (DSB-SC) Modulation Demodulation using MATLAB SIMULINK model
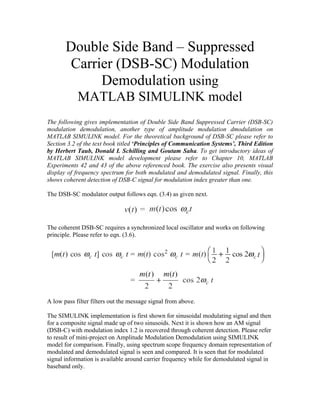
- 1. Double Side Band – Suppressed Carrier (DSB-SC) Modulation Demodulation using MATLAB SIMULINK model The following gives implementation of Double Side Band Suppressed Carrier (DSB-SC) modulation demodulation, another type of amplitude modulation dmodulation on MATLAB SIMULINK model. For the theoretical background of DSB-SC please refer to Section 3.2 of the text book titled ‘Principles of Communication Systems’, Third Edition by Herbert Taub, Donald L Schilling and Goutam Saha. To get introductory ideas of MATLAB SIMULINK model development please refer to Chapter 10, MATLAB Experiments 42 and 43 of the above referenced book. The exercise also presents visual display of frequency spectrum for both modulated and demodulated signal. Finally, this shows coherent detection of DSB-C signal for modulation index greater than one. The DSB-SC modulator output follows eqn. (3.4) as given next. The coherent DSB-SC requires a synchronized local oscillator and works on following principle. Please refer to eqn. (3.6). A low pass filter filters out the message signal from above. The SIMULINK implementation is first shown for sinusoidal modulating signal and then for a composite signal made up of two sinusoids. Next it is shown how an AM signal (DSB-C) with modulation index 1.2 is recovered through coherent detection. Please refer to result of mini-project on Amplitude Modulation Demodulation using SIMULINK model for comparison. Finally, using spectrum scope frequency domain representation of modulated and demodulated signal is seen and compared. It is seen that for modulated signal information is available around carrier frequency while for demodulated signal in baseband only.
- 2. The following shows SIMULINK model preparation and parameterization of local oscillator.
- 3. The following shows time scope output for 10 second simulation, original and expanded time axis.
- 4. The following shows preparation of model for composite signal and its performance.
- 5. The following shows DSB-C coherent detection for modulation index 1.2. Please refer to mini-project on Amplitude Modulation Demodulation for comparison.
- 6. The following shows use of spectrum scope, its parameterization and display. The input of bottom scope is output port of filter block which is renamed. Else this by default shows ‘Ch1’ as legend. The modulating signal frequency is made 3000Hz for better visualization.
- 7. Note that the range 0.5 MHz in frequency axis refers to Fs/2 = 100000/2 = 50000 Hz.