Utilizing Unsymmetrical Indirect Covariance Processing to Define 15N-13C Connectivity Networks

There has been considerable interest over the past decade in the utilization of direct and long-range 1H-15N heteronuclear shift correlation methods at natural abundance to facilitate the elucidation of small molecule structures. Recently, there has also been a high level of interest in the exploration of indirect covariance NMR methods. Our initial explorations in this area led to the development of unsymmetrical indirect covariance methods, which allow the calculation of hyphenated 2D NMR spectra such as 2D GHSQC-COSY and GHSQC-NOESY from the discrete component 2D NMR experiments. We now wish to report the utilization of unsymmetrical indirect covariance NMR methods for the combination of 1H-13C GHSQC and 1H-15N long-range (GHMBC, IMPEACH-MBC, CIGAR-HMBC, etc.) heteronuclear chemical shift correlation spectra to determine 15N-13C correlation pathways.

Recomendados
Recomendados
Más contenido relacionado
Similar a Utilizing Unsymmetrical Indirect Covariance Processing to Define 15N-13C Connectivity Networks
Similar a Utilizing Unsymmetrical Indirect Covariance Processing to Define 15N-13C Connectivity Networks (20)
Último
Último (20)
Utilizing Unsymmetrical Indirect Covariance Processing to Define 15N-13C Connectivity Networks
- 1. Utilizing Unsymmetrical Indirect Covariance Processing to Define 15N-13C Connectivity Networks Gary E. Martin,* Patrick A. Irish, and Bruce D. Hilton Schering-Plough Research Institute Rapid Structure Characterization Laboratory Pharmaceutical Sciences Summit, NJ 07901 Kirill A. Blinov Advanced Chemistry Development Moscow Department Moscow 117513 Russian Federation Antony J. Williams Advanced Chemistry Development Toronto, Ontario Canada 15 Running title: N-13C Unsymmetrical Indirect Covariance NMR Keywords: unsymmetrical indirect covariance NMR, 1H-13C GHSQC, 1H-15N GHMBC, IMPEACH-MBC, CIGAR-HMBC, 15N-13C connectivity
- 2. Abstract: There has been considerable interest over the past decade in the utilization of direct and long-range 1H-15N heteronuclear shift correlation methods at natural abundance to facilitate the elucidation of small molecule structures. Recently, there has also been a high level of interest in the exploration of indirect covariance NMR methods. Our initial explorations in this area led to the development of unsymmetrical indirect covariance methods, which allow the calculation of hyphenated 2D NMR spectra such as 2D GHSQC-COSY and GHSQC-NOESY from the discrete component 2D NMR experiments. We now wish to report the utilization of unsymmetrical indirect covariance NMR methods for the combination of 1H-13C GHSQC and 1H-15N long-range (GHMBC, IMPEACH-MBC, CIGAR-HMBC, etc.) heteronuclear chemical shift correlation spectra to determine 15N-13C correlation pathways. 2
- 3. 1 Numerous studies utilizing H-15N heteronuclear chemical shift correlation experiments have been reported over the past decade and are the subject of several recent reviews.1-5 Underscoring the high level of interest and growing importance of being able to access 1H-15N long-range heteronuclear shift correlation data, there have been two recent reports6,7 describing pulse sequences that allow the simultaneous acquisition of long-range 1H-13C and 1H-15N HMBC data. The ability to exploit 1H-15N connectivities is an important adjunct to small molecule structure elucidation, particularly for pharmaceuticals and alkaloids. Considerable recent attention has also been focused on the development of covariance NMR methods, initially by Brüschweiler and co- workers.8-13 Insofar as potential for small molecule application, the most interesting report described the capability of extracting carbon-carbon connectivity information from a GHSQC-TOCSY spectrum using indirect covariance methods. Brüschweiler and Zhang commented that proton resonance overlap could lead to artifacts in the calculated carbon-carbon spectra but did not explore this observation. 11 We subsequently reported the analysis of two types of artifacts observed in inverted direct response (IDR) GHSQC- TOCSY spectra with overlapped proton resonance, which, in turn, prompted us to explore the elimination of these artifacts via a method that we have named unsymmetrical indirect covariance.14 Subsequent work has shown that it is also possible to mathematically combine various discretely acquired 2D NMR spectra. The first effort in this direction demonstrated the combination of 1H-13C GHSQC and GHMBC spectra to afford the equivalent of an m,n-ADEQUATE spectrum.15 Subsequent studies have demonstrated the calculation of GHSQC-COSY16 and GHSQC-NOESY17 spectra from discretely acquired COSY, NOESY, and 1H-13C GHSQC 2D NMR spectra. Recently, 3
- 4. Kupče and Freeman7 have demonstrated the use of projection reconstruction techniques 15 to establish N-13C correlations at natural abundance, using vitamin B-12 as a model compound for the study, also noting in parallel that indirect covariance methods can be used to obtain homonuclear correlation spectra indirectly. Thus, we would now like to demonstrate specifically, that unsymmetrical indirect covariance NMR methods can 15 indeed be used to derive N-13C connectivity information from discretely acquired 1H- 13 C GHSQC and 1H-15N HMBC spectra. 1 For the present study, multiplicity-edited H-13C GHSQCAD and 1 H-15N GHMBC spectra were acquired using an ~5 mg sample of strychnine (1) dissolved in ~180 μL CDCl3 in a 3 mm NMR tube. The spectra were recorded at 500 MHz using a Varian two channel spectrometer equipped with a 3 mm gradient inverse triple resonance probe. The 1H-13C GHSQCAD spectrum was recorded in 36 m while the 1H-15N GHMBC spectrum was recorded in 3 h 6 m. The spectra were acquired with identical proton spectral widths and the data were processed to yield data matrices that were identically digitized with F1,F2 dimensions of 512 x 2048 points. The unsymmetrical indirect covariance matrix can be calculated by C = RN * RCT [1] where RN and RC correspond to the real data matrices from the long-range 1H-15N GHMBC and 1H-13C multiplicity-edited GHSQCAD spectra, respectively. In the present report, the GHSQCAD data are plotted with CH and CH3 resonances with positive phase and CH2 resonances with negative phase. The 1H-13C data matrix is transposed to RCT 4
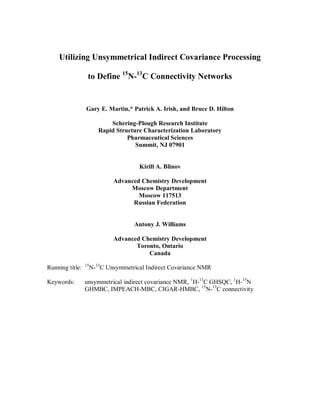
- 5. during processing. The data were acquired and processed so that there were equal numbers of columns in the data sets, i.e. RN is N * M1 and RC is N * M2 to allow the multiplication of the data matrices. In the present example, F2 spectral widths were identical although that is not an absolute requirement. By definition, the following formula is used to calculate each element Cij (i and j are row indices in the initial matrices, correspondingly, RN and RC) of data matrix C: Cij = (RN)ij * (RC)ij = (RN)i1 * (RC)j1 + (RN)i2 * (RC)j2 + (RN)ik * (RC)jk + (RN)iN * (RC)jN [2] Each element of matrix C is the sum of products of values (RN)ik and (RC)jk. A necessary condition is to have non-zero elements in equivalent positions in the rows of (RN)i and (RC)j. For two “ideal” 2D NMR spectra, assuming zero noise in the data matrices, the sum of a matrix element will be non-zero when rows (RN)i and (RC)j have crosspeaks in the same position. The resulting GHSQCAD and GHMBC data sets were subjected to 15 unsymmetrical indirect covariance processing to yield the N-13C long-range correlation spectrum shown in Figure 1. The 1H-15N HMBC spectrum is shown in the top left panel; the 1H-13C GHSQCAD spectrum is shown in the bottom right panel and has been 13 15 transposed to reflect the orientation of the C spectrum as the F2 axis in the N-13C 15 correlation spectrum shown in the top right panel. In the N-13C correlation spectrum, 15 13 N Chemical shift information is displayed in the F1 frequency domain while C 15 chemical shift information is presented in the F2 frequency domain. N-13C correlation responses in the spectrum shown in Figure 1 are “modulated” via the nJNH correlation 5
- 6. response in the 1H-15N HMBC spectrum, the 13 C chemical shift information deriving from the chemical shift of the carbon directly bound to the proton in question in the 1H- 13 C GHSQCAD spectrum. 39.6 18 N 20 19 17 16 7 15 8 14 21 N 13 22 155.2 9 10 12 23 O 11 O 1 15 N-13C long-range heteronuclear correlations observed in Figure 1 are shown on 15 the structure above. Correlations plotted using red contours in the N-13C correlation spectrum shown in Figure 1 arise from correlations between methylene carbons and the nitrogen; correlations plotted in black arise from correlations from methine (or methyl, although there are no methyl resonances in the structure of strychnine) carbons to nitrogen. The phase of the 13C resonance from the multiplicity-editing of responses in the 15 GHSQCAD spectrum is carried forward into the N-13C unsymmetrical indirect covariance processed spectrum shown in the top right panel in Figure 1. Presumably, 13 methine and methylene carbons with the same C chemical shift that correlate to the same nitrogen could partially or completely cancel, hence it may useful to consider the acquisition of both conventional and multiplicity-edited 1H-13C GHSQCAD spectra when 6
- 7. the data are acquired since these data can be accumulated in a very reasonable periods of time. An interesting corollary arises in the case of overlapped protons, one of which is 15 long-range correlated to a nitrogen resonance. By calculating the N-13C correlation spectrum, as shown in Figure 1, the specific proton (via the 1H/13C response in the 15 15 GHSQC spectrum) correlating to the N resonance can be determined by the N-13C correlation response. 15 In conclusion, N-13C heteronuclear chemical shift correlation spectra can be derived through the unsymmetrical indirect covariance processing of 1H-13C GHSQCAD and 1H-15N long-range heteronuclear chemical shift correlation spectra ( 1H-15N HMBC in the present example, but we have obtained the same results with 1H-15N IMPEACH- MBC18 and 1 H-15N CIGAR-HMBC19 experiments). The utilization of 15 N-13C heteronuclear chemical shift connectivity information may prove useful in the structural characterization of pharmaceuticals (>80% contain nitrogen in their structures) and alkaloids as well as in the characterization of other nitrogenous compounds. These data may also allow investigators to differentiate between overlapped protons, one of which is 15 long-range coupled to N, provided that the carbons directly bound to the overlapped protons are resolved. Generally, it is highly unlikely that both the proton and carbon resonances for two sites in a molecule will have identical 1H and 13C chemical shifts. It will be quite interesting to see what other applications for 15N-13C heteronuclear chemical shift correlation data will arise. In a parallel vein, it will be equally interesting to see what other types of data can be beneficially co-processed using unsymmetrical indirect covariance NMR methods. These investigations are presently underway in our laboratories and will form the basis of forthcoming reports. 7
- 8. References: 1. G. E. Martin and C. E. Hadden, J. Nat. Prod., 65, 543 (2000). 2. R. Marek and A. Lycka, Curr. Org. Chem., 6, 35 (2002). 3. G. E. Martin and A. J. Williams, “Long-Range 1H-15N 2D NMR Methods,” in Ann. Rep. NMR Spectrosc., vol. 55, G. A. Webb, Ed., Elsevier, Amsterdam, 200, pp. 1-119. 4. P. Forgo, J. Homann, G. Dombi, and L. Máthé, “Advanced Multidimensional NMR Experiments as Tools for Structure Determination of Amaryllidaceae Alkaloids,” in Poisonous Plants and Related Toxins, T. Acamovic, S. Steward and T. W. Pennycott, Eds., Wallingford, UK, 2004, pp. 322-328. 5. G. E. Martin, M. Solntseva, and A. J. Williams, “Applications of 15N NMR in Alkaloid Chemistry,” in Modern Alkaloids, E. Fattorusso and O. Taglialatela- Scafati, Eds., Wiley-VCH, 2007, in press. 6. M. Pérez-Trujillo, P. Nolis, and T. Parella, Org. Lett., 9, 29 (2007). 7. E. Kupče and R. Freeman, Magn. Reson. Chem., 45, 103 (2007). 8. R. Brüschweiler and F. Zhang, J. Chem. Phys., 120, 5253 (2004) 9. R. Brüschweiler, J. Chem. Phys., 121, 409 (2004). 10. F. Zhang and R. Brüschweiler, Chem. Phys. Chem., 5, 794 (2004). 11. F. Zhang, and R. Brüschweiler, J. Am. Chem. Soc., 126, 13180 (2004). 12. N. Trbovic, S. Smirnov, F. Zhang, and R. Brüschweiler, J. Magn Reson., 171, 177 (2004). 13. Y. Chen, F. Zhang, W. Bermel, and R. Brüschweiler, J. Am. Chem. Soc., 126, 15564 (2006). 8
- 9. 14. K. A. Blinov, N. I. Larin, M. P. Kvasha, A. Moser, A. J. Williams, and G. E. Martin, Magn. Reson. Chem., 43, 999 (2005). 15. K. A. Blinov, N. I. Larin, A. J. Williams, M. Zell, and G. E. Martin, Magn. Reson. Chem., 44, 107 (2006). 16. K. A. Blinov, N. I. Larin, A. J. Williams, K. A. Mills, and G. E. Martin, J. Heterocyclic Chem., 43, 163 (2006). 17. K. A. Blinov, A. J. Williams, B. D. Hilton, P. A. Irish, and G. E. Martin, Magn. Reson. Chem., 45, in press (2007). 18. C. E. Hadden, G. E. Martin, and V. V. Krishnamurthy, J. Magn. Reson., 140, 274 (1999); G. E. Martin and C. E. Hadden, Magn. Reson. Chem., 38, 251 (2000). 19. C. E. Hadden, G. E. Martin, and V. V. Krishnamurthy, Magn. Reson. Chem., 38, 143 (2000). 9
- 10. 15 N-13C unsymm. indirect covariance 40 N19 40 C16 C18 C20 C17 C14 C15 60 60 F1 Chemical Shift (ppm) F1 Chemical Shift (ppm) 80 80 15 100 100 N 120 120 140 C8 C13 C11 140 N9 4.0 3.5 3.0 2.5 2.0 1.5 1.0 65 60 55 50 45 40 35 30 25 20 F2 Chemical Shif t (ppm) F2 Chemical Shif t (ppm) 1 13 H-15N GHMBC C 1.5 F2 Chemical Shift (ppm) 2.0 multiplicity-edited 2.5 1 H-13C GHSQC 3.0 3.5 4.0 65 60 55 50 45 40 35 30 25 20 F1 Chemical Shif t (ppm)
- 11. 15 Figure 1. N-13C (F1,F2) Heteronuclear chemical shift correlation spectrum (upper right panel) derived by the unsymmetrical indirect covariance processing of discretely acquired, multiplicity-edited 1H-13C GHSQCAD (bottom right panel, transposed to reflect the orientation of the 13C chemical shift axis in the final 15N-13C correlation spectrum CH/CH3 resonances are plotted in black and have positive phase, CH2 resonances are inverted and plotted in red) and the 1H- 15 N GHMBC spectrum (top left panel). The data were recorded at 500 MHz using an ~5 mg sample of strychnine in 180 μL CDCl3. Total data acquisition time for the two 2D spectra was < 4 h. The individual 2D NMR spectra were processed to yield a pair of spectra comprised of 512 x 2048 points that were the subjected to unsymmetrical indirect covariance processing. Processing time was approximately 4 sec. The N9 and N19 resonances of strychnine (1) are observed at 155.2 and 39.6 ppm, respectively. Correlations are observed, as expected, between the C8, C11, and C13 resonances and the N9 amide nitrogen resonance. Correlations are observed from the C14, C15, C16, C17, C18, and C20 resonances to the N19 aliphatic nitrogen resonance. There is no way to differentiate between the overlapped C8 and C16 resonances in the 15N-13C correlation spectrum, although the H8 and H16 resonances are resolved in the 500 MHz 1H-15N GHMBC spectrum, allowing an unequivocal assignment to be made. 11