Recomendados

Recomendados
Más contenido relacionado
La actualidad más candente
La actualidad más candente (19)
Destacado
Destacado (14)
Similar a Barret Wellemeyer Governor's conference poster
Similar a Barret Wellemeyer Governor's conference poster (20)
Barret Wellemeyer Governor's conference poster
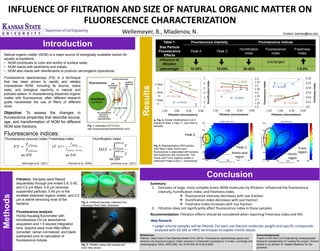
- 1. Fluorescence (source) index ex 370 ((McKnight et al., 2001) Freshness index ex 310 ((Parlanti et al., 2000) Humification index ex 254 ((Zsholnay et al., 2001) Table 1. Fluorescence Intensity Fluorescence Indices Size Particle Fluorescence Effects Peak A Peak C Humification Index Fluorescence Index Freshness Index Influence of filtration Unchanged percentage 10-20% 15-25% 20-40% 1.5-3% INFLUENCE OF FILTRATION AND SIZE OF NATURAL ORGANIC MATTER ON FLUORESCENCE CHARACTERIZATION Wellemeyer, B., Mladenov, N. References: Fellman, Jason Hood, Eran Spencer,Robert G.M. (2010). Fluorescence spectroscopy opens new windows into dissolved organic matter dynamics in freshwater ecosystems: A review. Limnology and Oceanography, 55(6), 2452-2462. doi:10.4319/lo.2010.55.6.2452 Natural organic matter (NOM) is a major source of biologically available carbon for aquatic ecosystems. • NOM contributes to color and acidity of surface water, • NOM reacts with sediments and metals, • NOM also reacts with disinfectants to produce carcinogenic byproducts. Results Methods Summary: 1. Exclusion of large, more complex humic NOM molecules by filtration influenced the fluorescence intensity, humification index, and freshness index. Fluorescence intensity decreases with size fraction Humification index decreases with size fraction Freshness index increases with size fraction 2. Filtration does not significantly affect fluorescence index in these samples Recommendation: Filtration effects should be considered when reporting Freshness index and HIX. Fig. 1. Illustration of FS from http://scienceprojectideasforkids.com/ Acknowledgments: Thanks to the KSU Civil Engineering Undergraduate Research Assistantship for funding this project. Sincere thanks to my advisor Dr. Natalie Mladenov for her guidance. gFig. 5. Representative EEM spectra from New 3 sites. Amino acid fluorescence is associated with tyrosine and tryptophan-like compounds. The Humic and Fulvic regions contain 2 distinctive Peaks A and C, respectively. Contact: barretw@ksu.edu Amino acid region Humic region ▲Fig. 3. Filtration vs various indices Introduction Conclusion Way forward: • Larger volume samples will be filtered. For each size fraction molecular weight and specific compounds analyzed with GC-MS or HPLC techniques to explain trends above. R² = 0.7344 R² = 0.8598 R² = 0.2255 0.5 0.51 0.52 0.53 0.54 0.55 0.56 0.000.501.001.50 FreshnessIndex Filtration (micrometers) R² = 0.3331 R² = 0.6098 R² = 0.5831 1.2 1.25 1.3 1.35 1.4 1.45 1.5 1.55 1.6 0.000.501.001.50 FluorescenceIndex Filtration (micrometers) R² = 0.1744 R² = 0.8681 R² = 0.9219 1 2 3 4 5 6 7 0.000.501.001.50 HumificationIndex Filtration (micrometers) New 3 New 11 Palm 4 Fluorescence spectroscopy (FS) is a technique that has been shown to rapidly and reliably characterize NOM, including its source, redox state, and biological reactivity in natural and polluted waters. In characterizing dissolved organic matter with fluorescence, often different research goals necessitate the use of filters of different sizes. Objective: To assess the changes in fluorescence properties that describe source, age, and transformation of NOM for different NOM size fractions. Fluorescence indices: nm nm I I FI 520 470 Filtration. Samples were filtered sequentially through pre-rinsed 0.8, 0.45, and 0.2 μm filters. 0.8 μm removes suspended particles, 0.45 μm is the smallest dissolved organic matter, and 0.2 μm is sterile removing most of the bacteria. Fluorescence analysis. Horiba Aqualog fluorometer with simultaneous UV-vis absorbance acquisition and 1.5 second integration time. Spectra were inner-filter effect corrected, raman normalized, and blank subtracted prior to calculation of fluorescence indices. )435420( 380 ):( nmnm nm I I nm nm nm nm I I HIX 445 300 480 435 Fig. 2. Unfiltered samples collected from Okavango River Delta, Botswana Fig. 3. Filtration setup with syringe and nylon filter shown ▲ Fig. 4. Similar relationships in all 3 indices for New 3, New 11, and Palm 4 samples. Peak C Peak A Fulvic region