Más contenido relacionado
La actualidad más candente (20)
Similar a Exequor White Paper - Stressing Over Stress Testing (20)
Exequor White Paper - Stressing Over Stress Testing
- 1. © 2015 The Exequor Group LLC
Stressing Over Stress Testing:
Introduction to the Components
This paper discusses the major components of a macroeconomic-based
stress testing process and describes some of the challenges with which
banks are contending in their efforts to comply with regulatory
requirements. The paper covers the foundational components of
economic scenarios and cash flow models and then introduces new
business, capital consumption, other (non-credit) risks, income and
expense models and finishes with a discussion of capital ratios, capital
planning, quantitative information and qualitative considerations.
BY DAVID GREEN, PHD, CFA AND JAMES HAUGHT, CFA
Stress testing has long played an important role in bank risk management, with some
form having been used in the analysis of credit, liquidity and market risk exposures
for many years. Given this, you might wonder why compliance with more recent
regulatory requirements for capital stress testing has proven so challenging and why
so many banks continue to receive
adverse findings.1 This paper describes
the major components of the stress
testing process and highlights some of
the challenges associated with building
and managing not only a regulatory
compliant process but one that is also
useful to the management of risk and
capital within the bank.
Before diving into the components of
the stress testing process, it is helpful
to understand the origins of the new
requirements and how they differ from
earlier business practices.
Why: The global financial crisis that began in 2007 revealed numerous shortcomings
in bank risk management practices; in particular, banks and their regulators did not
appreciate how the risk exposures of banks are interrelated. From 2006-12, national
housing prices fell 27%2, from 2007-9, the unemployment rate increased from 4.4%
1 These include public restrictions for CCAR banks and non-public requests for remediation, such as
matters requiring attention (MRA) and matters requiring immediate attention (MRIA).
2 Source: S&P/Case-Schiller, US National Home Price Index. Prices in some markets fell significantly
more than the average, e.g. 62% in Las Vegas, 56% in Phoenix and 51% in Miami.
The financial crisis exposed a number
of critical weaknesses across the
largest banks and highlighted that
many BHCs had a limited ability to
effectively identify, measure, and
control their risks, and to assess their
capital needs.
CCAR Review 2015, March 2015, Board
of Governors, Federal Reserve
- 2. 2 © 2015 The Exequor Group, LLC
to 10.0%3 and key funding markets shut down4. As a result of these and other
dislocations, between 2007 and 2014, 510 depository institutions closed or merged
with other banks5 and government intervention was taken on an unprecedented
scale.6
How: In 2010, Congress passed The Dodd-Frank Wall Street Reform and Consumer
Protection Act (DFA), which required, among other things, that bank regulators
address shortcomings with respect to capital management in order to mitigate the
need for costly government support in future downturns. In particular, the legislation
mandated that the Federal Reserve Bank (FRB) establish specific requirements for
comprehensive balance sheet stress testing. Stress testing would be used to assist
regulators with answering the seemingly simple question: Do banks have enough
capital to survive an economic downturn? If, in reviewing the results from the stress
testing exercise, regulators conclude that a particular institution does not have
sufficient capital, that firm will be required to bolster its capital levels immediately or
modify its future business plans accordingly.
While the question of capital adequacy appears simple, the process for producing a
well-substantiated answer is actually quite complicated. Attempts to do so have
revealed that traditionally disaggregated approaches to risk management are often
inadequate for analyzing overall risk in relation to capital. Compliance with the stress
testing requirements of the Comprehensive Capital Analysis and Review (CCAR)7 and
3 Source: Bureau of Labor Statistics, unemployment rate, LNS14000000.
4 Source: When Safe Proved Risky: Commercial Paper during the Financial Crisis of 2007-9, Journal
of Economic Perspectives, Winter 2010 and GE Press Releases in late 2008. As investors were
withdrawing deposits from money market mutual funds and fund managers were shifting their asset
mixes more heavily toward US Treasuries, commercial paper issuers found that there were few
buyers for their paper. In November 2008, GE Capital had difficulty rolling $88 billion of such debt
(except on an overnight basis) and turned to the Fed for assistance. The Fed had created the
Commercial Paper Funding Facility (CPFF), but the Fed’s assistance was only made possible by the
FDIC’s creation of the Temporary Liquidity Guarantee Program (TLGP) which modified the definition
of institutions which were eligible to issue debt with a guarantee from the US government. By
January 2009, the Fed was the single largest holder of commercial paper, owning over 22% of all
outstanding paper.
5 Source: FDIC. This count does not include banks or investments banks that were merged without
technically failing, e.g. Bear Stearns and Wachovia, or additional assistance programs which were
provided to Bank of America and Citibank in order to prevent their failure.
6 Source: GAO, Government Support for Bank Holding Companies and FDIC. The US Treasury was
authorized to invest $700 billion of capital directly into banks and non-banks (TARP), the FDIC
temporarily extended an unlimited deposit guarantee on non-interest bearing transaction accounts,
absorbed losses of $78 billion on failed banks with combined assets of $ 692 billion and created a
funding program for non-banks (TGIF) and the Federal Reserve auctioned $493 billion of 1 and 3-
month discount window loans, took the overnight funding rate to essentially zero percent and
bought roughly $ 3.5 trillion of government and agency debt (QE I, II and III).
7 Applicable to bank holding companies (BHCs) with total assets over $50 billion.
- 3. 3 © 2015 The Exequor Group, LLC
DFA stress testing8 have forced institutions to realize that, because risk exposures are
not additive, the proper evolution of cash flows, earnings and the level of capital
requires the simultaneous analysis of all relevant risk factors. Regulators ultimately
expect banks to resolve this fundamental issue as well as a long list of other challenges
in order to prove that their representations on capital adequacy can be relied upon.
On top of this, with each new round of regulatory stress testing, regulatory
requirements continue to evolve and the bar of expectations continues to rise.
Economic Scenarios
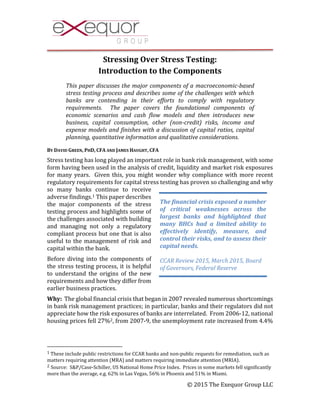
The starting point for
CCAR and DFA stress
testing simulations is a set
of economic scenarios
produced by the FRB; the
set consists of Baseline,
Adverse and Severely
Adverse scenarios. Banks
use the scenarios to
produce estimates of
capital use and capital
supply in order to
calculate capital ratios
throughout each
scenario.9 The FRB provides an extensive historical time series as well as a 13-
quarter forecast for 16 domestic and 12 international variables.10
While the FRB’s specification of the scenarios provides a useful starting point for
forecasting, accurate forecasts require several extensions of the data set:
1) Additional macroeconomic variables which have important explanatory
power for the performance of a bank’s unique lending and investing activities,
e.g. oil prices and farmland prices
2) Expansion of the national variables down to local drivers of default and loss,
e.g. state-level unemployment and zip code level home price indexes (HPI)
3) Extension of the forecast horizon beyond 13 quarters as necessary to meet the
modeling requirements for Other Than Temporary Impairment (OTTI), e.g.
8 Our term for the more limited test that is applicable to BHCs with total assets between $10 billion
and $50 billion.
9 Minimum capital levels are specified for several metrics: Tier 1 Common, Common Equity Tier 1,
Tier 1 Risk-Based Capital, Total Risk-Based Capital and Tier 1 Leverage. Minimums have also been
separately specified for Advanced Approach BHCs versus other BHCs and are being phased in
through 2019. See www.federalreserve.gov/newsevents/press/bcreg/bcreg20150311a1.pdf.
10 Complete histories are provided for each variable back to 1999; additional history is provided for
a subset of the variables as far back as 1976.
-10.0
-8.0
-6.0
-4.0
-2.0
0.0
2.0
4.0
6.0
8.0
Q12001
Q32001
Q12002
Q32002
Q12003
Q32003
Q12004
Q32004
Q12005
Q32005
Q12006
Q32006
Q12007
Q32007
Q12008
Q32008
Q12009
Q32009
Q12010
Q32010
Q12011
Q32011
Q12012
Q32012
Q12013
Q32013
Q12014
Q32014
Q12015
Q32015
Q12016
Q32016
Q12017
Q32017
Real GDP Growth (%)
Actual Baseline Adverse Severely Adverse
Source: Board of Governors of the Federal Reserve System
- 4. 4 © 2015 The Exequor Group, LLC
rates and other macroeconomic parameters through the maturity term of the
securities
In addition to the FRB’s specification of the scenarios and the extensions described
above, there is an expectation (and for larger banks a requirement) that banks will
supplement the scenarios in a way that acknowledges idiosyncratic risks, especially
as they relate to liquidity risk; for example, a bank with a heavy reliance on wholesale
funding should consider loss of access to certain wholesale markets, e.g. repo, CP or
FHLB market shutdown. This analysis can be included with the bank’s formal
submission or made available for subsequent regulatory review. If the bank is solving
for a post stress capital measure that aligns with the CCAR measure, the specification
of the event should reside in a similar probability space as the FRB’s Severely Adverse
scenario.
Cash Flow Models
The assessment of realized losses and
position size over the forecast horizon
derives from the evolution of scenario-
specific, transaction-level cash flows for
each balance sheet item. The
measurement of cash flows must include
an estimate of contractual, voluntary and
involuntary (credit loss) payments.
When combined with Risk-Weighted
Asset (RWA) levels, income changes and
mark-to-market levels, the bank is able
to forecast required capital ratios.
Challenging this process at most banks,
separate and distinct functional areas
manage credit and market risk. 11
Despite the fact that these risks are interrelated in the majority of circumstances, this
segmented approach to risk management persists to this day and is evidenced by
attempts to add the impact of market and credit risk exposures when determining
product cash flows in stress testing exercises. Unfortunately, this will not produce
cash flow dynamics that reflect real world behavior, particularly in scenarios where
credit conditions are expected to influence customer behaviors. 12 A class of
behavioral models, known as competing risk models, are best suited for the correct
evolution of transaction cash flows, because these models consider, in each period of
a simulation, the simultaneous impact of relevant cash flow drivers. For example,
11 Our use of the term market risk refers to the measurement of banking book position responses to
changes in market and administered interest rates; this risk is typically managed by ALCO.
12 The FRB’s severely adverse scenario reflects a combination of falling interest rates and worsening
credit conditions and presents exactly the conditions for which credit and market risk measures are
not additive.
15) How were PDs on residential
mortgages estimated? What were the
key risk drivers?
Broadly speaking, the PDs were
estimated within a “competing risk”
model framework where default and
prepayment probabilities were
simultaneously estimated.
Frequently Asked Questions, Supervisory
Methodologies in CCAR 2012, Board of
Governors, Federal Reserve
- 5. 5 © 2015 The Exequor Group, LLC
these models will incorporate market risk factors, such as current interest rates on
comparable products (in order to explain voluntary prepayment behavior) as well as
credit risk factors, such as loan-to-value (LTV) (in order to explain not only default
and loss experience but also a potentially significant impediment to refinancing). By
considering these factors jointly, competing risk models are able to acknowledge that
the credit factors may serve to constrain the realization of voluntary prepayments
that would otherwise be expected if one is focused solely on interest rates.
The requirement for
competing risk models is
evident when we analyze
the reason for the failure
of loan prepayment
models that were
employed before and
during the recent financial
crisis. In 2007-8,
mortgage prepayment
models predicted that
voluntary prepayment
rates would increase
dramatically because of the substantial decline in market interest rates. These model
predictions proved incorrect because housing prices were in decline at the same as
rates were falling. Homeowners found that their LTVs exceeded underwriting limits
at most banks; as a result, they were unable to refinance their loans notwithstanding
the cost savings associated with refinancing.
In this case, when analyzing capital adequacy in a deteriorating economic
environment, prepayment models that overstate prepayment rates will understate
credit exposure and capital risk. The borrowers that are unable to exercise
prepayment options in an adverse credit scenario are the borrowers that consume
the most capital (whether through future realized losses or additional RWA
consumption), thus leading to incorrect conclusions about the sufficiency of capital.
Because stress testing specifically requires the consideration of comprehensively-
specified economic scenarios, cash flow models must incorporate all relevant factors
that explain the evolution of cash flows.
Further complicating matters, individual behavioral models are required for each
balance sheet product, because cash flows are governed not only by contractual rules,
but also by voluntary and involuntary prepayment (or credit default and recovery)
options, the structure of which varies from product to product and across collateral
structures. The first step in building a competing risk cash flow model should involve
identification of the relevant drivers of cash flow dynamics. Each model must be
calibrated to the performance experience of the product. This process requires the
use of numerous data fields, examples of which are in Table 1. (This list is not
Source: Government Loan Solutions CPR Report
- 6. 6 © 2015 The Exequor Group, LLC
complete, and for certain types of loans, certain of the fields may not be relevant.)
After the model is constructed, effective model risk management13 requires periodic
back-testing and recalibration of model factors.
The availability of sufficient internal loan data has
proven problematic for most banks across their entire
suite of products. Retention of loan-level performance
histories is only a recent development and at some
banks these histories often do not capture the most
recent credit cycle; alternatively, even when sufficient
data has been retained, it may fail to include an
adequate breadth of performance attributes. Just as
importantly, even if there is a decade of data available,
this only captures the most recent business cycle; for
some institutions, their most important risks may not
be reflected in this data history14.
For these reasons, many banks must utilize external
data sets to calibrate their behavioral models. Initially,
regulators were insistent that banks use only their own
data for this purpose, but they have since
acknowledged the benefits of using more
comprehensive data sets, provided that the bank has
demonstrated that the augmented data is appropriate
to the business and risk profile of the organization’s
existing exposures.
For securities, the following facts further complicate
the cash flow modeling exercise:
1) While the availability of loan performance data
is generally limited only by the ability of banks
to capture and retain the necessary data fields,
for securities, most banks are reliant on
external parties to provide complete and
accurate time series data necessary for
modeling and analysis.
2) Most investment products have a waterfall structure which governs the
evolution of cash flows to the investor. It is first necessary to model the
performance of the underlying collateral, e.g. amortization, voluntary and
involuntary cash flows on individual loans within the structure, in a manner
13 See OCC 2011-12 or SR 11-7 Model Risk Management for the regulatory requirements around
effective model governance including model validation.
14 This issue is exacerbated by changes in the business environment, where earlier credit or rate
cycles may be less relevant (or worse) to the estimation of future behaviors.
Loan Type
Origination Date
Maturity Date
Original Balance
Current Balance
Current Interest Rate
Fixed/Floating
Repricing Rate Index
Repricing Rate Spread
Prepayment Option Flag
Prepayment Option Type
Original Collateral Value
Current Collateral Value
Original FICO Score
Current FICO Score
Guarantor
ZIP Code
Current Delinquency Status
Vehicle Type
Vehicle Age
Borrower Age
Borrower Gender
Borrower Income
Table 1 - Sample loan fields
- 7. 7 © 2015 The Exequor Group, LLC
that is consistent with the specified scenario. These transaction-level cash
flows must then be passed through the waterfall structure of the security in
order to accurately generate the cash flows which will be realized over the
forecast horizon.
3) Loan level cash flows on whole loans and those in structured securities are
usually evolved in separate models because of the first two points. Regardless
of whether they are in whole loan form or collateral in structured products, a
bank should be able to demonstrate consistency in the evolution of loan level
cash flows.
The first two points described above have led most banks to rely on third parties, such
as broker/dealers and investment banks, to produce requisite securities cash flows.
With regard to such reliance, regulators are demanding an increase in the level of
transparency around the modeling process; banks can no longer use a “black box”.
Despite regulatory demands, some third parties have refused to provide the
necessary transparency as they utilize these proprietary models in related asset
management businesses. This has left many banks searching for alternatives or
attempting to develop bespoke cash flow solutions.
New Business and Reinvestment of Cash Flows
Balance sheet stress testing requires the estimation of volumes, risk, income and
expenses over a multi-period horizon. The need to simulate earnings in addition to
balances requires detailed assumptions around the evolution of new business and
reinvestment of runoff cash flows. All of the same requirements for modeling the cash
flow dynamics of the existing balance sheet apply to the new balances coming onto
the balance sheet. In addition, new business assumptions should have some
econometric justification which should be evolved in response to explicit business
strategies.
In the same way that well-built behavioral models impose extensive data
requirements on current positions, all new business will need to include the same
level of specificity as these positions should be evolved using the same cash flow
models used to run off the current position balances. ALM modelers will already be
familiar with the need to make explicit assumptions for new business volumes
coming onto the balance sheet in each period, including details of their maturity
terms, repricing terms and repricing spreads. In addition to these IRR-related
variables, details around the credit characteristics of the new business will also have
to be specified, e.g. FICO scores, LTVs, collateral values, etc. Because credit risk has
not been within the scope of ALM modeling, this information will most likely have to
be sourced from the business units responsible for product origination.
While business units have long engaged in periodic budgeting and forecasting
exercises, they are discovering that the level of rigor that is typically used is not
sufficient to meet regulatory expectations for balance sheet stress testing. The
development of a budget has traditionally been a top down exercise designed to
- 8. 8 © 2015 The Exequor Group, LLC
support high-level growth objectives, e.g. 10% earnings growth. The bank may
simply plan to do 10% more of everything as a way to achieve this objective;
alternatively, it might employ strategies that emphasize specific products.
Regardless, the aim of the budget is to support a top down target. Econometric
models, on the other hand, which correlate portfolio growth or new volume
originations to economic variables, are typically not used for budgeting. This is no
surprise as the primary objective of the budgeting exercise drives the assumptions,
not economic rational. The stress testing question begs the question of whether the
bank checks such assumptions against economically feasible outcomes.
Rarely are budgeting and forecasting exercises done within the context of fully-
specified economic scenarios. Scenarios for budgeting often contain no more detail
than a basic forward projection of interest rates that might not even be a forecast at
all; e.g. many banks still budget under an assumption of flat rates. Even if there is a
complete specification of business conditions, given their relatively short-term focus,
budgeting and forecasting exercises rarely include future conditions that are
materially different from current ones. As a result, business units have never
developed the tools and expertise necessary to consider the relationship between
economic variables and business origination in a forecast environment that is
materially different from current economic conditions.
In contrast to these practices, regulatory stress testing requirements for forecasting
reflect a strong preference for econometric models, because such models naturally
lend themselves to the study of the impact of changes in economic conditions on
business outcomes. As a result, many banks are finding that they have to increase the
level of sophistication of their forecasting processes. For example, in early rounds of
stress testing, banks were prone to utilize the same budget assumptions in all of the
FRB scenarios, in effect saying that the budget would be achieved “come hell or high
water”. While a bank may have historical evidence to support such an assumption,
regulators have pushed back on this naïve approach demanding that banks
understand and acknowledge the relationship between economic conditions and the
business they originate.
This is not to say that a bank should ignore business strategies, but rather business
unit expectations for production volumes should fit logically within the relevant
economic context. For example, if a scenario calls for housing prices to fall rapidly
and economic activity to shrink significantly, the forecast should anticipate a
slowdown in mortgage production and related interest and fee income even if the
bank had otherwise planned a significant increase in mortgage growth. Business
units must contemplate that expectations for performance may fall short in adverse
economic environments.
To be clear, there is not an expectation that banks should rely entirely on the output
of econometric forecast models. If new strategies which emphasize certain products
are currently in place, these would likely be accounted for in the predictions of
historically-calibrated econometric models. In such cases, business units should
- 9. 9 © 2015 The Exequor Group, LLC
override the model output. Be cautioned! Though such overrides may be warranted,
they do expose the bank to regulatory criticism if they lack proper documentation and
support.
Finally, forecasts should not assume perfect foresight. Regulators are quick to reject
an assumption that (risky) lending activity will be curtailed at the first sign of an
economic downturn. For most market participants in the last economic crisis, there
was absolutely no comprehension that it would be as severe as it ultimately was. The
majority of banks remained focused on executing key strategies and were slow to pull
back from the market. Regulators have rightly concluded that growth strategies are
likely to drive behavior long after prudent risk-taking should prevail; there is strong
evidence that banks which were lending aggressively going into the previous crisis
continued to do so even as housing prices began to decline and credit quality began
to deteriorate.
Risk Capital Consumption Models
Once the bank evolves the
existing book and new
business volumes over
the forecast horizon in
each scenario, the next
step is to calculate the
capital consumption for
each asset. Capital
consumption occurs
through both regulatory
and accounting
constructs. From a
regulatory perspective,
the different Basel
regimes (I, II, III) require that individual assets be placed into risk buckets, each of
which has a specific RWA charge; these charges are aggregated and total RWA must
be funded with a minimum level of capital. Accounting constructs relate to the
management of the Allowance for Loan and Lease Loss (ALLL) account as well as the
assessment of Other Than Temporary Impairment (OTTI)15 on investment securities.
The ALLL account is a balance sheet account that adjusts through the provision line
item in the income statement; OTTI adjustments also pass through the income
statement. Changes to either of these income accounts will affect the rate of capital
accumulation or shrinkage. In stress scenarios, these impacts can be material; as a
15 OTTI refers to the change in the value of a security resulting from a forecasted credit event, e.g.
loss of cash flow to the investor due to mortgage defaults in an MBS. This impairment receives a
different treatment for stress testing than a loss of value attributed to an increase in market interest
rates or liquidity spreads.
Source: Wikipedia page: Advanced IRB
- 10. 10 © 2015 The Exequor Group, LLC
result, the processes a bank uses to calculate them are likely to receive a significant
amount of regulatory scrutiny.
RWA amounts are generally determined by assigning on-balance sheet assets to
broad risk-weight categories according to the counterparty, or, if applicable, the
guarantor or collateral. Similarly, RWA amounts for off-balance sheet items are
calculated by a two-step process: (1) multiplying the amount of the off-balance sheet
exposure by a credit conversion factor (CCF) to determine a credit equivalent amount,
and (2) assigning the credit equivalent amount to a relevant risk-weight category. In
addition to the category, the balance and risk of the position must be determined. For
performing loans, the former is simply the outstanding book balance and for
defaulted loans, it is the Exposure at Default (EAD). The risk of the position is a
function of default likelihood, loss profile and maturity. It is important to recognize
that many of the components of RWA calculations are similar to those needed for the
measurement of ALLL and OTTI. There should be consistency between the bank’s
calculation of regulatory and accounting measures of capital consumption. To the
extent that they are not consistent, the bank may be subject to regulatory criticism.
RWA classifications have also grown increasingly more granular with each
subsequent Basel regime. Basle I classifications made some distinctions between
asset types, but underlying credit characteristics and credit migration were largely
ignored. Many of these weaknesses were addressed with the adoption of Basel II and
Basel III. RWA calculations now better reflect the actual risk of the position;
unfortunately, the process for determining RWA levels is now significantly more
complex and requires the tracking and analysis of many more data fields. These
calculations have proven challenging for a number of banks as the necessary data is
not always readily available.
The calculation of OTTI has also proven problematic. Banks typically take very little
credit risk in their investment portfolios, opting instead to invest primarily in
sovereign or agency securities; for these instruments, OTTI is largely a moot point. In
contrast, positions which do have credit risk, e.g. municipal securities, non-agency
MBS (NAMBS) and preferred stock, have to be modeled in order to determine if there
is credit impairment. While OTTI is often zero under baseline conditions for most
bank-owned investment securities, this assumption may not hold under stress
conditions. In either case, a bank cannot simply assume that there will be no OTTI.
Regulators are increasingly demanding that this assumption be substantiated with
properly constructed analytical models that bifurcate value changes into those due to
credit events and those due to changes in market interest rates.
In addition to the forecast of RWA, ALLL and OTTI, various other capital consumption
activities require the use of forecasts in order to comply with applicable accounting
and regulatory standards. For example, the unrealized loss on Available for Sale
(AFS) portfolio securities that flow through Other Comprehensive Income (OCI) now
count against regulatory capital for large banks. Estimates of value changes must
therefore be clearly documented and supported. Another modeling and reporting
- 11. 11 © 2015 The Exequor Group, LLC
challenge arises as some of the new limits and revisions to existing limits phase-in
over the next several years.
Additional Risk Exposures
In addition to credit risk, there are several additional drivers of loss and capital
consumption that the stress testing process must address; these include liquidity risk,
operational risk, counterparty risk and trade book risk. These exposures tend to be
highly idiosyncratic and the FRB scenarios do not specifically address them. Even so,
banks should acknowledge and incorporate them into the stress testing exercise
consistent with the specified scenario. The complexities of incorporating these
measures include differences in measurement time horizon (liquidity and trade book
events are typically very short-lived in relation to the nine quarter stress testing
horizon) and low correlations with macroeconomic drivers (operational risk events,
counterparty defaults and liquidity crises are exceptionally rare).
An example of an idiosyncratic risk which could be analyzed is the exposure to
liquidity risk which occurs through a heavy reliance on wholesale sources of funding,
e.g. FHLB advances, commercial paper or brokered deposits. During the most recent
crisis, troubled banks lost access to some or all of these sources of funds and increased
deposit rates to attract necessary funding. Such actions further reduced earnings and
capital accumulation. Another example can be found in large Wall Stress investment
banks which have significant counterparty exposures which occur through a
multiplicity of products, e.g. credit default swaps (CDS), interest rate swaps and back-
up lines of credit (LOCs). Such banks should analyze the impact of similar type events
in these markets. These can be constructed and analyzed in a separate scenario or
incorporated directly into the FRB stress scenarios.
Income and Expense Models
Because the objective of the stress testing exercise is to calculate capital ratios over
some time horizon, banks must estimate capital supply over that horizon; part of this
process requires an assessment of the net income (or loss) for each period in the
forecast. In a previous section, we addressed some of the challenges associated with
forecasting new business volumes and cash flow dynamics on these and existing
balances in credit stress tests. For this, most institutions turn to their ALM model
given the longstanding practice of modeling product cash flows under stress.16
In analyzing IRR, most institutions focus on risk to the net interest margin (NIM). The
NIM is simply the difference between interest income and interest expense. Some
banks calculate only this measure of earnings in their analysis of IRR as it captures
the majority of earnings volatility associated with changes in the level of market
interest rates. For stress testing, banks must project net income (NI) and this
necessarily requires that the modeling effort be extended to include non-interest
16 Although the stress events modeled in an ALM context have almost always been entirely rate-
driven.
- 12. 12 © 2015 The Exequor Group, LLC
income and expense. Because the point of the IRR exercise is to understand how
changes in interest rates will affect earnings and economic capital, additional risk
factors are usually assumed to remain unchanged. We have already noted that
traditional budgeting and forecasting exercises assume business as usual across a
very short time horizon. This means that many banks are likely to find that internal
models of non-interest income and expense dynamics are very simple, if they exist at
all, and do not meet the needs of credit stress testing.
Examples of non-interest income and expense dynamics which need to be considered
include:
The level of mortgage origination fees in a slow housing market
Foreclosure and asset maintenance expenses associated with an increase in
unemployment
Incentive compensation levels when capital levels are stressed
Marketing expenses associated with raising additional retail deposits to offset
the loss of other funding sources
Legal expenses in a housing crisis
Investment banking and legal expenses associated with efforts to raise capital
In addition to the innate challenges associated with estimating non-interest income
and expense, the bank needs to ensure that these cash flows are consistent with the
treatment of related balance sheet accounts; e.g. late fees on credit card accounts
should track the evolution of payment delinquencies on card balances. Similarly, as
loans go through the default and charge-off process, the accrual of interest income
should terminate at appropriate times. These modeling requirements are difficult for
banks that perform top-down accrual and credit calculations on separate systems,
each of which is likely to have a different charts of accounts. This occurs most often
when using separate ALM and credit systems as ALM accounts are generally
organized around interest rate criteria while credit systems use factors such as
geography, leverage and credit bands to group transactions. Subsequent processes
that overlay behaviors from one chart of accounts (credit) onto another (ALM) will
introduce inconsistencies and errors into the modeling process. These inconstancies
require considerable effort to untangle. Regardless, accuracy, speed and flexibility
are significantly impaired.
Capital Ratio Calculations
A variety of regulatory and accounting measures of assets and capital make up
different capital ratios for which minimum levels have been set. These ratios take the
following form:
𝐶𝑎𝑝𝑖𝑡𝑎𝑙 𝑟𝑎𝑡𝑖𝑜 =
𝐶𝑎𝑝𝑖𝑡𝑎𝑙 𝑀𝑒𝑎𝑠𝑢𝑟𝑒
𝐴𝑠𝑠𝑒𝑡 𝑀𝑒𝑎𝑠𝑢𝑟𝑒
.
The capital measure in the above equation corresponds to a capital supply measure;
these include Common Equity Tier 1, Tier 1 Common, Tier 1, and Total Capital. The
- 13. 13 © 2015 The Exequor Group, LLC
asset measure is either risk-weighted or volume weighted (for simple leverage
measures).
In 2012, US bank regulators issued their final rule for implementation of the Basel III
capital standards. 18 The rule revises their risk-based and leverage capital
requirements and implements a revised definition of regulatory capital, common
equity tier 1, establishes a higher minimum tier 1 capital requirement and, for
banking organizations subject to the advanced approaches risk-based capital rules,
imposes a supplementary leverage ratio that incorporates a broader set of exposures
in the denominator. The rule also incorporates these new requirements into the
agencies’ prompt corrective action (PCA) framework. In addition, the final rule
establishes limits on a banking organization’s capital distributions and certain
discretionary bonus payments if the banking organization does not hold a specified
amount of common equity tier 1 capital in addition to the amount necessary to meet
its minimum risk-based capital requirements. Further, the final rule amends the
methodologies for determining risk-weighted assets for all banking organizations
and introduces disclosure requirements that would apply to top-tier banking
organizations domiciled in the United States with $50 billion or more in total assets.
It also adopts changes to the agencies’ regulatory capital requirements that meet the
requirements of section 17119 and section 939A20 of the DFA.
While all CCAR and DFAST banks are expected to demonstrate compliance with the
minimum capital ratios in all of the stress testing scenarios, the FRB actually runs its
own stress testing model for each of the CCAR banks in order to independently assess
capital adequacy. It is these model results, not the bank’s own, which determine if the
bank passes or fails the quantitative criteria of the stress testing exercise. This raises
a huge challenge for CCAR banks, as there is the possibility of material differences
between their internal models and those of the FRB. For example, many banks with
large wealth management units have found that their own loan loss projections,
which are consistent with their actual loss experience, are significantly less than the
18 See OCC 2012-0008.
19 This section requires regulators to establish minimum leverage capital and risk-based capital
requirements for insured depository institutions, depository institution holding companies and
nonbank financial companies supervised by the FRB. In addition, it establishes that certain BHC
subsidiaries of foreign banking organizations which were exempt from the minimum capital
standards must now comply with the standards, albeit via a phase-in process.
20 This section prohibits banks from relying on rating agency risk measures, e.g. Moody’s and S&P
ratings, for estimating risk exposures; alternative methods must be utilized.
Regulatory Capital Levels 1-Jan-2014 1-Jan-2015 1-Jan-2016 1-Jan-2017 1-Jan-2018 1-Jan-2019
Capital conservation buffer ….. ….. 0.625% 1.25% 1.875% 2.5%
Minimum common equity tier 1 capital ratio + capital
conservation buffer 4.0% 4.5% 5.125% 5.75% 6.375% 7.0%
Minimum tier 1 capital ratio + capital conservation buffer 5.5% 6.0% 6.625% 7.25% 7.875% 8.5%
Minimum total capital ratio + capital conservation buffer 8.0% 8.0% 8.625% 9.25% 9.875% 10.5%
Maximum potential countercyclical capital buffer ….. ….. 0.625% 1.25% 1.875% 2.5%
Source: Bank for International Settlements
- 14. 14 © 2015 The Exequor Group, LLC
FRB’s. This discrepancy can lead to the need for capital buffers beyond the bank’s
assessment of its own risk-based need.
Because regulators anticipated that the new capital requirements would force banks
to accumulate or issue significant amounts of new capital, banks are being allowed to
phase-in compliance with the new minimums over the next several years. A bank
may therefore find itself, within the forecast horizon of the stress test, dealing with a
change in the applicable Basel regime as well as the phase-ins. This makes the task
of demonstrating compliance with the minimum requirements a challenging process.
Also included in the new guidance are phase-outs of certain types of capital which
banks previously counted toward regulatory capital, e.g. trust preferred securities.
Correct modeling of these phase-outs is necessary in order for the bank to determine
if it has a need for alternative forms of capital.
Capital Planning
Core to the CCAR and DFAST exercise is the principle that capital today should be
adequate to meet the challenges of a stress environment and, further, that capital
actions contemplated in the future should not jeopardize bank solvency in a stress
environment. The production and consumption of capital includes the accumulation
of net income and accounting and RWA effects as described above in addition to
traditional capital activities that include dividend payments, share repurchases,
merger and acquisition activities as well as the issuance of various capital
instruments. Capital plans contain the contemplation of all of these activities.
There are four mandatory elements of
a capital plan:
1) An assessment of expected
sources and uses of capital
2) A detailed description of the
BHC’s process for assessing
capital adequacy
3) The BHC’s capital policy
4) A discussion of any baseline
changes to the BHC’s business
plan that are likely to have a
material impact on the BHC’s
capital or liquidity adequacy.
Each of the elements of the capital plan must acknowledge the potential for not only
base but also stress conditions across the entirety of the forecast horizon. In fact, the
forecast may need to be extended beyond the 13 quarter CCAR horizon in cases where
regulatory phase-ins or other business activities may materially influence the capital
position of the bank. While preceding sections of the paper dealt with the capital
Our capital plan review helps ensure
that the capital distribution plans of
large banks will not compromise their
ability to continue lending to
businesses and households even
during a period of serious financial
stress.
Daniel Tarullo, member of the BOG, in
comments about the 2015 stress test
results
- 15. 15 © 2015 The Exequor Group, LLC
consumption calculations for the bank’s core business activities, there are additional
considerations with regard to the traditional capital activities of the bank.
Dividends
Capital plans must consider dividends to holders of both common and preferred
shares of the bank. Regulators believe that a reduction or suspension of dividends in
a stress environment is slow to happen because banks tend to be very hesitant to
lower dividends before observing similar actions from their peers. Because of this
belief, a soft cap of 30% has evolved on the dividend payout ratio.21 While it is
possible for banks to pay out more than 30% of earnings, such intentions typically
receive a higher level of scrutiny and have become increasingly difficult to justify as a
regular business practice. Capital plans should also consider dividends that the bank
expects to pay to their foreign parent.
Share Repurchases
Capital plans should acknowledge the variety of repurchase programs that a bank can
utilize. Some remain at the discretion of the bank and are easier to curtail or halt.
Others, such as non-directed accelerated share repurchase programs, are difficult for
the bank to stop once they have begun. In all cases, the bank should specify criteria
for what types of market and economic conditions would lead to suspension (or non-
execution) of the program. Any share repurchase program should also differentiate
in their plan the portion of repurchases needed to support compensation-related
purchases from pure market activities as the compensation-related shares will end
up back in the market. Both dividends and share repurchase programs will require a
forecast of share price to allow the accurate calculation of volumes and associated
impacts; this should be done in a manner that is consistent with the economic
scenario being modeled.
Mergers and Acquisitions
Rarely does a bank know the specific target or timing of a contemplated acquisition
well in advance of the actual acquisition, but that is not to say that an acquisitive bank
can ignore future acquisitions in its capital plan. Lacking a specific target, a bank must
determine what capital reserve is required to handle various sizes of potential
activity without the need to modify other uses of capital such as dividends or share
repurchases. The capital plan should identify the size of an acquisition at which the
bank would need to re-submit or re-build its stress test and capital plan. In addition,
the plan should consider what types of acquisitions, regardless of size, would
represent a material change to the bank’s business model. Similarly, the plan should
specific the analysis of any material portfolio acquisitions or divestitures on capital
adequacy.
21 Source: BIS Quarterly Review “How Have Banks Adjusted to Higher Capital Requirements,”
September 2013 and Barron’s “Banks Await Fed OK on Payout Hikes,” March 6, 2015.
- 16. 16 © 2015 The Exequor Group, LLC
Quantitative Information and Stress Testing Model Output
The FRY-14 and DFA schedules required for submission to the FRB are extremely
detailed and capture all of the major activities of the bank. They include current
position and forecast data as well as output from a bank’s stress testing model. For
CCAR banks, the submission of raw data must be sufficient for the FRB to run its own
stress testing models. The production of the requisite schedules requires the
cooperation of financial planning, accounting and risk functions. Few organizations
are properly equipped with cross functional teams necessary to produce these
schedules in a timely and accurate manner. Any deficiencies or errors in the data
could lead to erroneous and punitive results. Additionally, the FRB load process
appears to be very sensitive to format issues, so even small issues with cell formats
can lead to rejection of the templates.22
Another challenge is that many of the required data elements and schedules have not
traditionally been used in internal modeling exercises or by the management of the
bank; therefore, it can be difficult to get appropriate business units to review and
validate the submissions. Banks should be aware that during regulatory exams of
other key risk and balance sheet management functions, e.g. ALM and ALLL,
regulators are likely to look for discrepancies between the regulatory schedules and
other internal management reports. Stress testing data and models must be
consistent with other risk and balance sheet models which have been used to manage
the bank for years. Because stress testing is still largely an annual exercise, it is easy
for regulators to conclude that it is not part of the business as usual process of
managing the bank; hence, the representations around capital adequacy using these
processes could be suspect.
Qualitative Elements
Recent results from CCAR submissions show banks are increasingly passing the
quantitative aspects of the stress testing process, yet some are failing the qualitative
component. While there are likely a variety of contributing factors, our survey of
banks reveals a failure to utilize a validated and transparent modeling framework and
an inability to demonstrate integration of stress testing results with core bank
activities. These items are largely within the domain of key governance functions,
including audit and model validation, yet continue to be overlooked.
Audit and model validation functions often conduct examinations of models and
model output which are perfunctory. This occurs because personnel in these
oversight functions are typically unfamiliar with the detailed functions of the
business functions for which they are responsible. As a result, review work has
focused on details that, while important, may fail to identify critical flaws in process
22 These format issues will normally result in a requirement to resubmit as opposed to outright
failure. However, the presence of such errors could decrease confidence in the qualitative aspects of
the bank’s process.
- 17. 17 © 2015 The Exequor Group, LLC
design and execution. For example, audit and model validation are unlikely to call out
the failure to use competing risk models in the computation of product cash flows. In
recalling the discussion of cash flows earlier in this paper, while the math used to
quantify each of these risks may be correct, market and credit risks are not additive;
the proper evolution of cash flows requires a simultaneous analysis of risk factors. It
is no surprise that this error escapes audit and model validation teams as it is just as
likely to escape people in both market risk and credit risk functions at most banks.
Members of these and other key
governance functions, e.g. capital
committee, ALCO and the board of
directors, will require additional
education and training in order to
understand the business functions for
which they are responsible. This will be
an ongoing challenge, especially for
audit, as their work in a particular area
may only occur once a year and
individual responsibilities may shift
every couple of years. These
circumstances will hinder their ability to
provide effective challenge of models
and model output. While this may have
been acceptable in the past, continued
weaknesses may lead to a regulatory
failure of stress testing which will result
in severe limitations on dividend and
stock buy-back activity.
As for demonstrating that stress testing is a key business management process,
certain business functions should be able to evidence that they both drive and
integrate feedback from the stress testing process. These include:
1) Risk Identification
2) Risk Appetite Setting
3) Strategic Planning
4) Mergers and Acquisitions
5) Budgeting and Forecasting
6) Compensation and Incentive Management
7) Credit Risk Measurement
8) Interest Rate Risk Management
9) Liquidity Risk Management
10) Operational Risk Management
11) Enterprise Wide Risk Management
Two non-US banks…failed CCAR on
qualitative grounds despite having
more than enough capital to pass the
quantitative assessments….They
show that the Fed is concerned that
the firm lacks some measure of
internal controls to assess and reduce
risk….Banks that demonstrate a
chronic inability or unwillingness to
correct deficient behavior can also be
subject to enhanced regulatory
actions, including but not limited to
cease and desist orders….
Why Big Banks Cut it Close in Fed’s
Stress Tests, American Banker, March
11, 2015.
- 18. 18 © 2015 The Exequor Group, LLC
No doubt, the effort to complete an annual or semi-annual stress testing process is
all-consuming, but the submission of results to the FRB does not constitute an end to
the process. In order to demonstrate an evolution in risk and balance sheet
management, banks must create feedback loops that allow for lessons learned to be
incorporated in the management process. This challenge is similar to what was
observed in the early days of ALM; organizations would take their models off the shelf
once per quarter to run IRR reports to satisfy regulators. As soon as the computations
were complete, the model was put back on the shelf until the next quarter. Over time,
banks learned to integrate these model results into key risk and balance sheet
management activities. Stress testing is expected to follow a similar course, albeit
much faster.
Another qualitative element of stress testing is the ability to demonstrate an
understanding of the strengths and weaknesses of various modeling approaches.
Effective risk management is about much more than just throwing quants at data and
commanding them to build a solution. It is important to recognize that important
components of balance sheet management, e.g. strategic development, marketing
initiatives and compensation schema, can invalidate model assumptions which are
predicated only on past behaviors. Without a firm understanding of the drivers of
behavior, management will constantly be challenged to demonstrate that their
approaches to risk and balance sheet management are complete; such weaknesses
will exposure the bank to regulatory criticism.
Each component of balance sheet stress testing both influences and is impacted by
other aspects of the balance sheet management process. The construction of a
successful stress testing process should ensure that participants are able to
demonstrate proper model selection and management, evidence strong validation
and effective challenge and appropriate integration with existing bank processes.
Extensive education and training for bank personnel, from analysts to board
members, will be required in a way that we have never seen. Stress testing must serve
not only as a regulatory compliance exercise but also as a core business management
activity that compels banks to make smarter and more informed decisions
throughout the entirety of the business cycle.
- 19. 19 © 2015 The Exequor Group, LLC
Conclusion
The stress in stress testing arises not only from the difficulties in correctly completing
each of the individual stress testing components, but also from ensuring that the
scenario specification has been applied consistently across each of them. It is
imperative to recognize that the forecasting requirements and supporting elements
are remarkable in their breadth and their detail; as such, all of the related work effort,
including model validation, must remain cognizant of critical submission deadlines.
There need to be severe consequences associated with delayed completion of a
component or a deficiency, especially in relation to best practices. While we may
never fully take the stress out of stress testing, an understanding of the requirements
and role of each of the end-to-end process components can help each of the business
units appreciate the challenge of the overarching problem and align them around a
set of productive and fruitful efforts; after all,
Suffering becomes beautiful when anyone bears great calamities with
cheerfulness, not through insensibility but through greatness of mind.
– Aristotle
- 20. 20 © 2015 The Exequor Group, LLC
Aboutthe Authors
David and Jim are partners in the Financial Services practice of The Exequor Group.
The Exequor Group is a consultancy with industry verticals in Life Sciences and
Financial Services. The Financial Services practice specializes in designing analytical
and governance solutions to the challenges associated with risk and performance
measurement. Our areas of expertise include stress testing, asset/liability
management, funds transfer pricing and capital and liquidity management.
We provide both strategic advisory services related to Treasury and Risk
Management as well as data modeling and quantitative solutions that define best
practice risk analytics. In addition to developing and implementing strategic risk and
balance sheet management solutions to address business problems and improve
financial returns, The Exequor Group strives to derive incremental value from
regulatory compliance spends.
Our partners have in-depth experience in Treasury and Risk Management in leading
GSIB and DFA US and global financial service providers. Leadership roles have
included Head of Capital Planning, Treasurer, Chief Investment Officer, Head of
Asset/Liability Management, ICAAP Director, and Head of Credit Portfolio
Management.
Given the stringent and evolving regulatory environment our clients face, we apply
our expertise in several ways:
Training Exequor develops and delivers courses on a variety of risk and balance
sheet management subjects, including stress testing, ALM, FTP, and non-maturity
deposit modeling. We also provide special training tracks for validation and audit
teams, helping them to understand the business functions and regulatory issues
in the areas they review.
Validation We conduct both quantitative and qualitative reviews of models and
processes for validation across multiple disciplines: capital, credit, ALM, FTP,
forecasting, stress testing, and liquidity.
Policy and Governance Design CCAR and DFA stress testing use test
requirements demand new approaches to the implementation, operation and
management of models of capital and liquidity risk. The Exequor team has the
expertise and experience to develop viable solutions and best practices in
addressing these highly complex challenges.
Behavioral Model Design We have developed a suite of cash flow models, which
combine vital industry knowledge with PhD-level quantitative modeling skills;
these models are capable of leveraging both client data and our own exhaustive
industry data, which spans a broad range of asset classes.
Please visit www.exequorgroup.com or call David Green at 404.966.0054 for more
information.