
Recomendados
Más contenido relacionado
La actualidad más candente
La actualidad más candente (20)
Destacado
Destacado (13)
Similar a Aaj ka trend 30.11.16
Similar a Aaj ka trend 30.11.16 (18)
Último
Último (20)
Aaj ka trend 30.11.16
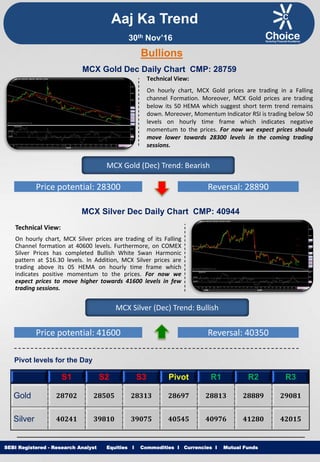
- 1. Equities I Commodities I Currencies I Mutual Funds Aaj Ka Trend Technical View: On hourly chart, MCX Gold prices are trading in a Falling channel Formation. Moreover, MCX Gold prices are trading below its 50 HEMA which suggest short term trend remains down. Moreover, Momentum Indicator RSI is trading below 50 levels on hourly time frame which indicates negative momentum to the prices. For now we expect prices should move lower towards 28300 levels in the coming trading sessions. SEBI Registered - Research Analyst Equities I Commodities I Currencies I Mutual Funds Bullions MCX Gold Dec Daily Chart CMP: 28759 MCX Gold (Dec) Trend: Bearish Price potential: 28300 Reversal: 28890 MCX Silver Dec Daily Chart CMP: 40944 Technical View: On hourly chart, MCX Silver prices are trading of its Falling Channel formation at 40600 levels. Furthermore, on COMEX Silver Prices has completed Bullish White Swan Harmonic pattern at $16.30 levels. In Addition, MCX Silver prices are trading above its 05 HEMA on hourly time frame which indicates positive momentum to the prices. For now we expect prices to move higher towards 41600 levels in few trading sessions. MCX Silver (Dec) Trend: Bullish Price potential: 41600 Reversal: 40350 Pivot levels for the Day S1 S2 S3 Pivot R1 R2 R3 Gold 28702 28505 28313 28697 28813 28889 29081 Silver 40241 39810 39075 40545 40976 41280 42015 30th Nov’16
- 2. Equities I Commodities I Currencies I Mutual Funds Technical View: On hourly chart, MCX Copper price has given breakdown of its Broadening Top formation at 394.10. Moreover, COMEX Copper prices has breached its Horizontal trend line at $2.61 levels on hourly chart. In addition MCX Copper prices are trading below its 21 HEMA. Furthermore, momentum indicator RSI is trading below 30 levels on hourly time frame. For now we expect prices to move lower towards 380 levels in coming trading sessions. SEBI Registered - Research Analyst Equities I Commodities I Currencies I Mutual Funds MCX Copper Nov Daily Chart CMP: 392.85 MCX Copper (Nov) Trend: Bearish Price potential: 380 Reversal: 400 MCX Crude Oil Dec. Daily Chart CMP: 3113 Technical View: MCX Crude Oil prices have witnessed breakdown of its Head & Shoulder Pattern at 3116 in hourly time frame. MCX Crude Oil is trading below its 50 HEMA on hourly chart. In addition, NYMEX Crude Oil has formed Rounding top pattern in hourly time frame. Moreover, Momentum indicator RSI is trading below 40 levels on hourly chart which suggest the negative movement in the prices. For now we expect prices to move lower 3030 towards levels in coming trading sessions. MCX Crude Oil (Dec) Trend: Bearish Price potential: 3030 Reversal: 3180 Pivot levels for the Day S1 S2 S3 Pivot R1 R2 R3 Copper 394.0 387.3 378.7 396.0 402.6 404.6 413.3 Crude 3159 3065 2923 3207 3301 3349 3491 Base Metal Energy Aaj Ka Trend 30th Nov’16
- 3. Equities I Commodities I Currencies I Mutual FundsSEBI Registered - Research Analyst Equities I Commodities I Currencies I Mutual Funds Other Base Metals & Energy S1 S2 S3 Pivot R1 R2 R3 Trend Copper 394.0 387.3 378.7 396.0 402.6 404.6 413.3 Aluminum 117.3 116.0 113.8 118.2 119.5 120.4 122.6 Lead 162.2 157.5 148.9 166.1 170.7 174.6 183.2 Nickel 766.5 745.4 715.1 775.7 796.8 806.0 836.3 Zinc 187.4 182.4 172.8 192.1 197.1 201.7 211.4 Natural Gas 226.3 222.4 215.2 229.6 233.5 236.8 244.0 Fundamental News: Gold prices slipped on Tuesday as the dollar stabilized after falls in the previous session as investors turned their attention to upcoming U.S. economic reports and Wednesday’s OPEC meeting. Gold prices rose more than 1% on Monday, rebounding from nine-and-a-half month lows as the dollar reversed some of its post U.S. election gains after surging to almost 14-year highs last week. Time for OPEC and non-OPEC meeting to discuss global oil production deal is still being discussed, Russian Energy Ministry spokeswoman told Reuters on Tuesday. Oil prices fell more than 1% on Tuesday, pressured lower by growing doubts that the Organization of the Petroleum Exporting Countries will be able to reach an agreement on a deal to limit output. Oil fell over 1% Tuesday as doubts about OPEC's ability to deliver a planned cut in output grew. Crude prices fell in Asia on Tuesday as wrangling by OPEC members over the details of a proposed output curb continues. Oil prices jumped in choppy trade on Monday after Iraq’s oil minister said he was “optimistic” that Wednesday’s crunch OPEC meeting will yield an agreement on output cuts. Oil prices fell over 1 percent on Tuesday on market jitters over whether producer cartel OPEC would be able to hammer out a meaningful output cut during a meeting on Wednesday, aimed at reining in a global supply overhang and propping up prices. The dollar extended gains against the other majors currencies on Tuesday, boosted by the release of upbeat U.S. economic growth data. Aaj Ka Trend 30th Nov’16
- 4. Equities I Commodities I Currencies I Mutual FundsSEBI Registered - Research Analyst Equities I Commodities I Currencies I Mutual Funds International Market Commodity Closing Price Gold 1194 Silver 16.74 Crude Oil 45.44 Brent Crude Oil 47.55 Natural Gas 3.34 COMEX/NYMEX/ICE ( Precious Metals & Energy) Currency & Commodity Index Currency (Spot) Current Price USD / INR 68.71 Dollar Index 101.03 EUR / USD 1.06 CRB Index* 183.97 Closing as on 29.11.16 *Closing as on 29.11.16 LME (Base Metals) ( $ per tones) Commodity Closing Price Copper 5720 Aluminum 1730 Zinc 2780 Lead 2340 Nickel 11280 SHFE (Base Metals) (Yuan per tones) Commodity Closing Price Copper 4710 Aluminum 13720 Zinc 23440 Lead 21020 Closing as on 29.11.16 Closing as on 29.11.16 LME INVENTORY DATA Aaj Ka Trend 23-Nov-16 24-Nov-16 25-Nov-16 28-Nov-16 29-Nov-16 Aluminium -7801 899 -5451 26524 -3226 Copper -2874 -3526 1324 -2951 1224 Lead 0 0 0 0 0 Nickel 468 -223 -6 -715 44 Zinc -451 -1274 -226 -224 -175 30th Nov’16
- 5. Equities I Commodities I Currencies I Mutual Funds This is solely for information of clients of Choice Broking and does not construe to be an investment advice. It is also not intended as an offer or solicitation for the purchase and sale of any financial instruments. Any action taken by you on the basis of the information contained herein is your responsibility alone and Choice Broking its subsidiaries or its employees or associates will not be liable in any manner for the consequences of such action taken by you. We have exercised due diligence in checking the correctness and authenticity of the information contained in this recommendation, but Choice Broking or any of its subsidiaries or associates or employees shall not be in any way responsible for any loss or damage that may arise to any person from any inadvertent error in the information contained in this recommendation or any action taken on basis of this information. Technical analysis studies market psychology, price patterns and volume levels. It is used to forecast future price and market movements. Technical analysis is complementary to fundamental analysis and news sources. The recommendations issued herewith might be contrary to recommendations issued by Choice Broking in the company research undertaken as the recommendations stated in this report is derived purely from technical analysis. Choice Broking has based this document on information obtained from sources it believes to be reliable but which it has not independently verified; Choice Broking makes no guarantee, representation or warranty and accepts no responsibility or liability as to its accuracy or completeness. The opinions contained within the report are based upon publicly available information at the time of publication and are subject to change without notice. The information and any disclosures provided herein are in summary form and have been prepared for informational purposes. The recommendations and suggested price levels are intended purely for trading purposes. The recommendations are valid for the day of the report however trading trends and volumes might vary substantially on an intraday basis and the recommendations may be subject to change. The information and any disclosures provided herein may be considered confidential. Any use, distribution, modification, copying, forwarding or disclosure by any person is strictly prohibited. The information and any disclosures provided herein do not constitute a solicitation or offer to purchase or sell any security or other financial product or instrument. The current performance may be unaudited. Past performance does not guarantee future returns. There can be no assurance that investments will achieve any targeted rates of return, and there is no guarantee against the loss of your entire investment. POTENTIAL CONFLICT OF INTEREST DISCLOSURE (as on date of report) Disclosure of interest statement – • Analyst interest of the stock /Instrument(s): - No. • Firm interest of the stock / Instrument (s): - No. Disclaimer Contact Us Amit Pathania Research Associate amit.pathania@choiceindia.com Rohan Patil Research Associate rohan.patil@choiceindia.com www.choicebroking.incustomercare@choiceindia.com SEBI Registered - Research Analyst Equities I Commodities I Currencies I Mutual Funds Aaj Ka Trend 30th Nov’16 Neeraj Yadav Research Advisor neeraj.yadav@choiceindia.com Anish Vyas Senior Research Associate anish.vyas@choiceindia.com Amit Pathania Digitally signed by Amit Pathania DN: cn=Amit Pathania, o=Choice Equity Broking Pvt. ltd, ou=Research Department, email=amit.pathania@choiceindia.com, c=IN Date: 2016.11.30 08:11:29 +05'30'