EVALUATION OF RADIATED EMISSIONS FROM PCB AND CABLES AT POST-LAYOUT LEVEL
JOHN_RAE_1102333_PROJECTREPORT
1. Studying the Radiation Hardness of Scintillating
Fibres for an Industrial Muon Tomography System
John Rae
School of Physics and Astronomy, University of Glasgow
E-mail: 1102333r@student.gla.ac.uk
Abstract. Investigations are made on Saint-Gobain BCF-12 2mm-pitch plastic scintillating
fibres and their susceptibility to radiation damage. Fibres are subjected to doses of 1,7 and
30 Grays, in simulation of anticipated industry radiation levels resulting in an efficiency drop
of ∼22%. Further study found that application of reflective paint is capable of restoring the
efficiency loss.
1. Introduction
Cosmic-Ray Muon Tomography is a technique that exploits the penetrating quality of muons,
allowing imaging of shielded structures that are often inaccessible by conventional imaging
methods such as X-rays. Scattering tomography measures the input and output muon
trajectories on a system, from this images are produced, showing the dense regions of
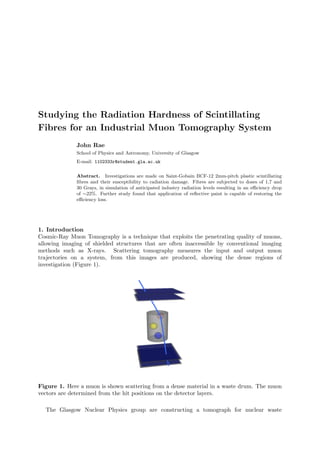
investigation (Figure 1).
Figure 1. Here a muon is shown scattering from a dense material in a waste drum. The muon
vectors are determined from the hit positions on the detector layers.
The Glasgow Nuclear Physics group are constructing a tomograph for nuclear waste
2. barrels [1]. Nuclear waste contains heavy nuclei that scatters muons through large angles and
allows imaging. The prototype machine has 8 detection layers, comprising of 128 scintillating
fibres each. These fibres are fed into a 64 pixel PMT (2 fibres per pixel). As a muon passes
through a scintillating fibre it creates light, this light is converted in the PMT to a charge signal
which can be detected and then tracked back to a position. These positions when combined give
a trajectory for before and after. From these trajectories the deviation is calculated, and after
thousands of detections an image is produced. The imaging technique is detailed in [1].
An industry tomograph would be subject to a certain amount of radiation whilst imaging
a barrel. It is important that the components of the tomograph have a low susceptibility to
radiation damage, and any damage can be calculated and accounted for.
This project aims to detail the severity of the radiation damage, exposing Saint-Gobain BCF-
12 2mm-pitch plastic scintillating fibres to a range of doses, similar to the tomograph would
experience in industry. It was hypothesized that the scintillating fibres would be susceptible to
radiation damage although may exhibit some annealing [2] properties. A barrel radiates a dose
of roughly 1Gray/Day according to estimates from industry.
The Dalton Cumbria Facility (DCF) is home to a cobalt60 irradiator (Figure 2), that can
simulate industry conditions. Several investigations were made into producing an eligible test
set up that could then be subjected to radiation, within the small restricted dimensions of their
radiation chamber.
Figure 2. Cobalt-60 Radiation Chamber at the Dalton Cumbria Facility
2. Background Theory
2.1. Cosmic-Ray Muons
Muons are negatively charged elementary particles that are observed at sea level with a flux
of 1 per cm2 per minute, due to cosmic ray interactions within the planets atmosphere. They
are produced in weak interactions, caused by highly energetic circumstances. Atomic nuclei in
the Earth’s upper atmosphere collide with cosmic-ray protons producing short-lived pions which
favourably decay into muons. Muons have a mean lifetime of 2.2µs, charge of ±1e and a mass
of 105.7MeV/c2.
3. 2.2. Coulomb Scattering
The muon particle is described as ‘penetrating’ as its reaction to electrostatic forces is relatively
small. Coulombs law demonstrates the electrostatic force of interaction, seen in equation 1.
F =
q1q2
4π 0r2
= ma (1)
Muons are roughly 200 times heavier than electrons, with equal charge and hence the acceleration
of muons due to electrostatic forces is roughly 200 times less. This results in highly penetrative
particles. This unique property is the basis for muon tomography, allowing the ability to
distinguish various densities of inaccessible materials.
2.3. Scintillating Fibres
Scintillation in plastic fibres occurs by the process of fluorescence; the excitation of a molecule
from a singlet ground state to higher quantum states (singlet or triplet). De-excitation of
these states results in a photon being emitted. This is a relatively quick process, happening in
nanoseconds.
The BCF-12 2mm-pitch plastic scintillating fibres consist of a polystyrene core and emit
wavelengths ranging from 400nm-540nm with a peak wavelength of 432nm. The scintillation
yield is 8000 photons for every MeV from a minimum ionizing particle [3] but due to light loss
only 4% of this is recorded at the the fibre’s end, depending on the location of the scintillation
event. Figure 3 illustrates the scintillation and total internal reflection within the fibre calculated
using Snell’s law:
n1
n2
=
sinθ1
sinθ2
(2)
The scintillating core has a refractive index, n1=1.6 and the optical cladding has a refractive
index, n2=1.49. Rearranging gives the critical angle:
sin−1 1.49
1.6
= 68.6◦
(3)
Figure 3. Typical Saint-Gobain round scintillating fibre [3].
4. 2.4. Radiation Damage
C. Zorn [2] found that the light loss in scintillating fibres as a result of irradiation can be
separated into two components. A drop in scintillation yield and a drop in the light transmission
as seen in Figure 4. It is pointed out that the transmission loss is more noticeable in long fibres,
as would be expected. An initial study was carried out to confirm this observation, detailed in
section 3.
Figure 4. C. Zorn [2] observed that there were two components contributing to the light loss
due to radiation in scintillating fibres. Scintillation yield exhibits a consistent drop regardless
of detector distance from source. Transmission loss increases as the source is moved from the
detector. The combined effect is also shown.
2.5. PMTs
Photomultiplier tubes (PMTs) are acutely sensitive light detectors. Figure 5 demonstrates the
path of an incident photon: a photoelectron is excited and focused onto electron multiplier
dynodes; in a vacuum chamber the dynodes amplify the initial photoelectron several times;
the charge is read out on the multianode at a position corresponding to the original hit. The
Hamamatsu H8500 PMTs used in this study have a peak wavelength of 400nm and 12 dynode
stages.
5. Figure 5. This is a demonstration of how an incident photon is converted in a standard Multi-
Anode Photo Multiplier Tube. This figure was taken from reference T. Hakamata [4]
3. Method
To successfully investigate the fibres there were a number of specifications that needed to be
met; the irradiated fibres must fit within the radiation chamber (20cm x 25cm x 30cm); a fast
data acquisition method must be used to attempt to observe annealing; the shortening of fibres
must not affect the validity of the experiment. A strontium source would be used to simulate
muon scintillation; the electron emitter with an activity of 34MBq allowed 105 ‘events’ to be
taken over the period of an hour; muon measurements generally took 3-4 working days.
C. Zorn’s [2] findings motivated a simple study on the length attenuation of the fibres by
varying the position of scintillation along the fibre. The strontium source was placed at varying
lengths along a light-sealed 1.6m fibre and connected to a single channel PMT. The results are
shown in Figure 6.
It is clearly seen that the peak voltage and average voltage of the PMT signal decreased as
the distance between the source and the PMT increased. These findings are consistent with C.
Zorn’s [2], indicating that reducing the length of the fibres was a favorable step in removing
unnecessary errors as well as logistically fitting inside DCF radiation chamber. Any drop in
signal observed after irradiation was then attributed to radiation damage.
The experimental apparatus consists of a pair of detection paddles; a multi-pixel PMT; delay
cables; charge to digital converter (QDC); fibres under investigation and a scintillation source
(cosmic ray muons/strontium beta emitter). When both paddles detect the presence of an
ionising particle a signal is sent to the QDC. The QDC then converts the charge read out from
the PMT at that instant. However it is obvious from Figure 7 that the particle will pass through
the fibres before reaching the second detection paddle, and the the charge read out of the PMT
would be to late. To ensure that the ‘open gate’ coincides with the charge signal, 30 metres of
cable is introduced between the PMT and QDC, delaying the PMT’s signal.
6. Figure 6. Signal attenuation with increasing length of scintillation.
Figure 7. This is a rudimentary diagram demonstrating the role of detection paddles and the
necessity for very long cables to introduce a delay. This allows the ‘open gate’ to coincide with
the PMT charge read-out.
3.1. Optimisation of Experimental Set up
Importance was placed on building a reliable and reproducible test set-up to allow for relevant
measurements to be taken prior to and post irradiation. The initial prototype consisted of two
rows of 8 fibres stacked on top of each other; individually wrapped in black lightproof tubing;
placed between two Rohacell foam sheets, in further effort to negate any light-leaks; aligned using
a polyoxymethylene (POM) plastic block, designed for the prototype tomograph and placed in
contact with PMT pixels via a silicon pad. An electronics system with two detection paddles
are placed above and below the fibres as seen in Figures 7 and 8. These paddles can detect
when a muon is present and through the use of extensive delay cables, the PMT signal is read
out at that time. The entire set up was then covered in light-proof tarpaulins in a final attempt
to remove light pollution, so that the only light present in the collected data originated from
scintillation.
3.1.1. Flux and Intensity Deficiencies Pixel maps seen in Figure 9 proved to be an integral
part of evaluating prototype set-ups allowing the geometry of each test to be checked. It was
7. Figure 8. This image shows the two detection paddles above and below the 3 sets of fibres.
The fibres are connected to the PMT via the alignment block and the end of the delay cables
can be seen. The light proofing tarpaulin has been removed to allow easy viewing.
noted that the fibres at either edge of the PMT were registering significantly less hits (flux), the
detection paddles were adjusted which appeared to resolve this issue.
The top row of fibres was unexpectedly hit far more than the bottom row. The fibres
alignment was interchanged to determine if the issue was PMT or fibre related. The same issue
continued to be observed so the fibres were returned to their original position and the connection
to the PMT via the silicon pad was scrutinized. Ensuring maximal PMT-fibre contact increased
the overall flux however the positional changes gave no indication of resolving the flux deficiency
in the bottom row.
Speculation was made that the light proofing tubing may be adding inconsistencies in the
fibre spacing. The tubing was removed and the fibres realigned so that there was minimal
crossover or gaps. This adjustment improved the expected uniformity of results significantly.
It was clear to identify that one of the pixels was not operating correctly as it consistently
registered a significantly higher number of hits. Rotation of the PMT and fibres proved that
channel 50 within the data acquisition system was in fact faulty.
Whilst convincing optimisation developments had been made, a quantifiable trend between
top and bottom fibres was made. Due to the consistent relationship it was hypothesised that
the fibres may not solely be in contact with one pixel. To test this theory the bottom row of
fibres was shifted down one row, to guarantee that fibres were not sharing pixels. This effort
had positive effects and finally resulted in a completely even distribution of flux, as would be
expected for such high stats measurements.
3.1.2. Crosstalk Crosstalk is an issue experienced within the Hamamatsu H8500 PMT, this
is when a high signal is received in a single pixel it often registers in neighboring pixels also.
This effect was regularly observed when using the strontium source, as this stimulates a greater
amount of scintillation within the fibre and hence a greater charge in the PMT. As you can see in
8. the right plot of Figure 9, the pixels illuminated correspond to the fibre positions. However in the
left plot of Figure 9, many pixels are illuminated that do not correspond to a fibre position; this
is crosstalk. Unfortunately there were no positive steps made in reducing crosstalk contributing
an obvious error in efficiency values, however as it was expected to stay the same prior to and
post irradiation, the final result impact was minimal.
Muon data was found to be far more consistent than the strontium, with minimal crosstalk.
Whilst using the strontium source offered a more frequent high stats measurement, useful
for annealing observations, muon measurements offered a much greater accuracy. Figure 9
demonstrates this comparison.
Figure 9. The pixel map on the left was produced with the strontium source and displays a
high level of crosstalk. Contrastingly the image on the right shows a low level of crosstalk, this
was produced with muon stimulus. The positions of the fibres is much more clearly defined with
the muon measurements.
The muon investigation in this report was run in conjunction with the detailed studies of the
strontium source, and any further results from strontium stimulated scintillation are discussed
in the report by S. Currie [5].
It was decided that three sets of fibres would be subjected to various levels of radiation and
both scintillation stimulus would be used. Sellafield ltd. provided the information that close
contact with a nuclear waste barrel equates to roughly 1 Gray/Day. For a sense of scale the
fibres were irradiated with 1, 7 and 30 Grays, to resemble a day, week and month’s worth of
radiation. Several high-statistical measurements were taken with the optimised set-up for both
scintillation sources and the average charge values were measured and compared with results
from pre-radiation studies that were normalised to ‘100%’.
The fibres were irradiated with a dose rate of 1.5788 Gray/min, within the DCF radiation
chamber as seen in Figure 10. The exact doses are displayed in Table 1.
Following exposure the fibres had no visual changes to light output or colour and were
monitored using both sources for any radiation damage for several days on return to Glasgow.
9. Table 1. Fibre Doses
Fibre Irradiation Period(s) Dose(Gy)
Day 40 1.05
Week 280 7.37
Month 1200 31.58
Figure 10. A set of fibres within the Cobalt-60 radiation chamber
4. Results
The scintillating fibres were undoubtedly damaged by the radiation, as can be seen from Figure
11. Interestingly there was no correlation between time irradiated and percentage drop, nor was
the annealing process observed. M. YU [6] explains that the annealing process largely occurs
within the first few hours after irradiation. Practicalities of monitoring any annealing processes
are an issue, as high statistical muon measurements take days. The fibre exposed to 30Gy
actually had the least noted efficiency drop of 14.7%, whilst the 1 and 7 Gray fibres dropped
25.1% and 25.3% respectively.
As detailed in Figure 3 the outer 3-5% of the scintillating fibre is a hydrocarbon optical
cladding, designed to aid total internal reflection. It is reasonable to assume that this layer
would be degraded to a greater extent than the scintillating core and that this would give a
uniform efficiency drop, regardless of dosage.
Using Snell’s Law (Equation 2), it is possible to calculate the amount of light lost if all of the
optical cladding was removed:
sin−1 1.00
1.6
= 38.68 (4)
By comparing critical angles (Equation 3 and 4) it is shown that a fibre with no cladding would
exhibit a 44% drop in the light retained, assuming light is travelling in all directions with an
equal magnitude.
10. Figure 11. The efficiency of scintillating fibres is measured prior and post radiation. The error
is calculated from the deviation prior to radiation is approximately 10%. This error implies that
the fibres had a uniform efficiency loss of 22%. The red, green and blue colours correspond to
the ‘day’, ‘week’ and ‘month’ sets of fibres, respectively.
To investigate this argument a single set of the irradiated fibres were coated in several layers
of EJ-510 reflective paint [7], in hope that this may restore some of the damage by aiding internal
reflection. The paint has refractive index ∼1.5, so was deemed to be an effective substitute for
the optical cladding with refactive index 1.49. The geometrical set up can be seen in Figure 12.
Figure 12. Side on and vertical views of the painted fibre set up are shown to demonstrate the
proximity of said fibres. The light proofing tarpaulin has been removed for visual purposes.
Table 2 details the efficiency change following the application of reflective paint to the 1 Gray
11. irradiated fibres. All three sets of fibres were placed in original positions and the following effects
were observed.
Table 2. Fibre Doses
Fibre Radiation Damaged Efficiency Paint Test Efficiency Efficiency ‘Repair’
Day(Painted) 74.8% 94.3% 19.5%
Week(Unpainted) 74.6% 94.5% 20.1%
Month(Unpainted) 85.3% 81.6% −3.7%
Whilst the paint appeared to restore much of the damage to the painted set of fibres it had
an unexpected effect on the unpainted fibres. This observation was made again, with as many
repetitions that time allowed. It is possible that the reflective paint affected the ‘week fibres’ due
to their geometrical position. There is less than 1cm separating the sets of fibres. If the optical
cladding had been damaged, the extra light lost may have reflected from the above painted fibres
and re-entered the ‘week fibres’. This is illustrated in Figure 13.
Figure 13. Here is a diagram of light escaping the ‘week fibres’ as a result of radiation damaged
cladding. The lost light is then reflected from the painted ‘day fibres’ and returns to the week
fibre.
5. Conclusion
In summary of these results; BCF-12 2mm-pitch plastic scintillating fibres length attenuation
is proven to be consistent with C. Zorn’s [2] findings. A reliable and reproducible experimental
test set-up was constructed. A normalised charge maximum was found for the fibres before then
being radiated to industry standards and a ∼22% efficiency drop was observed across all fibres.
This evidence suggests that the thin optical cladding has deteriorated.
Further study was made into the recovery of this loss, by applying reflective paint of similar
refractive index, with very positive effects. Both the ‘day’ (painted) and the ‘week’ (unpainted)
showed a 20% improvement. The ‘month’(unpainted) fibres exhibited a 3.7% loss, however this
is well within the accepted error of 10%.
This investigation made extremely positive steps toward understanding the effect a nuclear
waste barrel would have on scintillating fibres within a muon tomograph and possible ‘repair’
solutions. Future studies are to be performed by the Glasgow Nuclear Physics Muon project
based on these initial results.
12. Acknowledgments
This investigation was carried out in coordination with Sam Currie. Thanks must be given Dr.
David Mahon and Dr. Seian Jebali for continuous support and enthusiasm during supervision.
References
[1] A. Clarkson et al., “Characterising Encapsulated Nuclear Waste using Cosmic-ray Muon Tomography”, JINST
10 (2015) PO3020
[2] C. Zorn, “A Pedestrian Guide To Radiation Damages in Plastic Scintillators”, Radiat. Phys. Chem. 41 (1993),
37-43
[3] Saint-Gobain Crystals, Organic Scintillation Materials Data Sheet (Updated 2015)
[4] T. Hakamata, Photomultiplier Tubes Basics and Applications (3rd Edition), (2006)
[5] S. Currie, 4th
Year Project, University of Glasgow (2015)
[6] M. Yu et al., “Radiation Damage in Plastic Scintillators and Optical Fibres”, Nucl. Instrum. Meth. B 95
(1995), 496
[7] ELJEN Technology, EJ-510 Reflective Paint for Plastic and Crystal Scintillators.
![barrels [1]. Nuclear waste contains heavy nuclei that scatters muons through large angles and
allows imaging. The prototype machine has 8 detection layers, comprising of 128 scintillating
fibres each. These fibres are fed into a 64 pixel PMT (2 fibres per pixel). As a muon passes
through a scintillating fibre it creates light, this light is converted in the PMT to a charge signal
which can be detected and then tracked back to a position. These positions when combined give
a trajectory for before and after. From these trajectories the deviation is calculated, and after
thousands of detections an image is produced. The imaging technique is detailed in [1].
An industry tomograph would be subject to a certain amount of radiation whilst imaging
a barrel. It is important that the components of the tomograph have a low susceptibility to
radiation damage, and any damage can be calculated and accounted for.
This project aims to detail the severity of the radiation damage, exposing Saint-Gobain BCF-
12 2mm-pitch plastic scintillating fibres to a range of doses, similar to the tomograph would
experience in industry. It was hypothesized that the scintillating fibres would be susceptible to
radiation damage although may exhibit some annealing [2] properties. A barrel radiates a dose
of roughly 1Gray/Day according to estimates from industry.
The Dalton Cumbria Facility (DCF) is home to a cobalt60 irradiator (Figure 2), that can
simulate industry conditions. Several investigations were made into producing an eligible test
set up that could then be subjected to radiation, within the small restricted dimensions of their
radiation chamber.
Figure 2. Cobalt-60 Radiation Chamber at the Dalton Cumbria Facility
2. Background Theory
2.1. Cosmic-Ray Muons
Muons are negatively charged elementary particles that are observed at sea level with a flux
of 1 per cm2 per minute, due to cosmic ray interactions within the planets atmosphere. They
are produced in weak interactions, caused by highly energetic circumstances. Atomic nuclei in
the Earth’s upper atmosphere collide with cosmic-ray protons producing short-lived pions which
favourably decay into muons. Muons have a mean lifetime of 2.2µs, charge of ±1e and a mass
of 105.7MeV/c2.](data:image/gif;base64,R0lGODlhAQABAIAAAAAAAP///yH5BAEAAAAALAAAAAABAAEAAAIBRAA7)