SlideShare una empresa de Scribd logo
1 de 13
Descargar para leer sin conexión
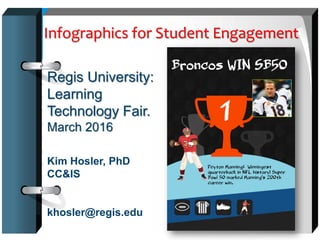
Infographics for Student Engagement
Regis University:
Learning
Technology Fair.
March 2016
Kim Hosler, PhD
CC&IS
khosler@regis.edu
What’s an infographic? Visual presentations of
information that use the elements of design to
display content. They convey a self-contained
message or principle or bite size chunk of
info.
Why use infographics?
– To communicate a message.
– To present large amounts of information.
– To reveal the data in new ways
– To visualize what’s happening.
– As a form of creative assessment.
– To engage.
• Address 21st century skills
• Common Core standards
• Compelling, attractive
• Easily scanned & viewed
• Show processes, relationships, compare & contrast,
timelines, statistical information, key ideas/information
Image from http://images.fastcompany.com/upload/Creative-Process-
Infographic-Large.jpeg
“… the goal of information
visualization is not simply to
represent millions of bits of data as
illustrations. It is to prompt visceral
comprehension, moments of
insight that make viewers want to
learn more” (Singer, 2011).
Infographic source =
http://elearninginfographics.com/adult-learning-
theory-andragogy-infographic/
How are infographics
engaging?
Found infographics:
Education vs Income Level
http://www.varsitytutors.com/blog/education+vs+income+level+in+the+usa+infogr
aphic
Battles of Civil War http://www.civilwar.org/resources/battles-of-
the-civil-war-infographic.html?referrer=https://www.google.com/
Innovative Civil Engineers and their Buildings
http://visual.ly/five-unforgettable-civil-engineers
The DIY Guide To Infographics
http://www.marketingpilgrim.com/2011/07/the-dyi-guide-to-infographics-
infographic.html
The 2020 Census http://www.census.gov/library/infographics/critical-
path.html
STEM Education http://www.edutopia.org/stw-college-career-stem-
infographic
Students can
... deconstruct found infographics.
… locate two different visualizations presenting
data about same population, investigate
comparisons, research contradictions.
… annotate infographics.
… create original infographics (excellent format for
them to synthesize complex concepts and
data).
… translate non-visual resources (narratives and
text-based data) into original infographics to
evidence comprehension and analysis.
Create your bio as an infographic!
https://magic.piktochart.com/output/7086811-drhope4tech
Create your syllabus as an infographic
https://magic.piktochart.com/output/2570368-syllabus-wr-13300
1. Present learning objectives or course assignments
as infographic.
2. Revisit presentations. Is there content in any of your
slides you could make into an engaging infographic?
3. What ideas, timelines, processes do you want to
teach/communicate?
4. Create an infographic to illustrate & more clearly
explain instructions
5. Can you present a concept from your course as a
visual metaphor?
Start small & simple.
Clearly state what infographic is about. (think
thesis or purpose statement, most important stats or data)
Use free templates; swap out text for
starters.
Play with available icons & images.
Source your infographic. (see
http://blog.visual.ly/source-code-the-5-rules-of-researching-and-
sourcing-infographics/)
Stick with most important stats/data/info &
content.
Venngage simple and easy to use.
https://venngage.com/
Easel.ly dozen free templates to start you off,
which are easily customizable. http://www.easel.ly/
Piktochart easy-to-use editor, lots of good free
templates to get started. http://piktochart.com/
Canva You can create posters, flyers, slides,
infographics & more https://www.canva.com/
Singer, N. (2011). When data struts its stuff. New York Times.
Retrieved from:
http://www.nytimes.com/2011/04/03/business/03stream.html?_r=0
Trowler, V. (2010). Student engagement literature review. Retrieved
from:https://www.heacademy.ac.uk/sites/default/files/studentengage
mentliteraturereview_1.pdf
=================================================
Blooms taxonomy as Infographic http://elearninginfographics.com/6-
levels-of-blooms-taxonomy-infographic/
Kathy Schrock (assessment)
http://www.schrockguide.net/infographics-as-an-assessment.html
Tons of examples here -
http://elearninginfographics.com/category/educational-technology-
infographics/
Katherine Schulten. Teaching w/Infographics (2010)
http://learning.blogs.nytimes.com/2010/08/23/teaching-with-
infographics-places-to-start/?_r=0
References & Resources
New York Times Learning Network (2011). Data Visualized:
More on Teaching with Infographics.
http://learning.blogs.nytimes.com/2011/04/08/data-visualized-
more-on-teaching-with-infographics/?_r=1
Educause (2013). 7 Things you should know about infographic
creation tools.
http://www.educause.edu/library/resources/7-things-you-should-
know-about-infographic-creation-tools
How to Create Powerful Infographics
http://www.contrastcreative.com/design/how-to-create-powerful-
infographics/
Nathan Bellato (2013) Infographics: A Visual Link to Learning
http://elearnmag.acm.org/featured.cfm?aid=2556269
Resources:

Más contenido relacionado

Destacado

Alta del autónomo
Alta del autónomoAlta del autónomo
Alta del autónomotugesto
 
Coworking
CoworkingCoworking
Coworkingtugesto
 
Escritos recursos de casación
Escritos recursos de casaciónEscritos recursos de casación
Escritos recursos de casacióntugesto
 
Consejos para alcanzar el éxito
Consejos para alcanzar el éxitoConsejos para alcanzar el éxito
Consejos para alcanzar el éxitotugesto
 
Cambio convenio colectivo
Cambio convenio colectivoCambio convenio colectivo
Cambio convenio colectivotugesto
 
11 big strategy ideas
11 big strategy ideas11 big strategy ideas
11 big strategy ideasCPA Australia
 
10 Best Practices of a Best Company to Work For
10 Best Practices of a Best Company to Work For10 Best Practices of a Best Company to Work For
10 Best Practices of a Best Company to Work ForO.C. Tanner
 

Destacado (7)

Alta del autónomo
Alta del autónomoAlta del autónomo
Alta del autónomo
 
Coworking
CoworkingCoworking
Coworking
 
Escritos recursos de casación
Escritos recursos de casaciónEscritos recursos de casación
Escritos recursos de casación
 
Consejos para alcanzar el éxito
Consejos para alcanzar el éxitoConsejos para alcanzar el éxito
Consejos para alcanzar el éxito
 
Cambio convenio colectivo
Cambio convenio colectivoCambio convenio colectivo
Cambio convenio colectivo
 
11 big strategy ideas
11 big strategy ideas11 big strategy ideas
11 big strategy ideas
 
10 Best Practices of a Best Company to Work For
10 Best Practices of a Best Company to Work For10 Best Practices of a Best Company to Work For
10 Best Practices of a Best Company to Work For
 

Similar a Regis university learning technology fair kim hosler_ infographics for student engagement

infographicsasteachingtoolsppt-140518191756-phpapp01.pptx
infographicsasteachingtoolsppt-140518191756-phpapp01.pptxinfographicsasteachingtoolsppt-140518191756-phpapp01.pptx
infographicsasteachingtoolsppt-140518191756-phpapp01.pptxRolandMaya4
 
Teaching infographics as a technical communication trend slides revised
Teaching infographics as a technical communication trend slides revisedTeaching infographics as a technical communication trend slides revised
Teaching infographics as a technical communication trend slides revisedmdidier27
 
Infographics - NCDA CPI Cleveland 2019 & Charlotte 2020
Infographics - NCDA CPI Cleveland 2019 & Charlotte 2020Infographics - NCDA CPI Cleveland 2019 & Charlotte 2020
Infographics - NCDA CPI Cleveland 2019 & Charlotte 2020Melissa A. Venable
 
Infographics_101_Training_June_2019_1-min_1.pdf
Infographics_101_Training_June_2019_1-min_1.pdfInfographics_101_Training_June_2019_1-min_1.pdf
Infographics_101_Training_June_2019_1-min_1.pdfStitpragyaTechnologi
 
Starkey byod eye_catching_infographics_for_advocacy
Starkey byod eye_catching_infographics_for_advocacyStarkey byod eye_catching_infographics_for_advocacy
Starkey byod eye_catching_infographics_for_advocacyCarolyn Jo Starkey
 
Customer Webinar: Interactive Infographics 101
Customer Webinar: Interactive Infographics 101Customer Webinar: Interactive Infographics 101
Customer Webinar: Interactive Infographics 101ion interactive
 
A Decision Support System for Inbound Marketers: An Empirical Use of Latent D...
A Decision Support System for Inbound Marketers: An Empirical Use of Latent D...A Decision Support System for Inbound Marketers: An Empirical Use of Latent D...
A Decision Support System for Inbound Marketers: An Empirical Use of Latent D...Meisam Hejazi Nia
 
Editable Certificate and Transcript Design_ Enhancing Your Brand’s Profession...
Editable Certificate and Transcript Design_ Enhancing Your Brand’s Profession...Editable Certificate and Transcript Design_ Enhancing Your Brand’s Profession...
Editable Certificate and Transcript Design_ Enhancing Your Brand’s Profession...aminulislam661165
 
Infographics in Education: Visualizing Information
Infographics in Education: Visualizing Information Infographics in Education: Visualizing Information
Infographics in Education: Visualizing Information Seth Allen
 
Separating Myth from Truth in Data Visualisation
Separating Myth from Truth in Data VisualisationSeparating Myth from Truth in Data Visualisation
Separating Myth from Truth in Data VisualisationAndy Kirk
 
Infographics as teaching tools ppt
Infographics as teaching tools pptInfographics as teaching tools ppt
Infographics as teaching tools pptknespoli
 
Infographics and I.C.T Project
Infographics and I.C.T ProjectInfographics and I.C.T Project
Infographics and I.C.T ProjectDennis Morales
 
Visual and interactive storytelling slides cmg 2015-final
Visual and interactive storytelling slides    cmg 2015-finalVisual and interactive storytelling slides    cmg 2015-final
Visual and interactive storytelling slides cmg 2015-finalKatherine-CWACanada
 
Storyboarding for Data Visualization
Storyboarding for Data VisualizationStoryboarding for Data Visualization
Storyboarding for Data VisualizationAmanda Makulec
 
Creating an infographic
Creating an infographicCreating an infographic
Creating an infographicadamzurn
 
How-To Guide -Infographics
How-To Guide -InfographicsHow-To Guide -Infographics
How-To Guide -InfographicsDemand Metric
 
Infographics assignment
Infographics assignmentInfographics assignment
Infographics assignmentKaren Freberg
 

Similar a Regis university learning technology fair kim hosler_ infographics for student engagement (20)

Infographics teachingtool
Infographics teachingtoolInfographics teachingtool
Infographics teachingtool
 
infographicsasteachingtoolsppt-140518191756-phpapp01.pptx
infographicsasteachingtoolsppt-140518191756-phpapp01.pptxinfographicsasteachingtoolsppt-140518191756-phpapp01.pptx
infographicsasteachingtoolsppt-140518191756-phpapp01.pptx
 
Teaching infographics as a technical communication trend slides revised
Teaching infographics as a technical communication trend slides revisedTeaching infographics as a technical communication trend slides revised
Teaching infographics as a technical communication trend slides revised
 
Infographics - NCDA CPI Cleveland 2019 & Charlotte 2020
Infographics - NCDA CPI Cleveland 2019 & Charlotte 2020Infographics - NCDA CPI Cleveland 2019 & Charlotte 2020
Infographics - NCDA CPI Cleveland 2019 & Charlotte 2020
 
Infographics_101_Training_June_2019_1-min_1.pdf
Infographics_101_Training_June_2019_1-min_1.pdfInfographics_101_Training_June_2019_1-min_1.pdf
Infographics_101_Training_June_2019_1-min_1.pdf
 
Starkey byod eye_catching_infographics_for_advocacy
Starkey byod eye_catching_infographics_for_advocacyStarkey byod eye_catching_infographics_for_advocacy
Starkey byod eye_catching_infographics_for_advocacy
 
Customer Webinar: Interactive Infographics 101
Customer Webinar: Interactive Infographics 101Customer Webinar: Interactive Infographics 101
Customer Webinar: Interactive Infographics 101
 
A Decision Support System for Inbound Marketers: An Empirical Use of Latent D...
A Decision Support System for Inbound Marketers: An Empirical Use of Latent D...A Decision Support System for Inbound Marketers: An Empirical Use of Latent D...
A Decision Support System for Inbound Marketers: An Empirical Use of Latent D...
 
Editable Certificate and Transcript Design_ Enhancing Your Brand’s Profession...
Editable Certificate and Transcript Design_ Enhancing Your Brand’s Profession...Editable Certificate and Transcript Design_ Enhancing Your Brand’s Profession...
Editable Certificate and Transcript Design_ Enhancing Your Brand’s Profession...
 
Infographics in Education: Visualizing Information
Infographics in Education: Visualizing Information Infographics in Education: Visualizing Information
Infographics in Education: Visualizing Information
 
Separating Myth from Truth in Data Visualisation
Separating Myth from Truth in Data VisualisationSeparating Myth from Truth in Data Visualisation
Separating Myth from Truth in Data Visualisation
 
Infographics as teaching tools ppt
Infographics as teaching tools pptInfographics as teaching tools ppt
Infographics as teaching tools ppt
 
Hello Data!
Hello Data!Hello Data!
Hello Data!
 
Infographic by A'PaePae
Infographic by A'PaePaeInfographic by A'PaePae
Infographic by A'PaePae
 
Infographics and I.C.T Project
Infographics and I.C.T ProjectInfographics and I.C.T Project
Infographics and I.C.T Project
 
Visual and interactive storytelling slides cmg 2015-final
Visual and interactive storytelling slides    cmg 2015-finalVisual and interactive storytelling slides    cmg 2015-final
Visual and interactive storytelling slides cmg 2015-final
 
Storyboarding for Data Visualization
Storyboarding for Data VisualizationStoryboarding for Data Visualization
Storyboarding for Data Visualization
 
Creating an infographic
Creating an infographicCreating an infographic
Creating an infographic
 
How-To Guide -Infographics
How-To Guide -InfographicsHow-To Guide -Infographics
How-To Guide -Infographics
 
Infographics assignment
Infographics assignmentInfographics assignment
Infographics assignment
 

Último

Python Notes for mca i year students osmania university.docx
Python Notes for mca i year students osmania university.docxPython Notes for mca i year students osmania university.docx
Python Notes for mca i year students osmania university.docxRamakrishna Reddy Bijjam
 
PROCESS RECORDING FORMAT.docx
PROCESS      RECORDING        FORMAT.docxPROCESS      RECORDING        FORMAT.docx
PROCESS RECORDING FORMAT.docxPoojaSen20
 
Food safety_Challenges food safety laboratories_.pdf
Food safety_Challenges food safety laboratories_.pdfFood safety_Challenges food safety laboratories_.pdf
Food safety_Challenges food safety laboratories_.pdfSherif Taha
 
Activity 01 - Artificial Culture (1).pdf
Activity 01 - Artificial Culture (1).pdfActivity 01 - Artificial Culture (1).pdf
Activity 01 - Artificial Culture (1).pdfciinovamais
 
On National Teacher Day, meet the 2024-25 Kenan Fellows
On National Teacher Day, meet the 2024-25 Kenan FellowsOn National Teacher Day, meet the 2024-25 Kenan Fellows
On National Teacher Day, meet the 2024-25 Kenan FellowsMebane Rash
 
ICT Role in 21st Century Education & its Challenges.pptx
ICT Role in 21st Century Education & its Challenges.pptxICT Role in 21st Century Education & its Challenges.pptx
ICT Role in 21st Century Education & its Challenges.pptxAreebaZafar22
 
ICT role in 21st century education and it's challenges.
ICT role in 21st century education and it's challenges.ICT role in 21st century education and it's challenges.
ICT role in 21st century education and it's challenges.MaryamAhmad92
 
Application orientated numerical on hev.ppt
Application orientated numerical on hev.pptApplication orientated numerical on hev.ppt
Application orientated numerical on hev.pptRamjanShidvankar
 
Introduction to Nonprofit Accounting: The Basics
Introduction to Nonprofit Accounting: The BasicsIntroduction to Nonprofit Accounting: The Basics
Introduction to Nonprofit Accounting: The BasicsTechSoup
 
SOC 101 Demonstration of Learning Presentation
SOC 101 Demonstration of Learning PresentationSOC 101 Demonstration of Learning Presentation
SOC 101 Demonstration of Learning Presentationcamerronhm
 
Micro-Scholarship, What it is, How can it help me.pdf
Micro-Scholarship, What it is, How can it help me.pdfMicro-Scholarship, What it is, How can it help me.pdf
Micro-Scholarship, What it is, How can it help me.pdfPoh-Sun Goh
 
SKILL OF INTRODUCING THE LESSON MICRO SKILLS.pptx
SKILL OF INTRODUCING THE LESSON MICRO SKILLS.pptxSKILL OF INTRODUCING THE LESSON MICRO SKILLS.pptx
SKILL OF INTRODUCING THE LESSON MICRO SKILLS.pptxAmanpreet Kaur
 
Holdier Curriculum Vitae (April 2024).pdf
Holdier Curriculum Vitae (April 2024).pdfHoldier Curriculum Vitae (April 2024).pdf
Holdier Curriculum Vitae (April 2024).pdfagholdier
 
General Principles of Intellectual Property: Concepts of Intellectual Proper...
General Principles of Intellectual Property: Concepts of Intellectual  Proper...General Principles of Intellectual Property: Concepts of Intellectual  Proper...
General Principles of Intellectual Property: Concepts of Intellectual Proper...Poonam Aher Patil
 
Grant Readiness 101 TechSoup and Remy Consulting
Grant Readiness 101 TechSoup and Remy ConsultingGrant Readiness 101 TechSoup and Remy Consulting
Grant Readiness 101 TechSoup and Remy ConsultingTechSoup
 
Basic Civil Engineering first year Notes- Chapter 4 Building.pptx
Basic Civil Engineering first year Notes- Chapter 4 Building.pptxBasic Civil Engineering first year Notes- Chapter 4 Building.pptx
Basic Civil Engineering first year Notes- Chapter 4 Building.pptxDenish Jangid
 
Dyslexia AI Workshop for Slideshare.pptx
Dyslexia AI Workshop for Slideshare.pptxDyslexia AI Workshop for Slideshare.pptx
Dyslexia AI Workshop for Slideshare.pptxcallscotland1987
 
2024-NATIONAL-LEARNING-CAMP-AND-OTHER.pptx
2024-NATIONAL-LEARNING-CAMP-AND-OTHER.pptx2024-NATIONAL-LEARNING-CAMP-AND-OTHER.pptx
2024-NATIONAL-LEARNING-CAMP-AND-OTHER.pptxMaritesTamaniVerdade
 

Último (20)

Python Notes for mca i year students osmania university.docx
Python Notes for mca i year students osmania university.docxPython Notes for mca i year students osmania university.docx
Python Notes for mca i year students osmania university.docx
 
Spatium Project Simulation student brief
Spatium Project Simulation student briefSpatium Project Simulation student brief
Spatium Project Simulation student brief
 
PROCESS RECORDING FORMAT.docx
PROCESS      RECORDING        FORMAT.docxPROCESS      RECORDING        FORMAT.docx
PROCESS RECORDING FORMAT.docx
 
Food safety_Challenges food safety laboratories_.pdf
Food safety_Challenges food safety laboratories_.pdfFood safety_Challenges food safety laboratories_.pdf
Food safety_Challenges food safety laboratories_.pdf
 
Activity 01 - Artificial Culture (1).pdf
Activity 01 - Artificial Culture (1).pdfActivity 01 - Artificial Culture (1).pdf
Activity 01 - Artificial Culture (1).pdf
 
On National Teacher Day, meet the 2024-25 Kenan Fellows
On National Teacher Day, meet the 2024-25 Kenan FellowsOn National Teacher Day, meet the 2024-25 Kenan Fellows
On National Teacher Day, meet the 2024-25 Kenan Fellows
 
ICT Role in 21st Century Education & its Challenges.pptx
ICT Role in 21st Century Education & its Challenges.pptxICT Role in 21st Century Education & its Challenges.pptx
ICT Role in 21st Century Education & its Challenges.pptx
 
ICT role in 21st century education and it's challenges.
ICT role in 21st century education and it's challenges.ICT role in 21st century education and it's challenges.
ICT role in 21st century education and it's challenges.
 
Application orientated numerical on hev.ppt
Application orientated numerical on hev.pptApplication orientated numerical on hev.ppt
Application orientated numerical on hev.ppt
 
Introduction to Nonprofit Accounting: The Basics
Introduction to Nonprofit Accounting: The BasicsIntroduction to Nonprofit Accounting: The Basics
Introduction to Nonprofit Accounting: The Basics
 
SOC 101 Demonstration of Learning Presentation
SOC 101 Demonstration of Learning PresentationSOC 101 Demonstration of Learning Presentation
SOC 101 Demonstration of Learning Presentation
 
Micro-Scholarship, What it is, How can it help me.pdf
Micro-Scholarship, What it is, How can it help me.pdfMicro-Scholarship, What it is, How can it help me.pdf
Micro-Scholarship, What it is, How can it help me.pdf
 
SKILL OF INTRODUCING THE LESSON MICRO SKILLS.pptx
SKILL OF INTRODUCING THE LESSON MICRO SKILLS.pptxSKILL OF INTRODUCING THE LESSON MICRO SKILLS.pptx
SKILL OF INTRODUCING THE LESSON MICRO SKILLS.pptx
 
Holdier Curriculum Vitae (April 2024).pdf
Holdier Curriculum Vitae (April 2024).pdfHoldier Curriculum Vitae (April 2024).pdf
Holdier Curriculum Vitae (April 2024).pdf
 
General Principles of Intellectual Property: Concepts of Intellectual Proper...
General Principles of Intellectual Property: Concepts of Intellectual  Proper...General Principles of Intellectual Property: Concepts of Intellectual  Proper...
General Principles of Intellectual Property: Concepts of Intellectual Proper...
 
Mehran University Newsletter Vol-X, Issue-I, 2024
Mehran University Newsletter Vol-X, Issue-I, 2024Mehran University Newsletter Vol-X, Issue-I, 2024
Mehran University Newsletter Vol-X, Issue-I, 2024
 
Grant Readiness 101 TechSoup and Remy Consulting
Grant Readiness 101 TechSoup and Remy ConsultingGrant Readiness 101 TechSoup and Remy Consulting
Grant Readiness 101 TechSoup and Remy Consulting
 
Basic Civil Engineering first year Notes- Chapter 4 Building.pptx
Basic Civil Engineering first year Notes- Chapter 4 Building.pptxBasic Civil Engineering first year Notes- Chapter 4 Building.pptx
Basic Civil Engineering first year Notes- Chapter 4 Building.pptx
 
Dyslexia AI Workshop for Slideshare.pptx
Dyslexia AI Workshop for Slideshare.pptxDyslexia AI Workshop for Slideshare.pptx
Dyslexia AI Workshop for Slideshare.pptx
 
2024-NATIONAL-LEARNING-CAMP-AND-OTHER.pptx
2024-NATIONAL-LEARNING-CAMP-AND-OTHER.pptx2024-NATIONAL-LEARNING-CAMP-AND-OTHER.pptx
2024-NATIONAL-LEARNING-CAMP-AND-OTHER.pptx
 

Regis university learning technology fair kim hosler_ infographics for student engagement

  • 1. Infographics for Student Engagement Regis University: Learning Technology Fair. March 2016 Kim Hosler, PhD CC&IS khosler@regis.edu
  • 2. What’s an infographic? Visual presentations of information that use the elements of design to display content. They convey a self-contained message or principle or bite size chunk of info. Why use infographics? – To communicate a message. – To present large amounts of information. – To reveal the data in new ways – To visualize what’s happening. – As a form of creative assessment. – To engage.
  • 3. • Address 21st century skills • Common Core standards • Compelling, attractive • Easily scanned & viewed • Show processes, relationships, compare & contrast, timelines, statistical information, key ideas/information Image from http://images.fastcompany.com/upload/Creative-Process- Infographic-Large.jpeg
  • 4. “… the goal of information visualization is not simply to represent millions of bits of data as illustrations. It is to prompt visceral comprehension, moments of insight that make viewers want to learn more” (Singer, 2011). Infographic source = http://elearninginfographics.com/adult-learning- theory-andragogy-infographic/ How are infographics engaging?
  • 5. Found infographics: Education vs Income Level http://www.varsitytutors.com/blog/education+vs+income+level+in+the+usa+infogr aphic Battles of Civil War http://www.civilwar.org/resources/battles-of- the-civil-war-infographic.html?referrer=https://www.google.com/ Innovative Civil Engineers and their Buildings http://visual.ly/five-unforgettable-civil-engineers The DIY Guide To Infographics http://www.marketingpilgrim.com/2011/07/the-dyi-guide-to-infographics- infographic.html The 2020 Census http://www.census.gov/library/infographics/critical- path.html STEM Education http://www.edutopia.org/stw-college-career-stem- infographic
  • 6. Students can ... deconstruct found infographics. … locate two different visualizations presenting data about same population, investigate comparisons, research contradictions. … annotate infographics. … create original infographics (excellent format for them to synthesize complex concepts and data). … translate non-visual resources (narratives and text-based data) into original infographics to evidence comprehension and analysis.
  • 7. Create your bio as an infographic! https://magic.piktochart.com/output/7086811-drhope4tech Create your syllabus as an infographic https://magic.piktochart.com/output/2570368-syllabus-wr-13300 1. Present learning objectives or course assignments as infographic. 2. Revisit presentations. Is there content in any of your slides you could make into an engaging infographic? 3. What ideas, timelines, processes do you want to teach/communicate? 4. Create an infographic to illustrate & more clearly explain instructions 5. Can you present a concept from your course as a visual metaphor?
  • 8. Start small & simple. Clearly state what infographic is about. (think thesis or purpose statement, most important stats or data) Use free templates; swap out text for starters. Play with available icons & images. Source your infographic. (see http://blog.visual.ly/source-code-the-5-rules-of-researching-and- sourcing-infographics/) Stick with most important stats/data/info & content.
  • 9. Venngage simple and easy to use. https://venngage.com/ Easel.ly dozen free templates to start you off, which are easily customizable. http://www.easel.ly/ Piktochart easy-to-use editor, lots of good free templates to get started. http://piktochart.com/ Canva You can create posters, flyers, slides, infographics & more https://www.canva.com/
  • 10.
  • 11.
  • 12. Singer, N. (2011). When data struts its stuff. New York Times. Retrieved from: http://www.nytimes.com/2011/04/03/business/03stream.html?_r=0 Trowler, V. (2010). Student engagement literature review. Retrieved from:https://www.heacademy.ac.uk/sites/default/files/studentengage mentliteraturereview_1.pdf ================================================= Blooms taxonomy as Infographic http://elearninginfographics.com/6- levels-of-blooms-taxonomy-infographic/ Kathy Schrock (assessment) http://www.schrockguide.net/infographics-as-an-assessment.html Tons of examples here - http://elearninginfographics.com/category/educational-technology- infographics/ Katherine Schulten. Teaching w/Infographics (2010) http://learning.blogs.nytimes.com/2010/08/23/teaching-with- infographics-places-to-start/?_r=0 References & Resources
  • 13. New York Times Learning Network (2011). Data Visualized: More on Teaching with Infographics. http://learning.blogs.nytimes.com/2011/04/08/data-visualized- more-on-teaching-with-infographics/?_r=1 Educause (2013). 7 Things you should know about infographic creation tools. http://www.educause.edu/library/resources/7-things-you-should- know-about-infographic-creation-tools How to Create Powerful Infographics http://www.contrastcreative.com/design/how-to-create-powerful- infographics/ Nathan Bellato (2013) Infographics: A Visual Link to Learning http://elearnmag.acm.org/featured.cfm?aid=2556269 Resources: