SlideShare una empresa de Scribd logo
1 de 43
Descargar para leer sin conexión
Investment research 8 August 2014 
Equities LinkedIn 
Imagine the GROWTH 
United States 
Social Networking Site 
5-years rating BUY Drivers of growth: Talent Solutions and Sales Navigator 
5-years target price US$638.00 Talent Solution is major source of LinkedIn’s revenue. Current 
market penetration rate of 6% reveals untapped market potential, with expansion to the international market, focus on SMB companies and higher evolvement of international corporations. Sales Navigator creates new concept for sales prospective with US$ 4 billion potential addressable market. The acquisition of Bizo improve B2B Marketing Solution revenue stream. Premium Subscriptions will benefit from increased demand among job seekers. Focus on Asian market. 
Price US$208.12 
3 year return history 
Source: FactSet 
Pros: high organic growth, healthy financials, light future 
LinkedIn is the biggest business SNS, with quick growth of member base and innovative product features. LinkedIn’s business model has properly diversified revenue stream. Organic growth is supported by acquisition of companies that create high synergy. 70% annual 
revenue growth during last 3 years will be supported by future growth of 43%. Long-term EPS growth of 40%. The company has no direct competitors as well as debt on BS. 
Risks: increased competition and economic slow-down 
Rapid development of IT sector and increased innovations can create additional competition, as Google or Microsoft can propose alternative products. Deterioration in macroeconomic condition can decrease expectations in Marketing and Talent Solution due to cut of advertising spending and unemployment. Launch of sales Navigator creates additional uncertainty as the market can reject the product. Asian market can result in slow growth due to security and privacy issues. 
Trading data and key matrics 
52 Week Range $136.02 – 257.56 
Market Value (M) $23,218 
Shares Out (M) 122.9 
Float 98.6% 
Avg Daily Vol (3 Mo) 2,227,379.3 
EPS (Linked2Win) (US$) Primary research: Asian and Eastern Europe call 
Linked2Win Cons. Survey, conducted in China, India, Taiwan and Ukraine and 763 
responses, reveals perspectives of LinkedIn. Driven by quick economic development and urbanization Asia and Eastern Europe 
create huge opportunities for member base increase and Talent Solution revenue generation due to high willingness to pay for exclusive services among registered members (75% in China, 21% in India and 14% in Ukraine) and recruiters (13% in India). Majority of 
graduates and young professionals are not registered due to lack of information about SNS. Growth potential - 150 million people. 
Q1 0.38 0.38 
Q2 0.51 0.51 
Q3E 0.46 0.47 
Q4E 0.47 0.52 
12/14E 1.81 1.88 
12/15E 3.63 2.76 
12/16E 5.65 3.98 
Highlights (US$ million) 2012 2013 2014E 2015E 2016E 2017E 2018E 
Revenues 972,309 1,528,545 2,165,459 3,216,616 5,059,516 7,525,115 10,838,681 
Adj. EBITDA 223,030 376,243 560,492 925,925 1,464,271 2,267,648 3,303,858 
EBIT 57,114 49,228 29,980 115,618 188,908 352,656 551,328 
Net Earnings 21,610 26,769 -29,854 75,152 122,790 229,226 358,363 
EPS 0.19 0.23 -0.24 0.60 0.97 1.82 2.84 
Non-GAAP EPS 0.89 1.61 1.81 3.63 5.65 8.79 12.76 
Profitability/valuation 2012 2013 2014E 2015E 2016E 2017E 2018E 
EBIT margin % 5.87% 3.22% 1.38% 3.59% 3.73% 4.69% 5.09% 
P/E ratio 129.00 134.70 128.68 100.00 75.00 60.00 50.00 
PEG 3.50 3.60 3.22 2.78 2.68 2.61 2.50 
P/Sales 12.70 16.90 13.53 14.22 10.55 8.83 7.42 
Source: Company accounts, FactSet, Linked2Win estimations 
Analyst team: Iuliia Budz, Chuan-Chin Cheng, Sankshi Ka, Sangju Lee, Luying Ren 
-­‐50.00 
0.00 
50.00 
100.00 
150.00 
200.00 
08/05/2011 
08/05/2012 
08/05/2013 
08/05/2014 
Cumulative return % 
LNKD 
S&P 
500
1 
I. Industry Analysis 
As a unique corporation, Linkedin has involved in multiple industries. Based on its revenue streams (talent solution, marketing solution, premium subscription), we did research on three main industries that LinkedIn has already played a role in. That is recruitment industry, social network industry, and advertising and marketing industry. On the top of that, we also did research on the industry that LinkedIn is going to step in in this year, which is CRM industry. 
1. The Social Networking Sites Industry 
1.1. Industry overview 
(1) Industry definition 
The Social Networking Sites (SNS) industry is in the growth phase, because customer base increases and more services are conducted online. The main source of revenue of this industry is advertising (which effectiveness is boosted by leveraging significant amount of customer information). 
(2) Industry at the glance 
Exhibit 1 
Life cycle stage 
Growth 
Regulation level 
Light 
Capital intensity 
Medium 
Technology change 
High 
Revenue volatility 
High 
Barriers to entry 
Medium 
Industry assistance 
None 
Industry globalization 
High 
Concentration level 
High 
Competition level 
High 
Source: IBIS SNS industry report 2014 
(3) Key industry players 
The Social Networking Websites industry is dominated by Facebook (68.5% market share), LinkedIn (15.6% market share) and Twitter (12.2% market share). 
(4) Industry environment 
The industry is subject to significant investment and technological changes, where companies continue to innovate and capture emerging fields. The main elements of competition are the size of member and active user base of the network, net features and innovative products and integration with other Internet companies. The key players face growing competition from progressive startups and new products of big companies such as Google and Microsoft.
2 
Exhibit 2 
Positive tendencies 
- time spent on SNS escalates 
- customer base broadens 
- disposable income increases 
- advertising spending grows 
Negative tendencies 
- new companies enter the business 
- costumer’s privacy issues 
Source: IBIS, US SNS Industry, 2014 
(5) Industry statistics 
SNS industry is quickly developing all over the world, with 60% concentration in the United States. The growth is predicted to continue in double-digit numbers in next 5 years. 
The industry revenue was growing at a 36.1% rate during past 5 years and will reach $8.6 billion in 2014. The revenue is projected to grow at a slower average 22.6% rate per year to $23.9 billion in 2019. The future of the industry will be driven by the expansion in Asia and Latin America. 
Exhibit 3 
Source: IBIS, US SNS Industry, 2014 
(6) LinkedIn uniqueness in SNS industry 
Unlike other SNS LinkedIn has more diversified sources of revenue: Premium Subscription, Marketing Solution, Talent Solution and recently developed Sales solution. At the same time the target auditory and services are properly defined. Other SNS generate revenue mainly from advertisement as the only source and do not specify target members. 
0.0% 
10.0% 
20.0% 
30.0% 
40.0% 
50.0% 
60.0% 
70.0% 
80.0% 
90.0% 
100.0% 
0 
5,000 
10,000 
15,000 
20,000 
25,000 
30,000 
2011 
2012 
2013 
2014E 
2015E 
2016E 
2017E 
2018E 
2019E 
Growth % 
Revenue $m 
US SNS Industry 
Revenue ($m) 
Growth rate (%)
3 
1.2. Premium Subscriptions 
(1) LinkedIn as global SNS 
LinkedIn is the biggest professional social network site with 313 million members in more than 200 countries available in 20 languages. The main value for users is the possibility to develop business connections in progressive way as well as take different approach for recruitment. Social networks usually propose to subscribe for free, but LinkedIn offers the option of Premium Subscriptions. This feature makes the business network to be more accessible and at the same time more valuable. 
(2) Premium subscriptions TAM 
The targeted market of LinkedIn can be characterized by 1) Total Addressable market of 3 billion people worldwide in long-term prospective, 2) The Segmented Addressable Market of 600 million of knowledge workers around the world (this number is expected to increase till 1 billion in the next 5 years), 3) The share of market is about 0.5-1% 
Member base increases over time, but the unique member base is quite lower than the total amount of members. The task of LinkedIn is to engage higher percentage of registered members to become unique users. We project the 10% future annual growth in amount of users and 17% annual growth in amount of active users in the next 5 years. The expected number of users in 2018 is 609 million of people. The main driver of the increase is the possibility to operate in Chinese market, increasing urbanization and the higher involvement of actual users by adding new features in the platform. 
Apart from the member base growth the monetization of users plays an important role for revenue generation. Revenue per members shows growth during each quarter and one member produced $5.52 of revenue in 2013, revenue per unique visitor reached $13.5 and revenue per 100 views fluctuates more significantly than other variables with $1.91 per 100 views. The monetization of users shows an increasing tendency. 
Source: IBIS, US SNS Industry, 2014 
- 
0.50 
1.00 
1.50 
2.00 
2.50 
3.00 
3.50 
4.00 
Q12012 
Q22012 
Q32012 
Q42012 
Q12013 
Q22013 
Q32013 
Q42013 
Q12014 
Q22014 
$ 
Revenue variables 
Rev/ 100 views 
Rev/ member 
Rev/ unique 
161 
313 
609 
50 
84 
185 
500 
600 
1000 
0 
200 
400 
600 
800 
1000 
Million people 
Memberbase increase 
Members 
Unique visiting members 
Knowledge worker (SAR)
4 
(3) Premium subscribers 
Premium subscription revenue increased 60% in 2013 and is expected to increase more than 40% in 2014. There are two main factors that drives this: 1) increase in the number of subscribers and 2) switch of actual users to the more expensive subscription plans. The number of subscribers increased at list 340,000 since 2012 and is estimated to be between approximately 0.88 million people (0.7-1.1mln people). This number represents 0.27% of total users and 1% of unique users. The average amount paid is approximately $40 ($30-$50). 
Exhibit 5 
Source: LinkedIn, Linked2Win, 2014 
(4) Key drivers 
The subscription model of revenue generation is usually very stable. LinkedIn Premium Subscription revenue is projected to increase in next 5 years due to many factors: 1) global economy growth and increased spending capacity, 2) member base growth (with focus on developing markets), 3) increasing amount of unique members that wish to buy premium subscription, mainly job seekers, 3) rising amount of business people that want to improve their network in LinkedIn due to huge database, 4) the convenience of LinkedIn mobile application, 5) growing amount of annual subscriptions for business. 
(5) Revenue projections 
Amount of subscribers grew more than 50% during past few years. In 2015 Sales Solution will be considered separately that’s why we assume that the amount of subscribers will increase only 20% in 2015 and will increase significantly in 2016 due to increase in Chinese market and more graduates willing to find a work with the help of LinkedIn. The average price is estimated to be $40 and will decrease till $36 due to higher share of job seekers in premium subscriptions. The long-term growth will be on the level of 25-30% annually. 
0.00 
0.50 
1.00 
1.50 
2.00 
20 
24 
30 
40 
48 
60 
70 
75 
Job seaker 
Business 
Business+ 
Executive 
Premium subscribers, mln people 
Premium subscribers estimation 
2012 
2013 
Q1 
Q2
5 
Exhibit 6 - Premium subscription revenue projection, 2014-2018 (in thousands of $) 
Source: LinkedIn, Linked2Win, 2014 
2. Marketing Solution 
2.1. Industry overview 
(1) Advertising industry growth 
The advertising industry shows global growth possibilities over next 5 years, due to the world economic growth predictions and higher involvement of developing countries in the market. 
(2) Media advertising market statistics 
America is the world’s largest advertising and media market. At the same time, China, India, Latin America and Easten Europe are the fastest growing regions with 10% growth yearly in last 5 years. Western Europe market remains slow because of high unemployment rates and economic slowdown. It is predicted that market share of developing markets will increase from 25% in 2014 to 33% in 2018. 
(3) Digital advertising TAM 
The overall advertising landscape is directed by digital advertising, which is the most dynamic and significant part of media advertising. The audience, amount of advertisers of different scales and diversity of advertising increases significantly. For 2013, global digital advertising spending reached $120.05 billion, $140.15 billion is predicted for 2014 and double-digit growth is expected to push the market till 2016. Digital advertising composes one-quarter of the market, however, Its market share is expected to reach one-third in 2018. US still have the biggest digital advertising market (38%), Asia-Pacific region has 28% and Europe has 25% of the market. European countries 2013 2014E 2015E 2016E 2017E 2018E Total Revenue ($ thousands) 306,511 456,000 518,400 777,600 1,143,072 1,657,454 Average price ($) 
40 
38 
36 
36 
36 
36 Premium subscribers (1000/month) 639 1,000 1200 1800 2646 3836.7 Premium subscribers Growth (%) 
61% 
57% 
20% 
50% 
47% 
45% Number of users 276,842 345,000 420,000 495,000 560,000 610,000 Premium subscribers / Users 
0.23% 
0.29% 
0.29% 
0.36% 
0.47% 
0.63% Avg Rev / User 1.11 1.32 1.23 1.57 2.04 2.72 Unique 
76000 
92,534 
112,374 
136,400 
156,562 
184,798 Premium subscribers / Unique 0.84% 1.08% 1.07% 1.32% 1.69% 2.08% Total Addressable Market (people) 
560,000 
650,000 
730,000 
815,000 
915,000 
1,000,000 Total Addressable Market 620,015 859,130 901,029 1,280,291 1,867,698 2,717,138 Market Share 
49% 
53% 
58% 
61% 
61% 
61% PS Revenue growth % 60.94% 48.77% 13.68% 50.00% 47.00% 45.00%
6 
have higher share of digital advertising to total media than USA (UK – 47.5%, Denmark – 40%, Australia - 37.5% and USA - 28%). 
Exhibit 7 
So source: eMarketer.com, June 2014 
Sou source: eMarketer.com, June 2014 
(4) LinkedIn for professional marketers 
Marketers use social media platforms professionally in B2C and B2B marketing. In B2C market, Facebook has leading position as 97% of marketers usage. In B2B marketing, LinkedIn together with Facebook and twitter are highly used (over 85%). LinkedIn is used in business sector more actively than in B2C due to the specialization of the social platform. In the future, the company will be more focused in B2B after the acquisition of Bizo. 
Exhibit 8 
Source: Statista, 2014 
104.57 
120.05 
140.15 
160.18 
178.45 
196.05 
213.89 
20.4% 
14.8% 
16.7% 
14.3% 
11.4% 
9.9% 
9.1% 
32.3% 
0.0% 
10.0% 
20.0% 
30.0% 
40.0% 
50.0% 
60.0% 
70.0% 
0 
50 
100 
150 
200 
250 
2012 
2013 
2014 
2015 
2016 
2017 
2018 
Digital advertising (Worldwide) 
Digital advertising spending 
% change 
% of total market 
503.15 
516.2 
545.4 
574.18 
604.77 
633.85 
662.73 
4.4% 
2.6% 
5.7% 
5.3% 
5.3% 
4.8% 
4.6% 
0.0% 
10.0% 
20.0% 
30.0% 
40.0% 
50.0% 
60.0% 
70.0% 
0 
100 
200 
300 
400 
500 
600 
700 
800 
2012 
2013 
2014 
2015 
2016 
2017 
2018 
Media advertising (Worldwide) 
Media advertising spending 
% change 
97% 
81% 
60% 
59% 
89% 
86% 
52% 
88% 
0% 
10% 
20% 
30% 
40% 
50% 
60% 
70% 
80% 
90% 
100% 
Facebook 
Twitter 
YouTube 
LinkedIn 
Marketers usage of Social Media 
B2B 
B2C
7 
(5) LinkedIn DA market penetration 
LinkedIn is a small player in the social media advertising industry (less than 1%). The company has increased its market share in the digital advertising market and it is estimated that in 5 years LinkedIn will capture 1.3% of the market , which is 2.5 timer bigger than that in 2013 (0.5%). 
Exhibit 9 - Digital advertising revenue share, by Company, 2012-2018 
% of total digital ad revenue 2012 2013 2014 2015 2016 2017 2018 Google 40.9% 39.9% 40.8% 42.3% 41.8% 41.5% 41.3% Facebook 
5.9% 
7.4% 
8.2% 
9.0% 
9.2% 
9.5% 
9.8% Twitter 0.6% 1.0% 1.6% 2.2% 2.4% 2.6% 2.8% LinkedIn 
0.4% 
0.5% 
0.7% 
0.9% 
1.1% 
1.2% 
1.3% Total 36.8 42.6 48.1 53.4 59.8 64.5 71.0 
Source: Emarketer.com, 2014 
(6) Key drivers 
The main drivers in DA industry are: 
a. Amount of registered members. Positive trend for LinkedIn. 
b. The engagement of people: pages viewed and time spend. People that use LinkedIn for free have limitations, spend less time and make less pages views on the site than premium subscribers. With the introduction of Pulse publishing, average time spending started to increase. Mobile application improved the amount of unique members as well, as they constitute 45% of the total members. 
c. Targeting and measuring. LinkedIn present more detailed and systemized database for marketers than other social network sites, making targeting easier and more successful. LinkedIn released its own Ad API as well as other technical innovative features to make marketing more efficient. 
d. Average price. As the targeted auditory can be reached more easily, advertised will admit paying more to reach higher efficiency. 
(7) Competitive analysis 
The biggest social networks that generate revenue from digital advertising are Facebook, Twitter and LinkedIn. People are the most actively involved if Facebook with big amount of active users, page views and time spent. This results in high digital advertising revenue. DA Rev/ 1000 views of $0.5 is small compared to $1.6 of Twitter and $4.2 of LinkedIn, but each user sees more than 15000 pages resulting in $7.6 in DA Rev/ Active user, what is higher than $3.0 of Twitter and LinkedIn. LinkedIn have good chances to improve DA revenue per active user, as each view generates more revenue than that of Facebook and involvement is expected to increase.
8 
Exhibit 10 - Competitive analysis, 2014, in thousands of $ 
Active users 
Views 
Time spent 
DA-Rev 
DA-Rev/ Active user 
DA-Rev / 1000 view 
Market cap 
P/E 
P/Rev Facebook 1,320 20,026 24 min 10,013 7.6 0.5 190,250 95 19.00 
Twitter 
271 
504 
3 min 
807 
3.0 
1.6 
25,610 
430 
26.58 LinkedIn 84 95 1 min 398 4.7 4.2 25,410 114 13.54 
Source: comScore, Factset, Linked2Win 
(8) Revenue projections 
We assume that number of unique members will increase with the growth of pages views and time spent per person, due to recently introduced additional useful features in LinkedIn and future product development as well as increasing member base for networking. Revenue per unique visitor is estimated to grow due to better search targeting abilities and more successful business advertising that in other sites. 
USA and other countries market penetration will grow quickly. US will remain the main market in the next 5 years, developing countries market will move up rapidly. 
Exhibit 11 - Marketing Solutions revenue projection, 2014-2018 
In thousands of $ 2013 2014E 2015E 2016E 2017E 2018E Total Revenue 362,000 463,970 655,493 908,950 1,183,528 1,462,841 Revenue growth 
40% 
28% 
41% 
39% 
30% 
24% Unique visitors 76,000 92,534 112,374 136,400 156,562 184,798 Pages views 
83,000,000 
107,900,000 
145,665,000 
189,364,500 
236,705,625 
284,046,750 Pages views growth 62.7% 30.0% 35.0% 30.0% 25.0% 20.0% Rev/ Unique 
4.76 
5.01 
5.83 
6.66 
7.56 
7.92 Rev/1000views 4.36 4.30 4.50 4.80 5.00 5.15 Pages / Unique 
1,092 
1,166 
1,296 
1,388 
1,512 
1,537 TAM 
120,000,000 
140,150,000 
160,180,000 
178,450,000 
196,050,000 
213,890,000 USA TAM 42,600,000 48,100,000 53,040,000 58,000,000 64,500,000 71,000,000 Other countries TAM 
77,400,000 
92,050,000 
107,140,000 
120,450,000 
131,550,000 
142,890,000 USA penetration 0.5% 0.6% 0.8% 1.0% 1.2% 1.3% World penetration 
0.3% 
0.3% 
0.4% 
0.5% 
0.6% 
0.7% USA Revenue 213,000 288,600 413,712 580,000 741,750 923,000 Other Revenue 
149,000 
175,370 
241,781 
328,950 
441,778 
539,841 USA % growth 44.7% 35.5% 43.4% 40.2% 27.9% 24.4% Other % growth 
34.5% 
17.7% 
37.9% 
36.1% 
34.3% 
22.2% US / World % 58.8% 62.2% 63.1% 63.8% 62.7% 63.1%
9 
3. Recruiting industry 
3. 1. Industry overview 
(1) Industry Definition 
The recruitment industry is composed of 1) Employment Placement Agencies, 2) Temporary Help Services and 3) Professional Employer Organizations that provide recruiting service for various business enterprises. The main source of revenue is service fee from the corporate. 
(2) Industry environment (trends) 
With the evolving of online recruit service providers such as LinkedIn.com and Monster.com, more companies are in the transition of managing their own recruiting by posting job listings online and job seekers also find employment via online postings. Due to these recent trends, traditional recruitment agencies are facing severe competitive threats. 
(3) Industry Statistics 
According to the IBIS Worlds(2014), the revenue of US Employment & Recruiting industry has grown at an annualized rate of 1.8% to $12 billion over the five years up to 2013, and it is estimated to remain stagnant (0% growth) over the next five years. This is mainly due to the recent recession and the astonishing growth of online recruit industry. During the same period, the revenue of LinkedIn has grown to $1.5billion (CAGR of 54.5%). In 2013, the US was the largest market with 34% of share, followed by Japan with 13% and the UK with 11%. Europe as a whole represented 35% of the global staffing market in 2013. The Emerging Markets accounted for 10%.1) 
3.2. Industry Dynamic 
(1) Key External Drivers 
 Economic conditions (Economic cycle) 
The recruit industry is adaptive to the economic conditions. The revenue of industry directly related to the new job opening and unemployment rate. In addition, there is far less employee turnover when economic conditions are uncertain because employed workers are less inclined to pursue a new position when the labor market has few suitable openings. However, the online recruitment industry is less vulnerable to the economic conditions. This is because many corporate 
1 Adecco group, Annual Report 2013,p.8
10 
bring recruitment functions in-house in order to reduce the cost and the revenue from the job seeker (subscription revenue) tends to increase. 
 Employee turnover rate 
Not only the new job openings but also job turnover rate influences the demands of recruiting services. The employee turnover rate is influenced by the internal factors such as salary level, job satisfaction and external factors such as law and regulation, culture and labor market flexibilities. 
 Corporate profit 
The industry is sensitive to the corporate growth, which affects the demand for labor. 
(2) Key Internal Drivers 
 Access to highly skilled workforce 
The competitive edge of the recruit company depends on the pool of the highly skilled employees involved in their network. As the number of professional users increase, more and more corporate customer will be enticed to enter into the network. This network effect has been leveraging the growth of online recruit industry. LinkedIn has been gaining more users because it has been able to entice both registered users (potential employees) and corporate customer to join into its platform. 
 Ability to quickly adopt new technology 
New technology is vital. The prevalent use of the internet in order to provide information on job vacancies and the review of resumes by employees and employers, the optimized search engine to find most appropriate workforces have been changing the business process and competitive advantages among players. 
 Providing client confidentiality 
It is crucial to ensure confidentiality of operation and secure privacy of registered users and clients. 
3.3. Competitive environment
11 
(1) Recruit agency industry 
The recruit agency industry in US is highly fragmented. The major player measured by revenue are Adecco Group ($950million, market share: 8.1%) and Randstad Holding ($800million, market share: 6.8%). Those companies offer a various service related to HR, such as temporary staffing, permanent placement, career transition and talent development and in-house solution & HR solution. The remnant market is shared by a large number of small enterprises. 
(2) Online recruit industry 
Except for the dominant player, LinkedIn, other meaningful player in the online recruitment industry is Moster.com. Since established in 1999, Monster.com has been one of the largest employment website in the world. As of 2013, Monster.com has more than 200 million of registered users, with a local presence in more than 40 countries. The company’s revenue is primarily generated from the placement of job postings (Careers-North America: 55% and Careers-International: 36%) and internet advertising & fees (9%). Monter.com’s financial performance has been poor in recent year due to the recessive condition and direct competition with LinkedIn. In 2013, Moster.com’s revenue was $808million (YoY -9.3%), which represent 5- year average growth rate of -1.58% and net loss was $0.2million2) 
3.4. Revenue Projection 
In 2013, LinkedIn’s Talent Solution revenue was $859 million which consists of 56% of total revenue. Talent Solution revenue comes from the subscription fee from LinkedIn Corporate Solutions, LinkedIn Jobs and Subscriptions and has two main customer bases: corporate user and professional organizations. According to the LinkedIn’s 2013 10K, the number of corporate solution users are 24,444. Up to 2013, the annual growth rate of revenue was 12.9%. The annual growth rate of number of corporate solution user and ARPU were each 98.2% and 11.4%. 
2) Monster.com, Annual Report 2013, p.5
12 
Exhibit 12 
Note: 
In order to estimate the forward 5year Talent Solution revenue, we used this model 
Talent Solution revenue = TAM (Total Addressable market) x Penetration rate of Linked x ARPU (Average Revenue per user) 
(1) Estimation of TAM 
In order to estimate LinkedIn’s TAM, we estimated the number of corporate by employment size and assumed that LinkedIn’s primary target is corporate with 500+ employees and second target is corporate with 100~499 employees. 
Exhibit 13 - Number of companies by employment size in 2013 
500+ 
100~499 
100+ 
US 
17,671(26%) 
81,243(18%) 
98,914(19%) 
International 
50,762(74%) 
382,917(82%) 
433,678(81%) 
Total 
68,433(100%) 
464,160(100%) 
532,592(100%) 
Source: US Census Bureau, OECD, Government of Canada, Statistics Bureau of Japan, Brazilian Institute of Geography and Statistics, Indian Ministry of Statistics and Programme Information, Chinese Ministry of Commerce, EROP-GCC, ACRA (Singapore), IMF, UBS estimates 
After then, we projected future TAM by using the assumption of annual growth rate of 1%. We were not able to find the international Corporate’s growth rate. However, according to concensus.gov, The Number of US corporate has grown at 0.8% per year. 
182% 
156% 
101% 
64% 
0% 
50% 
100% 
150% 
200% 
$0 
$200 
$400 
$600 
$800 
$1,000 
2009 
2010 
2011 
2012 
2013 
Growth rate 
Revenue(Million) 
Talent Solution Revenue and Growth rate 
144% 
139% 
78% 
49% 
0% 
20% 
40% 
60% 
80% 
100% 
120% 
140% 
160% 
- 
5,000 
10,000 
15,000 
20,000 
25,000 
30,000 
2009 
2010 
2011 
2012 
2013 
Growth rate 
Corporate Solution User 
Corporate Solution Uesr and Growth rate 
16% 
7% 
13% 
10% 
0% 
2% 
4% 
6% 
8% 
10% 
12% 
14% 
16% 
18% 
- 
5.0 
10.0 
15.0 
20.0 
25.0 
30.0 
35.0 
40.0 
2009 
2010 
2011 
2012 
2013 
Groth rate 
ARPU($thousand) 
ARPU and Growth rate
13 
Exhibit 14 - The projection of TAM 
2013 
2014 
2015 
2016 
2017 
2018 
Corporate +500(Global) 
68,433 
69,117 
69,809 
70,507 
71,212 
71,924 
Corporate +100(Global) 
413,398 
417,532 
421,707 
425,924 
430,184 
434,485 
Source: LinkedIn 
(2) The estimation of Penetration rate of LinkedIn 
Using those data, LinkedIn’s current market penetration rate corresponds to 36% of Global Corporate with 500+ employees or 6% of Global Corporates with 100+ employees. Although LinkedIn does not publish geographic segment data of Corporate solution users, considering the proportion of total revenue (US 40%: International 60%), current market penetration rate of US market is estimated higher than this simple estimation. Since LinkedIn’s business model is still eroding and there are no precedents, it was impossible to estimate the target penetration rate for 5 years. 
We approached reverse to get the target growth rate of Corporate user which corresponds to make its penetration rate of 20% of Global 100+ corporate in 5 years. With this assumption, we get Linkedin’s annual growth rate of corporate user as 30%. 
This looks like somewhat aggressive assumption, because in 2013 the number of US Corporate with +100 is 19% of total Corporate. However, considering the Linkedin’s strategy of expansion to the international market, we think this assumption is not too unrealistic. 
Exhibit 15 – Talent Solution Penetration rate 
2013 
2014 
2015 
2016 
2017 
2018 
Corporate +500(Global) 
36% 
46% 
59% 
76% 
98% 
100% 
Corporate +100(Global) 
6% 
8% 
10% 
13% 
16% 
20%
14 
(3) The Estimation of ARPU 
Up to 2013, the annual growth rate of ARPU has been 11.4%. Generally, as company’s penetration increase up to market saturation point, the ARPU have to decrease due to the increase in competition and price strategy to enlarge more customer base. However, considering the monopolistic statute of LinkedIn and the growth potential of ‘network effects’. We used this historic growth rate (11.4%) to estimate the ARPU. 
4. CRM industry 
4.1. Industry overview 
Custom relationship management (CRM) industry is a fairly matured industry, especially in the U.S. and Europe. A study from Computer Science shows that approximate 51% of organizations in the U.S. has adopted CRM (Computer Science, 2012). And the adoption trend shows the percentage will keep going up in the next five years. The easily accessible of computer technology makes the entry barrier of the CRM industry comparative low. However, the numbers of CRM firms in the United States is decreasing by 1.6% annually (IBISWorld, 2014). Because of the comparative power of small companies is way lower than the biggest three player, which occupied around 80% of market share in the industry (IBISWorld, 2014). 
(1) Industry Trends 
As CRM Revenue Worldwide Trend shows below, the revenue of the industry grows stably in recent years. The total market in 2013 exceed $14 billion. However, the growth rate has decreased from 26.3% in 2011 to 20.7% in 2012, and it will keep decreasing. The downward trend of growth rate indicates that the traditional CRM industry that contribute more than 70% of the total revenue is getting close to saturation. Unlike the traditional CRM, one of the sub industry of CRM – Social Network CRM – is standing at the beginning. Companies like LinkedIn is opening a new market of CRM by connect sales people and the world in different ways. And the revenue from social network CRM software will be more and more important in the future.
15 
(2) Geographical Distribution 
As what we mentioned before, CRM industry is a mature industry in the United States. In 2013, the revenue that come from America contributed 50% of the total. And the entire America region contributed 66% of the total. Western Europe as the second biggest market contributed around 22% of the total. While the revenue from Asia Pacific area, which include China, Japan, Korea, etc., is only contributed 10% of the total. As the fast growing of the economics in Asia, the potential market is incredible big. 
Exhibit 15 
Source: Gartner 
Source: Gartner 
4.2 Industry Dynamic 
(1) External Driver 
 Economic environment 
Economic environment has a strong positive effect on the CRM industry. Under a good economic condition, the blooming of business and human resource will create a huge data base for corporations. Managers need to deal with their customer, their business, and their employee in an efficient way. Customer relationship management system is needed eagerly. Adversely, under a bad economic condition, most of corporations, especially small corporations, don’t need a third party to deal with their data. On the top of that, the price of the CRM system are comparatively high, they might unable to afford those payment. 
0.0% 
5.0% 
10.0% 
15.0% 
20.0% 
25.0% 
30.0% 
- 
5,000.00 
10,000.00 
15,000.00 
20,000.00 
25,000.00 
30,000.00 
CRM Revenue Worldwide Trend 
Total Revenue 
Total Growth Rate 
America50% 
Other America16% 
EMEA24% 
APAC10% 
CRM Regional Revenue in 2013 
America 
Other America 
EMEA 
APAC
16 
 Development of e-commercial Market 
Custom relationship management industry is highly rely on the e-commerce market. CRM system can watching and measuring the performance of businesses. It’s not only helping managers to make the right decision, but also save managers a lot time to deal with other more important things. Thus, with the development of the e - commerce market, CRM industry is going to grow as well. 
(2) Internal Driver 
 Website Performance 
The website performance includes how webpage been designed and structured, how easy to understand, and how fast webpage can be reached. The website performance is one of the most important criteria for potential customer to decide whether they want to explore more in the software. And it is also important to existed clients. Clients have limited patient to deal with website’s bugs, such as a page does not show propriety, or it take too long to open a sub page. 
 Customers Satisfactions 
Customers satisfactions includes how the function of the software satisfied clients’ needs, and how fast can the software adopt new technology. With the development of the technology, customers’ loyalty to a platform/software is getting lower and lower. A new technology has ability to dilute market share unpredictably. 
(3) The role of LinkedIn in CRM industry 
Unlike most of existed cooperation in the CRM industry, LinkedIn built a brand new business model. Based on its unique personal profile data, Sales Navigator – the new product that LinkedIn launched recently – is going to provide more accurate information that a sales person need, make sales work more efficient, and easier to get in touch with the right person. On the top of that, the local website that LinkedIn open in China in this year may open the CRM market in Asia.
17 
4.3 Sales Solution Revenue 
The new product –Sales Navigator -- announced by LinkedIn on July 31, 2014 is a revolution of sales perspective. As a social network CRM software, Sales Navigator is mainly designed for sales people in the B2B industry. Based on LinkedIn’s data system, sales people are able to target to the right person for their business, familiar with the person by read his/her profile online, and ask shared connections for introduction. LinkedIn’s sales solution is not only make sales easier and more efficient, but also open a whole new revenue stream for itself. Based on our conservative analysis, the annually revenue from sales solution is able to exceed one billion dollars in five years. 
(1) Estimation of TAM (Total Addressable Market) 
The model is aim to find out the total numbers of both existed and potential sales people for LinkedIn (TAM), as well as the reality of the numbers of sales can LinkedIn reach in the real (SOM). Based on reliable assumptions of growth rate and percentages, finding out the revenue from Sales Solution. 
(2) Predict Model 
The core assumption of revenue from the sales solution is: 
Total Revenue = Numbers of Sales People x Price of Sales Navigator 
Where: 
Numbers of sales people refer to salespeople who registered on LinkedIn in the certain year 
Price of Sales Navigator is weighted by percentage of people who is going to pay times by price listed. (See Appendix 2) 
(3) Total Addressable Market 
Based on all analysis above, the result of the total addressable market (TAM) and the total realized market (SOM) in the United State has been showed in table.4. And the result of the total addressable market (TAM) and the total realized market (SOM) in the area other than the United States is showed in table.5. As it shows in the U.S. market, LinkedIn is getting close to 100% of total addressable market. However, in the international market, excluded the United States, LinkedIn will reach approximate of 50% of the total addressable market.
18 
Exhibit 16 
(4) Scenario Analysis 
LinkedIn has list three price of the sales solution: $23.99/mo, $47.99/mo, and $74.99/mo. If the client chose to pay annually, the monthly payment will be slightly lower. So the condition of pay in annually has not been considered in all of three scenarios. Percentage in tables refers to the percentage of people who will pay the certain amount of money monthly. 
a. Base case 
Price 
2014 
2015 
2016 
2017 
2018 
$0.00 
100% 
97% 
93% 
89% 
85% 
$23.99 
0% 
3.0% 
6.0% 
9.0% 
12.0% 
$47.99 
0 
0.0% 
0.6% 
1.2% 
1.8% 
$74.99 
0 
0.0% 
0.3% 
0.6% 
0.9% 
Revenue 
- 
$238,269,294 
$758,687,595 
$1,410,969,363 
$2,231,019,749 
b. Higher case 
Price 
2014 
2015 
2016 
2017 
2018 
$0.00 
100% 
95% 
89% 
82% 
76% 
$23.99 
0% 
5% 
10% 
15% 
20% 
$47.99 
0 
0 
1.0% 
2% 
3.0% 
$74.99 
0 
0 
0.5% 
1.0% 
1.5% 
Revenue 
- 
$397,115,490 
$1,200,325,820 
$2,193,434,614 
$3,427,953,933 
c. Lower case 
Price 
2014 
2015 
2016 
2017 
2018 
$0.00 
100% 
99% 
97% 
95% 
93% 
$23.99 
0% 
2% 
3% 
5% 
6% 
$47.99 
0 
0% 
0% 
1% 
1% 
$74.99 
0 
0% 
0% 
0% 
0% 
Revenue 
- 
$119,134,647 
$392,331,366 
$732,038,256 
$1,157,207,668
19 
II. PORTERS FIVE FORCES ANLYSIS 
In order to get a detailed knowledge of the LinkedIn’s competitive structure, our team has decided to continue industry analysis further by using the Porters five forces Model. This model provides with the insights regarding the influence of current competitive position and helps to understand the varied factors that have a major role in strategy development. Moreover, this model helps to understand the degree of vulnerability of the company’s different segments. 
1. Threat of new entrants 
When we consider both the business models of social industry i.e. *Business-to-Business or Business-to-Customers we see that’s the level of entry barriers is still a question to debate because on one side it’s difficult for new entrants to invest huge capital and get the large customer base and reach to the level where LinkedIn is currently and on the other side it’s also provides the new players with opportunity to study and analyze the market carefully and collaborate with other big companies to render their services which could later post threat to LinkedIn. The new entrants can pose challenge for established companies like LinkedIn by altering their costs according to the client’s budgets. But the technologies and the brand name that LinkedIn has acquired over the years makes it difficult for the new entrants as they have to acquire these before effectively competing with a firm which has proved itself as the dominant leader in its industry. Therefore firm like LinkedIn have the competitive advantage over its rivals as they have the ability to employ the new technologies, economies of scale and scope, huge capital investment, humongous customer base and a strong brand name. 
2. Threats of substitute’s products 
LinkedIn has created a brand for themselves by continuously innovating the products and services they offer and as a result they have gained the trust of their customers which has further helped them to establish themselves as the leader in their industry. Nevertheless, it still faces competition from the other various companies and the online marketing alternatives*. In case of the competitors the Price/purchase tradeoff has to be take into consideration since the customers are generally vulnerable to the prices, they may at one side give off performance if offered low price on the other hand can also go for higher prices if the performance is increased.
20 
3. Rivalry against Existing firms 
Rivalry against existing firms is moderate because LinkedIn has significantly proved them as the leader in the industry but this can be effected by the continuous changes in the customer expectations as well as because of the vigorous market of social media. However, LinkedIn provides a lot of options and features to its consumers (whether free or paid) thus targeting and capturing the different segments. Currently LinkedIn is facing competition from Facebook and Twitter in social media, Monster, CareerBuilder and Indeed.com in talent solutions and Salesforce, SAP, oracle in the marketing segment. Additionally various competitors in social media like Xing and Viadeo who were focused only in Europe initially have redeveloped their strategies by expanding to new segments and increasing their presence globally. Nevertheless, LinkedIn unique business model and its increasing user base has helped them to grow substantially and create a monopoly for them in the market. Entering into the Chinese market from henceforth will help them to grow further more in comparison to the other competitors. 
4. Bargaining powers of buyer 
Bargaining power of buyers is between low to moderate as there is no concentration and no switching costs and LinkedIn has established themselves as the undisputed leader in the industry. Since the customer belong to varied segments from individuals, enterprises and corporate organizations there is low power to bargain due to absence of the concentration to a specific segment. Nevertheless, maintaining of the brand reputation is really important for LinkedIn as the company has created its name over the years and a small negative event can lead to movement of their customers to other options available. Additionally the company has to change is models according to the customer expectations by continuously adapting to the changing needs of their customers and by innovation. Furthermore, we also see that there are no switching costs so a customer can easily switch to other alternatives. But in case of LinkedIn who have exhibited as an undisputed leader in the market will have a positive effect of this as more customers will join the network because of the limited choices available to them and thereby users have more reasons to stay with the network.
21 
5. Bargaining power of Suppliers 
Bargaining power of Suppliers is low because the company has a global presence and it targets various different professional segment in the online services. The various acquisitions by LinkedIn like slide-share and pulse have allowed the company to reach different potential segment in the market, thereby helping them to position themselves strong in comparison to the other suppliers. 
III. COMPANY ANLYSIS 
1. Business Analysis 
We have use Business model Canvas in order to evaluate the business of the LinkedIn. The business model canvas helps us to evaluate the value proposition, different revenue stream and key profit drivers. 
2. Value proposition 
LinkedIn strategy has been focusing on placing its members first and following their core value proposition of connecting talent with the right opportunity at massive scale. In order to put this idea into practice they focus on three main areas namely: Professional Identify, Networks and Knowledge and all these areas have a strategic objective attached to them. In case of professional identity it is the professional profile record of the members i.e. the company wants the user to leverage all the tools of LinkedIn in an efficient manner so that members can be found by professional’s .They want to work towards replacing the resumes by the profiles. In case of Networks the company objective is to connect all the worlds’ professionals i.e. 600 million knowledgeable, students and pre-professionals. Further in case of knowledge the objective is to establish LinkedIn as a definitive professional publishing platform. Additionally, they want to be a start of any sales opportunity (sales solution) and provide an effective way for marketers to engage professionals. When delivering value to its customers, LinkedIn again has 3 parameters with each having their strategic objectives namely being Hire, market and sell. With regard to hiring they want powering half of the hires by establishing them as the leading platform for passive recruiting scale while for market solutions they want to be the effective market to engage professionals while for the sales solution they want to be the start of every sales opportunity.
22 
3. Cost structure 
The cost structure of LinkedIn have been quite stable over the years with Cost Of Goods Sold steady at 13% of revenue, Sales and Marketing at stable 32-34% of revenue, Product Development stable at 26% of revenue ,General and Admin at stable 13-15% of revenue and D&A at stable 9% of revenue. 
4. SWOT ANALYSIS 
LinkedIn is one of the fastest growing social media company which has outperformed all its competitors that recently went public and as a result the stocks have been reaching all-time highs. The company has been expanding globally but the competition in the social industry is also increasing rapidly. So, we therefore decide to do a SWOT analysis in order know about the future probabilities. 
4.1 Strengths 
 Revenue Model 
LinkedIn uses a unique and a strong business model with its revenue streaming from its different segments namely Talent solutions, Premium subscriptions, Market solutions and sales solutions. However, the major portion of the revenue flows from the recruiting portal i.e. the talent solutions which amounts to almost more than 50% of the revenue. The revenue has been increasing on an average of 38% per year in comparison to its competitors like Monster whose market share to a large extent is being hampered by LinkedIn. 
 First mover and huge user base 
It’s evident that LinkedIn enjoys a Monopoly in its industry and have proved themselves as an undisputed player in the professional networking market by effectively using its status of being the first mover by properly predicting the future trends, thereby positioning themselves very strongly in the social media category . Additionally, the LinkedIn has been able to increase the dominance in the market due to rapidly increasing user base of LinkedIn which accounts to approximately 313 million.
23 
 Trusted by corporate clients 
LinkedIn has been trusted by its corporate clients and a proof to this is its increasing number in corporate clients which have reached to 28,080 by 2Q14. Furthermore, the company has establish long term contracts with these clients which have helped them with a constant flow of revenues. 
4.2 Weakness 
 User involvement 
The user involvement numbers have not been growing in the same trend due to Limited access to all members, though the numbers have increased since past years but still some actions can be taken in order to increase and enhance the engagement of users. It can also change its strategy for mobile apps in order to increase the user involvement as more and more people are shifting to mobile applications. It had increased to 45% from 30 % in the last year. But LinkedIn is still not using its mobile application to the fullest capacity to enhance the customer experience. 
 Highly dependent on online recruitment 
The company highly rely on the size of the recruitment business to increase its revenues in future. Additionally more than half of the revenues come from talent solutions and also it contributes the largest to sales. As a consequence, LinkedIn is perceived as online recruiting website more than a social media and networking 
 Cultural differences 
One of the main problems that LinkedIn has to deal with expanding its global reach is the cultural differences. Since different companies have different work culture, LinkedIn faces difficulty in understanding and connecting those companies.
24 
4.3 Opportunities 
 Advertising 
The advertising business of the LinkedIn is not growing on the same pace as it is for other segments and the company has a very large scope in the advertising market wherein they can efficiently utilize the data of their users and provide them with additional advertisements in order to increase its revenue. Its earn a smaller proportion to other companies like Facebook. Thus LinkedIn should use this segment more in order to increase its revenue further. 
 Content platform 
The company has by far done an excellent job to grown them as a platform for publishing and content sharing. The application influencers has been very successful in bringing the famous and successful leaders and sharing their opinions with the users. It has also been successful in content sharing through its applications like slide share. So the company can increase and improve the user involvement and experience by continuously innovating in these applications which would further increase the revenues. The company can also integrate various others features like Skype/IM in order to improve the communications. 
4.4 Threats 
 Upcoming social platforms 
The various new social platforms whether directly related to the market or not are competing with LinkedIn in terms of users. They not only fight for the users but also for the time spent by these users on other website. Companies like Facebook are competing with LinkedIn for the users. 
 Unreliability of data 
There is a possibility that some users in LinkedIn might put inaccurate data or skills about themselves or might use the site for wrong purposes can lead to damaging the reputation of LinkedIn.
25 
5. M&A Evaluation 
Exhibit 18 - List of the LinkedIn acquisitions 
Source: LinkedIn 
LinkedIn has taken a very cautious approach toward the acquisitions. Despite being in a fast- growing stage, it did only eleven acquisitions in the four-year time period since it went to IPO : two in 2010, three in 2011, two in 2012, one in 2013 and three acquisitions so far this year. It also shows an uprising trend in terms of the volume or the price for LinkedIn acquisitions. As in the exhibit below, it shows that the total acquisition spending in 2014 (which is only 8 months at this moment) already surpassed the previous three years combined. 
LinkedIn has taken a very cautious approach toward the acquisitions. Despite being in a fast- growing stage, it did only eleven acquisitions in the four-year time period since it went to IPO : two in 2010, three in 2011, two in 2012, one in 2013 and three acquisitions so far this year. It also shows an uprising trend in terms of the volume or the price for LinkedIn acquisitions. As in the
26 
exhibit below, it shows that the total acquisition spending in 2014 (which is only 8 months at this moment) already surpassed the previous three years combined. The key acquistions are listed in Appendix Link. 
6. M&A Strategy 
LinkedIn acquired the target companies mainly because of the following reasons: either contact- sharing feature or content-sharing feature. The contact-sharing improvements helped LinkedIn to expand its customer base by pulling in the potential members from other social networks and web services and facilitating the current members to reach out potential stakeholders. For example, Rapportive integrated the LinkedIn, Gmail, Facebook and Twitter accounts; Bright provided the technology for recruiters to find better candidates based on the profile, and vice versa; Bizo provided a more efficiency tool for B2B marketing. 
On the other hand, the content-sharing features allow LinkedIn to strengthen its stickness to the users. LinkedIn members spend more time per visit and page views Slideshare From 2011 to 2013, the total page views grew from 29 billion counts to 47 billion counts annually. 
Additionally, the methodology used by LinkedIn towards buying acquisitions is buying the technology instead of buying the growth, as technology would benefits its future blueprint. For instance, Bright didn’t had a sustainable revenue model to support its user growth, and Slideshare and Pulse were even free service providers. Thus, we assume there is no unorganic growth LinkedIn obtain from the acquisitions. 
Finally, we can also see that LinkedIn has only target the companies located in San Francisco Bay Area. The knowledge of the environment and corporate culture of target companies help LinkedIn to reduce the integration cost and risk.
27 
7. Management Team 
Management teams plays a vital role in the success of the organization as the success of the company depends on the way its employees perform and Managers forms a crucial part if the success of the employees and a true example of this is the CEO of LinkedIn Jeff Weiner itself. If he would have not questioned the previous CEO Reid Hoffman regarding the framework of his decision, he would have not become the CEO of LinkedIn. His clear vision of what he sees LinkedIn in future has made all the difference for the company. As it said good investment companies have visionary and long term focused management teams having clear goals and well- identified purpose of what they want now and most importantly in future. Its Jeff wiener vision that has led the company which just came public in 2011 to reach an astonishing market capitalization of 25.4 billion. He had also increased the revenue by 1.5 billion in 2013. His laurels just not only stays to LinkedIn but also with the companies he has worked prior to LinkedIn. Like in case of Yahoo where he was the vice president of one of the division he generated a revenue of 3 billion in 1 year with 3000 employees. 
Additionally he has not only thought of what the company needs to focus now in order to sustain its position rather he has also vision about how he wants LinkedIn to look in the next decade and have started taking steps in order to achieve them with their vision being “ Creating opportunity for every member of the global workforce”. The management team includes various people just concentrated on a specific area like the chief financial officer Steve Sordello who had previously worked in a team brought that bought first ever quarter profitability. He helped the company grew its revenue and earnings to an extent that a company having market value of less than 40 million reached 2 billion. 
As a result of this, company like LinkedIn would naturally attract talent as they clear vision, purpose and people would love to work for this company because they feel genuinely identified with the goals and purposes of the organization.
28 
IV. Valuation 
1. Valuation Methodology 
Although DCF method is theoretically reasonable and provides the closest thing to an intrinsic stock value. It has a major disadvantage that it is particularly sensitive to assumptions of the perpetuity growth rates and discount rates. For these reasons, relative valuation method such as PE multiple is more used in valuation of high-tech companies which grow fast and no debt. 
2. Pro Forma Income Statement 
(Unit : Thousand) 2013 2014(E) 2015(E) 2016(E) 2017(E) 2018(E) Revenue $1,529 $2,165 $3,217 $5,060 $7,525 $10,839 
Cost of Revenue 
$203 
$284 
$386 
$607 
$847 
$1,192 Gross Operating Profit $1,326 $1,882 $2,831 $4,452 $6,678 $9,646 
Sales & Marketing 
$522 
$755 
$1,122 
$1,771 
$2,634 
$3,794 
Research & Development 
$396 
$537 
$798 
$1,289 
$1,900 
$2,719 
General and administrative 
$226 
$334 
$450 
$658 
$978 
$1,409 Operating Income before D & A (EBITDA) $182 $255 $461 $734 $1,166 $1,725 
Depreciation & Amortization 
$135 
$230 
$350 
$550 
$818 
$1,179 
Other income (expense), net 
$1 
$5 
$5 
$5 
$5 
$5 Earning Before Interest Expenses (EBIT) $49 $30 $116 $189 $353 $551 
Income Taxes 
$22 
$60 
$40 
$66 
$123 
$193 Net Income $27 $30 $75 $123 $229 $358 
Non-GAAP Adjustments 
$161 
$258 
$382 
$589 
$878 
$1,249 
Non-GAAP Net Income 
$187 
$228 
$457 
$712 
$1,107 
$1,608 
Diluted Commom Stock Shares 
$119 
$126 
$126 
$126 
$126 
$126 EPS $0.23 -$0.24 $0.60 $0.97 $1.82 $2.84 Non-GAAP EPS $1.61 $1.81 $3.63 $5.65 $8.79 $12.76 
3. Estimation of EPS 
(1) Assumption 
1. Revenue 
Since Linkedin is currently eroding and fast growing, our revenue estimation is based on the projection of Total Addressible market(TAM) and Linkedin’s target penetration rate.
29 
Talent Solutions 
We assumed that in 2018, Linkedin’s penetration rate of corporate solution user reaches up to 25% of corporate target user (Global corpotate +100 employee). 
Marketing Solution 
we assumed that key drivers (number of unique users and time spent per person) will grow mainly due to the increasing user bases and launching of new features in LinkedIn. 
Sales Solution 
We assued that TAM (Numbers of Sales People) of Sales Solution increase at a rate of growth rate of higer educated population and using Numbers of sales registered on Linkedin worldwide. 
2. Expense 
For Year 2014 
We are forecasting the cost of revenue, sales and marketing expense, product development expense, general administrative expense, other income and tax expense according to the actual numbers of 2014 Q1 and Q2 and past years. The number of annual Depreciation and Amortization expense was given by Linkedin on a 2014 Q2 earnings call. 
For Year 2015 -2018 
Exhibit 19: Operating Expense Assumption
30 
Cost of Revenue 
We assume the general and administrative expense will face a downtrend in portion of sales, 12%,12%,11%,11% separately during the four-year period. 
Sales and Marketing expense 
With a new products, we assume the sales and marketing expense will remain the same level of amount as it’s in 2014. 
Product Development 
Since Linkedin has a strong focus on the future vision, we expect it will continuely and constantly invest in its talents to develop new products and features. We assume the product and development expense will remain 25% of the revenue in five years. 
General & Administrative 
We assume the general and administrative expense will face a downtrend in portion of sales, 14%,13%,13%,13% separately during the four-year period. 
Depreciation and Amortization 
We assume that depreciation and amortization expense will be remain the same portion of 2014, approximately 11% of the sales. We expect the M&A activities will bring the amortization expense year by year. 
Other Income (Expense) 
While the increasing cash inflows are expected, We assume Linkedin will spend the cash in M&A activities instead of buying market securities. Thus, the other income remain the same amount as in 2014. 
Income tax expense 
According to the projections from Factset, we assume the corporate effective tax rate is 35%. 
Non-GAAP Adjustments 
Stock-based Compensation and tax benefits
31 
Exhibit 20 
Source: Linkedin 
Stock-based compensation and the related tax benefits is the major adjustment items from GAAP net income to Non-GAAP net income. The main driver of the stock-based compensation is the stock options distributed to the employees. As we expect the stock price of Linkedin will grow, the uptrend of the stock compensation is also expected. 
Amortization of Intangible Assets 
We assume the growth rate of amortization expenses is 25%, which is equal to the intangible assets 
Tax Benefits 
We assume the effective tax rate for Non-GAAP adjustments is 25%, based on the historical number. 
3. Diluted Common Stock Shares 
Linkedin announced its expected diluted shares as 126,000 in 2014 Q2 earnings call. We don’t expect main changes on it in five years.
32 
4. Estimation of P/E Ratio 
Exhibit 21 - Valuation Comparisons – Information Technology Industry 
Source: Factset 
Exhibit 21 lists the expected 2014 Non-GAAP EPS, P/E Ratio, 5-year Long-term EPS Growth (2014, Factset) and P/E to Growth Rate (PEG) of 19 main players in information technology industries. Thus, We run linear regression to find out the correlation between LT EPS Growth Rate and P/E Ratio. The result is shown below in Exhibit 22.
33 
Exhibit 22: Regression Model of LT EPS Growth Rate to P/E Ratio 
Source : Factset 
The R squared is 0.4636, while the p-value is 0.0013, which means the regression model is coefficient and significant. As enjoying the 45% LT EPS growth rate currently, we expect the LT EPS growth rate will dropped to 20% in the EY 2018, and leads to approximately P/E Ratio 50. In addition, the PEG will be 2.5 in EY 2018. 
5. Target Price 
By multipling 50x P/E Ratio and expected Non-GAAP EPS $12.76, we can get our target price $638 per share on Dec.31, 2018.
34 
Reference 
IBISWorld, “CRM System Providers in the US”, May 2014 
IBISWorld, “Online Recruitment Sites in the US”, May 2014 
BISWorld, “Online Recruitment Sites in the US”, May 2014 
CRM Research, “Sizing Up the CRM Software Market”, 2013 
BUREAU of Labor Statistics “Occupational Employment and Wages”, May 2013 
CIA, “The world fact book”, June 20, 2014 
CIA, “The United States fact book”, June 20, 2014 
Work & Roll, “Industry and Porter’s Five Force Analysis: Social Media”, Aug 17, 2013 
WikiWealth, “Linkedin Co - Five Forces Analysis” 
The Motley, “LinkedIn: A SWOT Analysis”, July 18, 2013 
PR Newswire, “Bizo Delivers Record-Setting Fourth Quarter; Company Enters 2014 with $50M Revenue Run Rate”. Jun 05, 2014
35 
Appendix.1. PRIMARY RESEARCH 
Our team decided to further carry our analysis of the company by doing a primary research by conducting a survey in order to know how much are people aware about LinkedIn and further that for what purpose are they using LinkedIn and whether they are ready to pay for the services . We mainly targeted 4 countries namely India, China, Taiwan and Eastern Europe. This survey helped us to analyze the various markets that LinkedIn has shifted its focus to recently and further to know about the various growth opportunities or possible risks for the company by getting to know what people expect out of LinkedIn. The research was done using surveys and telephonic interviews and the sample size of the survey was 763 respondents. 
Survey Result 
China 
India 
Ukraine 
Taiwan 
Number of responses 
313 
257 
158 
35 
1 
Gender 
Male 
53% 
58.67% 
51.59% 
54% 
Female 
47% 
41.63% 
48.41% 
46% 
2 
Age 
18-24 
11% 
60.31% 
86.08% 
0% 
25-34 
45% 
27.23% 
12.3% 
53% 
35-44 
22% 
6.61% 
1.27% 
32% 
45-54 
11% 
5.85% 
0.63% 
9% 
55-64 
9% 
0% 
0% 
0% 
65 + 
2% 
0% 
0% 
6% 
3 
Career stage 
Hired 
75% 
41.63% 
42.41% 
80% 
Job searching 
17% 
39.7% 
39.24% 
14% 
No job and does not want a job 
8% 
10.89% 
18.35% 
6% 
Hiring (in case of HR) 
7.78% 
4 
Source for job search 
Website 
59% 
65.36% 
71.79% 
85.7% 
Hunter 
14% 
1.94% 
11.54% 
28.6% 
Referral 
42% 
27.23% 
11.54% 
68.6% 
Other 
5% 
5.47% 
5.13% 
28.6% 
5 
LinkedIn members 
Yes 
20% 
72.27% 
32.49% 
65.7% 
No 
80% 
27.24% 
67.11% 
34.3% 
6 
Reason of no registration 
I didn’t know it 
77% 
78.57% 
85.85% 
58.3% 
For specific reason (for example privacy etc.) 
23% 
21.43% 
14.15% 
41.7% 
7 
Main purpose of registration with LinkedIn 
Networking 
56% 
58.82% 
45.19% 
68.2% 
Job searching 
56% 
23.54% 
51.85% 
9.1% 
Others 
56% 
2.67% 
0% 
22.7%
36 
Recruiting employees 
0% 
14.97% 
2.96% 
0% 
8 
Willingness to pay 
Yes 
75% 
21.39% 
14.74% 
9.5% 
No 
25% 
78.61% 
85.26% 
90.5% 
9 
The most attractive function 
People you may know 
69% 
32.19% 
Send email to people 
37% 
6.85% 
Search a job 
68% 
60.96% 
10 
How people know about LinkedIn 
Friend 
52% 
69.43% 
90.9% 
Website 
18% 
14.01% 
9.1% 
Never heard 
12.74% 
Other 
30% 
3.82% 
11 
How do u recruit employees 
Campus recruitment 
45.94% 
Referral 
21.62% 
Direct applying for jobs 
10.81% 
LinkedIn 
13.51% 
Others 
8.12% 
Analysis 
Ukraine 
Almost 1 million people are registered in Ukraine, 44% of them are active users. Members live mainly in urban areas and 70% of them work in 5 big cities, Kyiv captures 50% by itself. Registered members compose 1.8% of total population of the country and 4.7% of economically active citizens. People involved in this social network haje a job in IT sphere or finance. 
The primary research targeted the auditory of student, resent graduates and young professionals. The survey answers come mainly fro people in age frame of 18-24 and 25-34 (95%). 
Survey foundings: 
 The majorety of respondees are hired (42%) and serch for a job (40%). 
 People usually use websites to search for a job. This creates opportunities for LinkedIn. 
 32% are registered in LinkedIn and half of them are unique users. 
 Other 68% of people are not registered in LinkedIn because in 86% of cases they did not know it. 
 Two main purposes of membership are job searcking (52%) and networking (45%). 
 15% of people are willing to pay for services, showing interest in the company. 
 61% of people consider job search the most attractive function.
37 
 The majority of people (70%) know about LinkedIn because of friends recomendations. 
Conclusion: 
LinkedIn penetration in Ukraine has good possibilities to grow with focus on job search and Talent Solution, as there is no similar company that proposes this kind of services. The knowledge spreading about main idea and usefulness of LinkedIn still needs to be improved, the main source of information for graduates can be universities. In 5 years the amount of people registered and involved can increase 500%. 
China 
Total collected amount of answers of our primarily research from China is 313. The range of age as well as region of responses are respectively wide. Some interesting facts of the result shows as below: 
 One third of responses in China search job via two main ways: recruiter website and referral. 
 Only 9% of People who already hired registered LinkedIn, while approximate 35% of all other groups have registered LinkedIn. 
 Based on the range of age, the younger the group is, the more people registered in LinkedIn. Group under 20 years old has 51% of people registered; group between 20 to 29 years old has 21% of people registered. 
 80% of responses did not register in LinkedIn, 77% of this group of has never heard LinkedIn before; 12% of them feel it is useless. 
 The way of 52.38% of responses get to know LinkedIn via friends’ recommendation. 
 75% of people who registered would like to pay for premium services. 
Market risks assessment 
Comparative environment 
China’s professional social network platform has started as the same time as LinkedIn. Tianji – the first professional social network platform in China – was founded in 2004. In the recent market, there are several competitors in the market. They are already well known, and most of them provide all their service free for individual customers.
38 
1. Culture difference 
LinkedIn is a very American style platform. Networking in western country is more based on friends, clients, coworkers, while eastern style networking is more rely on relative relationship. Thus, in eastern countries, people may consider more about their privacy of networking. 
2. Price of the service 
Prices of LinkedIn’s premium service in China is maintain as same as that listed in the U.S. Consider about the currency rate, it will be a certain amount of payment for Chinese users. On the top of that, one of the unique features of Chinese market is individual customer tend to not pay for online service. 
India 
The primary research targeted the student as well as the recruiters. While the survey responses came mainly form 18-24 and 25-35 amounting to be 87.54% 
Survey founding: 
 The respondents were off different career stage out of which 42% were hired and 39.7% were searching and 7.78 were the recruiting who were looking for potential employees 
 65.36% of people use website as a means of job searching clearing indicating a huge scope for LinkedIn. 
 72.27% were registered on LinkedIn and out of the remaining 27.24% who were not there on LinkedIn, 78.57 dint know about LinkedIn while the others dint find LinkedIn useful 
 The main purpose behind registration was networking (58.82%), job searching (23.54%) and recruiting employees (14.97). 
 A major population of the respondents were not willing to pay which accounted to be 78.61%. 
 When asked from the recruiters that which source they use the most for recruiting people, 45.94% said from campus recruitment, 21.62 said from referrals, 13.51 %used LinkedIn.
39 
Appendix.2. Assumption of Sales Solution’s TAM Model 
List of Items 
Number 
Growth rate /Percentage 
Total world population 
A 
g.1 
Total upper educational population 
B 
p.1 
Population registered on LinkedIn worldwide 
C 
g.2 
Numbers of sales registered on LinkedIn worldwide 
D 
p.2 
Numbers of B2B sales registered on LinkedIn worldwide 
E 
p.3 
Total sales people TAM 
F 
p.4 
Total B2B sales people TAM 
G 
p.5 
Total U.S. population 
H 
g.3 
Total upper educational population in the U.S. 
I 
p.6 
Population registered on LinkedIn in the U.S. 
J 
g.4 
Numbers of sales registered on LinkedIn in the U.S. 
K 
p.7 
Numbers of B2B sales registered on LinkedIn in the U.S. 
L 
p.8 
Total sales people TAM in the U.S. 
M 
p.9 
Total B2B sales people TAM in the U.S. 
N 
p.10 
Description: 
A: number from world Factbook (https://www.cia.gov) 
B: number announced by LinkedIn (CEO’s speech) 
C: based on LinkedIn’s disclosure (http://www.sec.gov) 
D: based on the recent sales people on LinkedIn. 
E: based on the percentage (p.3) of Numbers of sales registered on LinkedIn worldwide (D) 
F: based on the percentage (p.4) of Total upper educational population (B) 
G: based on the percentage (p.5) of Total sales people TAM (F) 
H: number from US Factbook (https://www.cia.gov) 
I: number from Census United State (http://www.census.gov) 
J: based on LinkedIn’s disclosure (http://www.sec.gov) 
K: based on the recent sales people on LinkedIn in the U.S. 
L: based on the percentage (p.8) of Numbers of sales registered on LinkedIn in the U.S. (K) 
M: based on the percentage (p.9) of Total upper educational population in the U.S. (I) 
N: based on the percentage (p.10) of Total sales people TAM in the U.S. (M) 
Assumptions: 
g.1: growth rate from world Factbook (https://www.cia.gov), assuming keeping flat in 5 years. 
g.2: assuming the growth rate will be slightly lower than previous years 
g.3: growth rate from US Factbook (https://www.cia.gov), assuming keeping flat in 5 years. 
g.4: assuming the growth rate will be slightly lower than previous years 
p.1: assuming the percentage will be slightly higher year by year 
p.2: assuming the percentage of registered sales people will keep flat in 5 years
40 
p.3: assuming B2B / (B2B+B2C) sales people = B2B / (B2B+B2C) companies 
p.4: assuming registered sales/registered people = sales TAM/ Total TAM 
p.5: assuming registered b2b sales/registered people = b2b sales TAM/ Total TAM 
p.6: assuming the percentage will be slightly higher year by year 
p.7: assuming the percentage of registered sales people will keep flat in 5 years 
p.8: assuming B2B / (B2B+B2C) sales people = B2B/ (B2B+B2C) companies 
p.9: assuming registered sales/registered people = sales TAM/ Total TAM 
p.10: assuming registered b2b sales/registered people = b2b sales TAM/ Total TAM 
Calculation: 
Total B2B Sales People TAM (G) 
= p.5 * Total sales people TAM (F) 
= p.5 * p.4 * Total upper educational population (B) 
= p.5 * p.4 * Total world population (A) 
= p.5 * p.4 * A 
Total B2B Sales People SOM (E) 
= p.3 * Numbers of sales registered on LinkedIn worldwide (E) 
= p.3 * p.2 * Population registered on LinkedIn worldwide (C) 
= p.3 * p.2 * C 
Total B2B Sales People TAM in the U.S. (N) 
= p.10 * Total sales people TAM in the U.S. (M) 
= p.10 * p.9 * Total upper educational population in the U.S. (I) 
= p.10 * p.9 * p.6 * Total U.S. population (H) 
= p.10 * p.9 * p.6 * H 
Total B2B Sales People SOM in the U.S. (L) 
= p.8 * Numbers of sales registered on LinkedIn in the U.S. (K) 
= p.8 * p.7 * Population registered on LinkedIn in the U.S. (J) 
= p.8 * p.7 * 
Total B2B Sales People TAM international = Total B2B Sales People TAM (Worldwide – U.S.) 
Total B2B Sales People SOM international = Total B2B Sales People SOM (Worldwide – U.S.)
41 
Appendex 3. LinkedIn’s M&A History 
Slideshare 
On May 17, 2012, LinkedIn completed its acquisition of Slideshare, Inc. (“Slideshare”), a leading provider of a professional and educational content platform that allows users to upload documents (mostly PowerPoint slides) to share ideas, exchange the conduct research, and connect with other business professionals. LinkedIn’s purchase price is $74.1 million. ($41.9 stock value and $32.2 million cash). The integration of Slideshare platform has helped in strengthening the content of professional networks of LinkedIn and making the members’ profile more credible. 
Pulse 
On April 17, 2013, LinkedIn purchased Alphonso Labs, Inc. (Pulse), a leading news reader and content distribution platform mainly based on mobile devices for $47.6 million ($44 million stock value and $3.6 million). With this acquisitions LinkedIn aimed at integrating the technology of Pulse into through social networks, to provide more relevant news experience with content tailored to the members’ professional interests both on the Pulse app and on LinkedIn.com. Furthermore, in order to continue with smooth integration LinkedIn also terminated its in-house new reader LinkedIn Today in November, 2013 (LinkedIn Annual Report, 2013) 
Bright 
On February 28, 2014, LinkedIn completed its acquisition of Bright Media Corporation ("Bright") for $101.8 million ($50.2 million stock value and $51.6 cash). Bright was the fourth biggest job recruiting websites before the acquisition and was famous for its unique machine learning algorithm and data analytic technology (Bright Score) of job matching. (LinkedIn 2nd Quarterly Report, 2014) 
Bizo 
On July 22, 2014, LinkedIn announced that it is going to acquire Bizo which was global leading platform for business audience for approximately $175 million, consist of 90% cash payment and 10 % stock shares exchange. According to the earning release for the year 2013, Bizo generated $50 million annual revenue and $38.3 million bookings. Bizo's data management and targeting technology enables precise and measurable B2B multi-channel marketing programs. (PR Newswire, 2014). However, LinkedIn will discontuned the The main reason for the acquisition is
42 
to leverage Bizo’s products and technology to create a larger B2B focused business. (LinkedIn 2014 Q2 Results Transcripts)

Más contenido relacionado

La actualidad más candente

Nailing Your Go-To-Market Positioning presented at Zuora Subscribed15 Growth ...
Nailing Your Go-To-Market Positioning presented at Zuora Subscribed15 Growth ...Nailing Your Go-To-Market Positioning presented at Zuora Subscribed15 Growth ...
Nailing Your Go-To-Market Positioning presented at Zuora Subscribed15 Growth ...Judy Loehr
 
Shopper Marketing Maturity Model
Shopper Marketing Maturity ModelShopper Marketing Maturity Model
Shopper Marketing Maturity ModelDemand Metric
 
SiriusDecisions -The Transformation of B2B Sales, Marketing and Product - at ...
SiriusDecisions -The Transformation of B2B Sales, Marketing and Product - at ...SiriusDecisions -The Transformation of B2B Sales, Marketing and Product - at ...
SiriusDecisions -The Transformation of B2B Sales, Marketing and Product - at ...MassTLC
 
Better Together: How Integrating Your Sales Tools Can Accelerate Sales Perfor...
Better Together: How Integrating Your Sales Tools Can Accelerate Sales Perfor...Better Together: How Integrating Your Sales Tools Can Accelerate Sales Perfor...
Better Together: How Integrating Your Sales Tools Can Accelerate Sales Perfor...Demand Metric
 
Strategic Marketing Organization Structure
Strategic Marketing Organization StructureStrategic Marketing Organization Structure
Strategic Marketing Organization StructureChris Choi
 
2018 product marketing trends report
2018 product marketing trends report2018 product marketing trends report
2018 product marketing trends reportTravis Wilkins
 
Product Marketing, the Salesforce Way (October 13, 2014)
Product Marketing, the Salesforce Way (October 13, 2014)Product Marketing, the Salesforce Way (October 13, 2014)
Product Marketing, the Salesforce Way (October 13, 2014)Salesforce Partners
 
IT Best Practices: Finding the Right Marketing Solution
IT Best Practices: Finding the Right Marketing SolutionIT Best Practices: Finding the Right Marketing Solution
IT Best Practices: Finding the Right Marketing SolutionMarketo
 
Partner marketing 22 march
Partner marketing 22 marchPartner marketing 22 march
Partner marketing 22 marchRob Bartlett
 
B2B Marketing Technologies Demystified
B2B Marketing Technologies DemystifiedB2B Marketing Technologies Demystified
B2B Marketing Technologies DemystifiedHileman Group
 
Lead gen and demand creation in europe full report - sirius decisions
Lead gen and demand creation in europe full report - sirius decisionsLead gen and demand creation in europe full report - sirius decisions
Lead gen and demand creation in europe full report - sirius decisionsHervé Gonay
 
Field Marketing Refresher
Field Marketing RefresherField Marketing Refresher
Field Marketing RefresherGautam Awasthi
 
Shopper Marketing Roles Framework
Shopper Marketing Roles FrameworkShopper Marketing Roles Framework
Shopper Marketing Roles FrameworkDemand Metric
 
Sales Enablement Framework
Sales Enablement FrameworkSales Enablement Framework
Sales Enablement FrameworkDemand Metric
 
B2B Demand Generation for 2018 - Launching new markets - Strategy
B2B Demand Generation for 2018 - Launching new markets - StrategyB2B Demand Generation for 2018 - Launching new markets - Strategy
B2B Demand Generation for 2018 - Launching new markets - StrategyYannis Karagiannidis
 
Go to market strategy and marketing objectives
Go to market strategy and marketing objectivesGo to market strategy and marketing objectives
Go to market strategy and marketing objectivesdirectionswitch10
 
Creating an experience worth raving about
Creating an experience worth raving aboutCreating an experience worth raving about
Creating an experience worth raving aboutThe Marketing Practice
 

La actualidad más candente (20)

Nailing Your Go-To-Market Positioning presented at Zuora Subscribed15 Growth ...
Nailing Your Go-To-Market Positioning presented at Zuora Subscribed15 Growth ...Nailing Your Go-To-Market Positioning presented at Zuora Subscribed15 Growth ...
Nailing Your Go-To-Market Positioning presented at Zuora Subscribed15 Growth ...
 
Shopper Marketing Maturity Model
Shopper Marketing Maturity ModelShopper Marketing Maturity Model
Shopper Marketing Maturity Model
 
SiriusDecisions -The Transformation of B2B Sales, Marketing and Product - at ...
SiriusDecisions -The Transformation of B2B Sales, Marketing and Product - at ...SiriusDecisions -The Transformation of B2B Sales, Marketing and Product - at ...
SiriusDecisions -The Transformation of B2B Sales, Marketing and Product - at ...
 
Better Together: How Integrating Your Sales Tools Can Accelerate Sales Perfor...
Better Together: How Integrating Your Sales Tools Can Accelerate Sales Perfor...Better Together: How Integrating Your Sales Tools Can Accelerate Sales Perfor...
Better Together: How Integrating Your Sales Tools Can Accelerate Sales Perfor...
 
Strategic Marketing Organization Structure
Strategic Marketing Organization StructureStrategic Marketing Organization Structure
Strategic Marketing Organization Structure
 
CRM Framework
CRM FrameworkCRM Framework
CRM Framework
 
2018 product marketing trends report
2018 product marketing trends report2018 product marketing trends report
2018 product marketing trends report
 
Product Marketing, the Salesforce Way (October 13, 2014)
Product Marketing, the Salesforce Way (October 13, 2014)Product Marketing, the Salesforce Way (October 13, 2014)
Product Marketing, the Salesforce Way (October 13, 2014)
 
IT Best Practices: Finding the Right Marketing Solution
IT Best Practices: Finding the Right Marketing SolutionIT Best Practices: Finding the Right Marketing Solution
IT Best Practices: Finding the Right Marketing Solution
 
Partner marketing 22 march
Partner marketing 22 marchPartner marketing 22 march
Partner marketing 22 march
 
B2B Marketing Technologies Demystified
B2B Marketing Technologies DemystifiedB2B Marketing Technologies Demystified
B2B Marketing Technologies Demystified
 
Lead gen and demand creation in europe full report - sirius decisions
Lead gen and demand creation in europe full report - sirius decisionsLead gen and demand creation in europe full report - sirius decisions
Lead gen and demand creation in europe full report - sirius decisions
 
Field Marketing Refresher
Field Marketing RefresherField Marketing Refresher
Field Marketing Refresher
 
Session 26 MG 220 MBA - 11 Nov 10
Session 26  MG 220 MBA - 11 Nov 10Session 26  MG 220 MBA - 11 Nov 10
Session 26 MG 220 MBA - 11 Nov 10
 
Shopper Marketing Roles Framework
Shopper Marketing Roles FrameworkShopper Marketing Roles Framework
Shopper Marketing Roles Framework
 
Sales Enablement Framework
Sales Enablement FrameworkSales Enablement Framework
Sales Enablement Framework
 
B2B Demand Generation for 2018 - Launching new markets - Strategy
B2B Demand Generation for 2018 - Launching new markets - StrategyB2B Demand Generation for 2018 - Launching new markets - Strategy
B2B Demand Generation for 2018 - Launching new markets - Strategy
 
Go to market strategy and marketing objectives
Go to market strategy and marketing objectivesGo to market strategy and marketing objectives
Go to market strategy and marketing objectives
 
Channel Optimization Partners
Channel Optimization PartnersChannel Optimization Partners
Channel Optimization Partners
 
Creating an experience worth raving about
Creating an experience worth raving aboutCreating an experience worth raving about
Creating an experience worth raving about
 

Similar a LinkedIn growth potential in Asia

Linkedin_February_5_2016
Linkedin_February_5_2016Linkedin_February_5_2016
Linkedin_February_5_2016Alexey Isaev
 
Line Plus Marketing Management
Line Plus Marketing ManagementLine Plus Marketing Management
Line Plus Marketing ManagementLena Ou
 
[Report] Indian Marketers are Ready to Adopt and Integrate Digital Marketing ...
[Report] Indian Marketers are Ready to Adopt and Integrate Digital Marketing ...[Report] Indian Marketers are Ready to Adopt and Integrate Digital Marketing ...
[Report] Indian Marketers are Ready to Adopt and Integrate Digital Marketing ...Social Samosa
 
Horizon Partners Q3 2013 Newsletter
Horizon Partners Q3 2013 NewsletterHorizon Partners Q3 2013 Newsletter
Horizon Partners Q3 2013 Newsletterhorizonpartners
 
Horizon Partners Newsletter 2013-11-22
Horizon Partners Newsletter 2013-11-22Horizon Partners Newsletter 2013-11-22
Horizon Partners Newsletter 2013-11-22Tyson Hendricksen
 
Horizon Partners Q3 2013 Newsletter
Horizon Partners Q3 2013 NewsletterHorizon Partners Q3 2013 Newsletter
Horizon Partners Q3 2013 Newsletterhorizonpartners
 
Digitising Consumers in India - BCG & Matrix Study
Digitising Consumers in India - BCG & Matrix StudyDigitising Consumers in India - BCG & Matrix Study
Digitising Consumers in India - BCG & Matrix Studyssuserf1f48a
 
Horizon Partners Q4 2013 Newsletter
Horizon Partners Q4 2013 NewsletterHorizon Partners Q4 2013 Newsletter
Horizon Partners Q4 2013 Newsletterhorizonpartners
 
Global Business Elite 2012
Global Business Elite 2012Global Business Elite 2012
Global Business Elite 2012LinkedIn Europe
 
LinkedIn ISMP Presentation
LinkedIn ISMP PresentationLinkedIn ISMP Presentation
LinkedIn ISMP PresentationNatasha Qabazard
 
MLA203 Media Landscape.docx
MLA203 Media Landscape.docxMLA203 Media Landscape.docx
MLA203 Media Landscape.docxstirlingvwriters
 
Cover SheetName of Students in Group1. Yua.docx
Cover SheetName of Students in Group1. Yua.docxCover SheetName of Students in Group1. Yua.docx
Cover SheetName of Students in Group1. Yua.docxfaithxdunce63732
 
Social_network_vgsom
Social_network_vgsomSocial_network_vgsom
Social_network_vgsomsiddharthaleo
 
Social networking PPT
Social networking PPTSocial networking PPT
Social networking PPTvarun0912
 
4 digital marketing research paper hari masterpiece
4 digital marketing  research paper hari masterpiece 4 digital marketing  research paper hari masterpiece
4 digital marketing research paper hari masterpiece HariMasterpiece
 
Job boards are dead and the future of recruiting is social
Job boards are dead and the future of recruiting is socialJob boards are dead and the future of recruiting is social
Job boards are dead and the future of recruiting is socialGreg Holt
 
Exploring the Lucrative Future of Influencer Marketing
Exploring the Lucrative Future of Influencer MarketingExploring the Lucrative Future of Influencer Marketing
Exploring the Lucrative Future of Influencer MarketingSocial Samosa
 

Similar a LinkedIn growth potential in Asia (20)

Linkedin_February_5_2016
Linkedin_February_5_2016Linkedin_February_5_2016
Linkedin_February_5_2016
 
Line Plus Marketing Management
Line Plus Marketing ManagementLine Plus Marketing Management
Line Plus Marketing Management
 
[Report] Indian Marketers are Ready to Adopt and Integrate Digital Marketing ...
[Report] Indian Marketers are Ready to Adopt and Integrate Digital Marketing ...[Report] Indian Marketers are Ready to Adopt and Integrate Digital Marketing ...
[Report] Indian Marketers are Ready to Adopt and Integrate Digital Marketing ...
 
Horizon Partners Q3 2013 Newsletter
Horizon Partners Q3 2013 NewsletterHorizon Partners Q3 2013 Newsletter
Horizon Partners Q3 2013 Newsletter
 
Horizon Partners Newsletter 2013-11-22
Horizon Partners Newsletter 2013-11-22Horizon Partners Newsletter 2013-11-22
Horizon Partners Newsletter 2013-11-22
 
Horizon Partners Q3 2013 Newsletter
Horizon Partners Q3 2013 NewsletterHorizon Partners Q3 2013 Newsletter
Horizon Partners Q3 2013 Newsletter
 
Digitising Consumers in India - BCG & Matrix Study
Digitising Consumers in India - BCG & Matrix StudyDigitising Consumers in India - BCG & Matrix Study
Digitising Consumers in India - BCG & Matrix Study
 
Future of Indian ConsumerTech
Future of Indian ConsumerTechFuture of Indian ConsumerTech
Future of Indian ConsumerTech
 
Horizon Partners Q4 2013 Newsletter
Horizon Partners Q4 2013 NewsletterHorizon Partners Q4 2013 Newsletter
Horizon Partners Q4 2013 Newsletter
 
Linkedin research report
Linkedin research reportLinkedin research report
Linkedin research report
 
Global Business Elite 2012
Global Business Elite 2012Global Business Elite 2012
Global Business Elite 2012
 
BEACON June 2013
BEACON June 2013BEACON June 2013
BEACON June 2013
 
LinkedIn ISMP Presentation
LinkedIn ISMP PresentationLinkedIn ISMP Presentation
LinkedIn ISMP Presentation
 
MLA203 Media Landscape.docx
MLA203 Media Landscape.docxMLA203 Media Landscape.docx
MLA203 Media Landscape.docx
 
Cover SheetName of Students in Group1. Yua.docx
Cover SheetName of Students in Group1. Yua.docxCover SheetName of Students in Group1. Yua.docx
Cover SheetName of Students in Group1. Yua.docx
 
Social_network_vgsom
Social_network_vgsomSocial_network_vgsom
Social_network_vgsom
 
Social networking PPT
Social networking PPTSocial networking PPT
Social networking PPT
 
4 digital marketing research paper hari masterpiece
4 digital marketing  research paper hari masterpiece 4 digital marketing  research paper hari masterpiece
4 digital marketing research paper hari masterpiece
 
Job boards are dead and the future of recruiting is social
Job boards are dead and the future of recruiting is socialJob boards are dead and the future of recruiting is social
Job boards are dead and the future of recruiting is social
 
Exploring the Lucrative Future of Influencer Marketing
Exploring the Lucrative Future of Influencer MarketingExploring the Lucrative Future of Influencer Marketing
Exploring the Lucrative Future of Influencer Marketing
 

Último

FULL ENJOY Call Girls In Mahipalpur Delhi Contact Us 8377877756
FULL ENJOY Call Girls In Mahipalpur Delhi Contact Us 8377877756FULL ENJOY Call Girls In Mahipalpur Delhi Contact Us 8377877756
FULL ENJOY Call Girls In Mahipalpur Delhi Contact Us 8377877756dollysharma2066
 
Monthly Social Media Update April 2024 pptx.pptx
Monthly Social Media Update April 2024 pptx.pptxMonthly Social Media Update April 2024 pptx.pptx
Monthly Social Media Update April 2024 pptx.pptxAndy Lambert
 
Famous Olympic Siblings from the 21st Century
Famous Olympic Siblings from the 21st CenturyFamous Olympic Siblings from the 21st Century
Famous Olympic Siblings from the 21st Centuryrwgiffor
 
Call Girls Pune Just Call 9907093804 Top Class Call Girl Service Available
Call Girls Pune Just Call 9907093804 Top Class Call Girl Service AvailableCall Girls Pune Just Call 9907093804 Top Class Call Girl Service Available
Call Girls Pune Just Call 9907093804 Top Class Call Girl Service AvailableDipal Arora
 
Call Girls in Gomti Nagar - 7388211116 - With room Service
Call Girls in Gomti Nagar - 7388211116  - With room ServiceCall Girls in Gomti Nagar - 7388211116  - With room Service
Call Girls in Gomti Nagar - 7388211116 - With room Servicediscovermytutordmt
 
Yaroslav Rozhankivskyy: Три складові і три передумови максимальної продуктивн...
Yaroslav Rozhankivskyy: Три складові і три передумови максимальної продуктивн...Yaroslav Rozhankivskyy: Три складові і три передумови максимальної продуктивн...
Yaroslav Rozhankivskyy: Три складові і три передумови максимальної продуктивн...Lviv Startup Club
 
👉Chandigarh Call Girls 👉9878799926👉Just Call👉Chandigarh Call Girl In Chandiga...
👉Chandigarh Call Girls 👉9878799926👉Just Call👉Chandigarh Call Girl In Chandiga...👉Chandigarh Call Girls 👉9878799926👉Just Call👉Chandigarh Call Girl In Chandiga...
👉Chandigarh Call Girls 👉9878799926👉Just Call👉Chandigarh Call Girl In Chandiga...rajveerescorts2022
 
Dr. Admir Softic_ presentation_Green Club_ENG.pdf
Dr. Admir Softic_ presentation_Green Club_ENG.pdfDr. Admir Softic_ presentation_Green Club_ENG.pdf
Dr. Admir Softic_ presentation_Green Club_ENG.pdfAdmir Softic
 
Value Proposition canvas- Customer needs and pains
Value Proposition canvas- Customer needs and painsValue Proposition canvas- Customer needs and pains
Value Proposition canvas- Customer needs and painsP&CO
 
Organizational Transformation Lead with Culture
Organizational Transformation Lead with CultureOrganizational Transformation Lead with Culture
Organizational Transformation Lead with CultureSeta Wicaksana
 
M.C Lodges -- Guest House in Jhang.
M.C Lodges --  Guest House in Jhang.M.C Lodges --  Guest House in Jhang.
M.C Lodges -- Guest House in Jhang.Aaiza Hassan
 
Mysore Call Girls 8617370543 WhatsApp Number 24x7 Best Services
Mysore Call Girls 8617370543 WhatsApp Number 24x7 Best ServicesMysore Call Girls 8617370543 WhatsApp Number 24x7 Best Services
Mysore Call Girls 8617370543 WhatsApp Number 24x7 Best ServicesDipal Arora
 
FULL ENJOY Call Girls In Majnu Ka Tilla, Delhi Contact Us 8377877756
FULL ENJOY Call Girls In Majnu Ka Tilla, Delhi Contact Us 8377877756FULL ENJOY Call Girls In Majnu Ka Tilla, Delhi Contact Us 8377877756
FULL ENJOY Call Girls In Majnu Ka Tilla, Delhi Contact Us 8377877756dollysharma2066
 
The Path to Product Excellence: Avoiding Common Pitfalls and Enhancing Commun...
The Path to Product Excellence: Avoiding Common Pitfalls and Enhancing Commun...The Path to Product Excellence: Avoiding Common Pitfalls and Enhancing Commun...
The Path to Product Excellence: Avoiding Common Pitfalls and Enhancing Commun...Aggregage
 
It will be International Nurses' Day on 12 May
It will be International Nurses' Day on 12 MayIt will be International Nurses' Day on 12 May
It will be International Nurses' Day on 12 MayNZSG
 
Cracking the Cultural Competence Code.pptx
Cracking the Cultural Competence Code.pptxCracking the Cultural Competence Code.pptx
Cracking the Cultural Competence Code.pptxWorkforce Group
 
Monte Carlo simulation : Simulation using MCSM
Monte Carlo simulation : Simulation using MCSMMonte Carlo simulation : Simulation using MCSM
Monte Carlo simulation : Simulation using MCSMRavindra Nath Shukla
 
Mondelez State of Snacking and Future Trends 2023
Mondelez State of Snacking and Future Trends 2023Mondelez State of Snacking and Future Trends 2023
Mondelez State of Snacking and Future Trends 2023Neil Kimberley
 

Último (20)

FULL ENJOY Call Girls In Mahipalpur Delhi Contact Us 8377877756
FULL ENJOY Call Girls In Mahipalpur Delhi Contact Us 8377877756FULL ENJOY Call Girls In Mahipalpur Delhi Contact Us 8377877756
FULL ENJOY Call Girls In Mahipalpur Delhi Contact Us 8377877756
 
Monthly Social Media Update April 2024 pptx.pptx
Monthly Social Media Update April 2024 pptx.pptxMonthly Social Media Update April 2024 pptx.pptx
Monthly Social Media Update April 2024 pptx.pptx
 
Famous Olympic Siblings from the 21st Century
Famous Olympic Siblings from the 21st CenturyFamous Olympic Siblings from the 21st Century
Famous Olympic Siblings from the 21st Century
 
Call Girls Pune Just Call 9907093804 Top Class Call Girl Service Available
Call Girls Pune Just Call 9907093804 Top Class Call Girl Service AvailableCall Girls Pune Just Call 9907093804 Top Class Call Girl Service Available
Call Girls Pune Just Call 9907093804 Top Class Call Girl Service Available
 
Call Girls in Gomti Nagar - 7388211116 - With room Service
Call Girls in Gomti Nagar - 7388211116  - With room ServiceCall Girls in Gomti Nagar - 7388211116  - With room Service
Call Girls in Gomti Nagar - 7388211116 - With room Service
 
Yaroslav Rozhankivskyy: Три складові і три передумови максимальної продуктивн...
Yaroslav Rozhankivskyy: Три складові і три передумови максимальної продуктивн...Yaroslav Rozhankivskyy: Три складові і три передумови максимальної продуктивн...
Yaroslav Rozhankivskyy: Три складові і три передумови максимальної продуктивн...
 
👉Chandigarh Call Girls 👉9878799926👉Just Call👉Chandigarh Call Girl In Chandiga...
👉Chandigarh Call Girls 👉9878799926👉Just Call👉Chandigarh Call Girl In Chandiga...👉Chandigarh Call Girls 👉9878799926👉Just Call👉Chandigarh Call Girl In Chandiga...
👉Chandigarh Call Girls 👉9878799926👉Just Call👉Chandigarh Call Girl In Chandiga...
 
Dr. Admir Softic_ presentation_Green Club_ENG.pdf
Dr. Admir Softic_ presentation_Green Club_ENG.pdfDr. Admir Softic_ presentation_Green Club_ENG.pdf
Dr. Admir Softic_ presentation_Green Club_ENG.pdf
 
Forklift Operations: Safety through Cartoons
Forklift Operations: Safety through CartoonsForklift Operations: Safety through Cartoons
Forklift Operations: Safety through Cartoons
 
Value Proposition canvas- Customer needs and pains
Value Proposition canvas- Customer needs and painsValue Proposition canvas- Customer needs and pains
Value Proposition canvas- Customer needs and pains
 
Organizational Transformation Lead with Culture
Organizational Transformation Lead with CultureOrganizational Transformation Lead with Culture
Organizational Transformation Lead with Culture
 
M.C Lodges -- Guest House in Jhang.
M.C Lodges --  Guest House in Jhang.M.C Lodges --  Guest House in Jhang.
M.C Lodges -- Guest House in Jhang.
 
Mysore Call Girls 8617370543 WhatsApp Number 24x7 Best Services
Mysore Call Girls 8617370543 WhatsApp Number 24x7 Best ServicesMysore Call Girls 8617370543 WhatsApp Number 24x7 Best Services
Mysore Call Girls 8617370543 WhatsApp Number 24x7 Best Services
 
FULL ENJOY Call Girls In Majnu Ka Tilla, Delhi Contact Us 8377877756
FULL ENJOY Call Girls In Majnu Ka Tilla, Delhi Contact Us 8377877756FULL ENJOY Call Girls In Majnu Ka Tilla, Delhi Contact Us 8377877756
FULL ENJOY Call Girls In Majnu Ka Tilla, Delhi Contact Us 8377877756
 
The Path to Product Excellence: Avoiding Common Pitfalls and Enhancing Commun...
The Path to Product Excellence: Avoiding Common Pitfalls and Enhancing Commun...The Path to Product Excellence: Avoiding Common Pitfalls and Enhancing Commun...
The Path to Product Excellence: Avoiding Common Pitfalls and Enhancing Commun...
 
It will be International Nurses' Day on 12 May
It will be International Nurses' Day on 12 MayIt will be International Nurses' Day on 12 May
It will be International Nurses' Day on 12 May
 
Cracking the Cultural Competence Code.pptx
Cracking the Cultural Competence Code.pptxCracking the Cultural Competence Code.pptx
Cracking the Cultural Competence Code.pptx
 
Monte Carlo simulation : Simulation using MCSM
Monte Carlo simulation : Simulation using MCSMMonte Carlo simulation : Simulation using MCSM
Monte Carlo simulation : Simulation using MCSM
 
Mondelez State of Snacking and Future Trends 2023
Mondelez State of Snacking and Future Trends 2023Mondelez State of Snacking and Future Trends 2023
Mondelez State of Snacking and Future Trends 2023
 
Mifty kit IN Salmiya (+918133066128) Abortion pills IN Salmiyah Cytotec pills
Mifty kit IN Salmiya (+918133066128) Abortion pills IN Salmiyah Cytotec pillsMifty kit IN Salmiya (+918133066128) Abortion pills IN Salmiyah Cytotec pills
Mifty kit IN Salmiya (+918133066128) Abortion pills IN Salmiyah Cytotec pills
 

LinkedIn growth potential in Asia

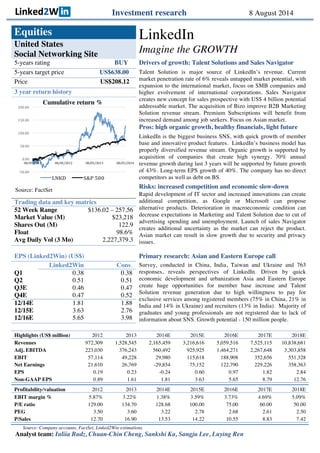
  • 1. Investment research 8 August 2014 Equities LinkedIn Imagine the GROWTH United States Social Networking Site 5-years rating BUY Drivers of growth: Talent Solutions and Sales Navigator 5-years target price US$638.00 Talent Solution is major source of LinkedIn’s revenue. Current market penetration rate of 6% reveals untapped market potential, with expansion to the international market, focus on SMB companies and higher evolvement of international corporations. Sales Navigator creates new concept for sales prospective with US$ 4 billion potential addressable market. The acquisition of Bizo improve B2B Marketing Solution revenue stream. Premium Subscriptions will benefit from increased demand among job seekers. Focus on Asian market. Price US$208.12 3 year return history Source: FactSet Pros: high organic growth, healthy financials, light future LinkedIn is the biggest business SNS, with quick growth of member base and innovative product features. LinkedIn’s business model has properly diversified revenue stream. Organic growth is supported by acquisition of companies that create high synergy. 70% annual revenue growth during last 3 years will be supported by future growth of 43%. Long-term EPS growth of 40%. The company has no direct competitors as well as debt on BS. Risks: increased competition and economic slow-down Rapid development of IT sector and increased innovations can create additional competition, as Google or Microsoft can propose alternative products. Deterioration in macroeconomic condition can decrease expectations in Marketing and Talent Solution due to cut of advertising spending and unemployment. Launch of sales Navigator creates additional uncertainty as the market can reject the product. Asian market can result in slow growth due to security and privacy issues. Trading data and key matrics 52 Week Range $136.02 – 257.56 Market Value (M) $23,218 Shares Out (M) 122.9 Float 98.6% Avg Daily Vol (3 Mo) 2,227,379.3 EPS (Linked2Win) (US$) Primary research: Asian and Eastern Europe call Linked2Win Cons. Survey, conducted in China, India, Taiwan and Ukraine and 763 responses, reveals perspectives of LinkedIn. Driven by quick economic development and urbanization Asia and Eastern Europe create huge opportunities for member base increase and Talent Solution revenue generation due to high willingness to pay for exclusive services among registered members (75% in China, 21% in India and 14% in Ukraine) and recruiters (13% in India). Majority of graduates and young professionals are not registered due to lack of information about SNS. Growth potential - 150 million people. Q1 0.38 0.38 Q2 0.51 0.51 Q3E 0.46 0.47 Q4E 0.47 0.52 12/14E 1.81 1.88 12/15E 3.63 2.76 12/16E 5.65 3.98 Highlights (US$ million) 2012 2013 2014E 2015E 2016E 2017E 2018E Revenues 972,309 1,528,545 2,165,459 3,216,616 5,059,516 7,525,115 10,838,681 Adj. EBITDA 223,030 376,243 560,492 925,925 1,464,271 2,267,648 3,303,858 EBIT 57,114 49,228 29,980 115,618 188,908 352,656 551,328 Net Earnings 21,610 26,769 -29,854 75,152 122,790 229,226 358,363 EPS 0.19 0.23 -0.24 0.60 0.97 1.82 2.84 Non-GAAP EPS 0.89 1.61 1.81 3.63 5.65 8.79 12.76 Profitability/valuation 2012 2013 2014E 2015E 2016E 2017E 2018E EBIT margin % 5.87% 3.22% 1.38% 3.59% 3.73% 4.69% 5.09% P/E ratio 129.00 134.70 128.68 100.00 75.00 60.00 50.00 PEG 3.50 3.60 3.22 2.78 2.68 2.61 2.50 P/Sales 12.70 16.90 13.53 14.22 10.55 8.83 7.42 Source: Company accounts, FactSet, Linked2Win estimations Analyst team: Iuliia Budz, Chuan-Chin Cheng, Sankshi Ka, Sangju Lee, Luying Ren -­‐50.00 0.00 50.00 100.00 150.00 200.00 08/05/2011 08/05/2012 08/05/2013 08/05/2014 Cumulative return % LNKD S&P 500
  • 2. 1 I. Industry Analysis As a unique corporation, Linkedin has involved in multiple industries. Based on its revenue streams (talent solution, marketing solution, premium subscription), we did research on three main industries that LinkedIn has already played a role in. That is recruitment industry, social network industry, and advertising and marketing industry. On the top of that, we also did research on the industry that LinkedIn is going to step in in this year, which is CRM industry. 1. The Social Networking Sites Industry 1.1. Industry overview (1) Industry definition The Social Networking Sites (SNS) industry is in the growth phase, because customer base increases and more services are conducted online. The main source of revenue of this industry is advertising (which effectiveness is boosted by leveraging significant amount of customer information). (2) Industry at the glance Exhibit 1 Life cycle stage Growth Regulation level Light Capital intensity Medium Technology change High Revenue volatility High Barriers to entry Medium Industry assistance None Industry globalization High Concentration level High Competition level High Source: IBIS SNS industry report 2014 (3) Key industry players The Social Networking Websites industry is dominated by Facebook (68.5% market share), LinkedIn (15.6% market share) and Twitter (12.2% market share). (4) Industry environment The industry is subject to significant investment and technological changes, where companies continue to innovate and capture emerging fields. The main elements of competition are the size of member and active user base of the network, net features and innovative products and integration with other Internet companies. The key players face growing competition from progressive startups and new products of big companies such as Google and Microsoft.
  • 3. 2 Exhibit 2 Positive tendencies - time spent on SNS escalates - customer base broadens - disposable income increases - advertising spending grows Negative tendencies - new companies enter the business - costumer’s privacy issues Source: IBIS, US SNS Industry, 2014 (5) Industry statistics SNS industry is quickly developing all over the world, with 60% concentration in the United States. The growth is predicted to continue in double-digit numbers in next 5 years. The industry revenue was growing at a 36.1% rate during past 5 years and will reach $8.6 billion in 2014. The revenue is projected to grow at a slower average 22.6% rate per year to $23.9 billion in 2019. The future of the industry will be driven by the expansion in Asia and Latin America. Exhibit 3 Source: IBIS, US SNS Industry, 2014 (6) LinkedIn uniqueness in SNS industry Unlike other SNS LinkedIn has more diversified sources of revenue: Premium Subscription, Marketing Solution, Talent Solution and recently developed Sales solution. At the same time the target auditory and services are properly defined. Other SNS generate revenue mainly from advertisement as the only source and do not specify target members. 0.0% 10.0% 20.0% 30.0% 40.0% 50.0% 60.0% 70.0% 80.0% 90.0% 100.0% 0 5,000 10,000 15,000 20,000 25,000 30,000 2011 2012 2013 2014E 2015E 2016E 2017E 2018E 2019E Growth % Revenue $m US SNS Industry Revenue ($m) Growth rate (%)
  • 4. 3 1.2. Premium Subscriptions (1) LinkedIn as global SNS LinkedIn is the biggest professional social network site with 313 million members in more than 200 countries available in 20 languages. The main value for users is the possibility to develop business connections in progressive way as well as take different approach for recruitment. Social networks usually propose to subscribe for free, but LinkedIn offers the option of Premium Subscriptions. This feature makes the business network to be more accessible and at the same time more valuable. (2) Premium subscriptions TAM The targeted market of LinkedIn can be characterized by 1) Total Addressable market of 3 billion people worldwide in long-term prospective, 2) The Segmented Addressable Market of 600 million of knowledge workers around the world (this number is expected to increase till 1 billion in the next 5 years), 3) The share of market is about 0.5-1% Member base increases over time, but the unique member base is quite lower than the total amount of members. The task of LinkedIn is to engage higher percentage of registered members to become unique users. We project the 10% future annual growth in amount of users and 17% annual growth in amount of active users in the next 5 years. The expected number of users in 2018 is 609 million of people. The main driver of the increase is the possibility to operate in Chinese market, increasing urbanization and the higher involvement of actual users by adding new features in the platform. Apart from the member base growth the monetization of users plays an important role for revenue generation. Revenue per members shows growth during each quarter and one member produced $5.52 of revenue in 2013, revenue per unique visitor reached $13.5 and revenue per 100 views fluctuates more significantly than other variables with $1.91 per 100 views. The monetization of users shows an increasing tendency. Source: IBIS, US SNS Industry, 2014 - 0.50 1.00 1.50 2.00 2.50 3.00 3.50 4.00 Q12012 Q22012 Q32012 Q42012 Q12013 Q22013 Q32013 Q42013 Q12014 Q22014 $ Revenue variables Rev/ 100 views Rev/ member Rev/ unique 161 313 609 50 84 185 500 600 1000 0 200 400 600 800 1000 Million people Memberbase increase Members Unique visiting members Knowledge worker (SAR)
  • 5. 4 (3) Premium subscribers Premium subscription revenue increased 60% in 2013 and is expected to increase more than 40% in 2014. There are two main factors that drives this: 1) increase in the number of subscribers and 2) switch of actual users to the more expensive subscription plans. The number of subscribers increased at list 340,000 since 2012 and is estimated to be between approximately 0.88 million people (0.7-1.1mln people). This number represents 0.27% of total users and 1% of unique users. The average amount paid is approximately $40 ($30-$50). Exhibit 5 Source: LinkedIn, Linked2Win, 2014 (4) Key drivers The subscription model of revenue generation is usually very stable. LinkedIn Premium Subscription revenue is projected to increase in next 5 years due to many factors: 1) global economy growth and increased spending capacity, 2) member base growth (with focus on developing markets), 3) increasing amount of unique members that wish to buy premium subscription, mainly job seekers, 3) rising amount of business people that want to improve their network in LinkedIn due to huge database, 4) the convenience of LinkedIn mobile application, 5) growing amount of annual subscriptions for business. (5) Revenue projections Amount of subscribers grew more than 50% during past few years. In 2015 Sales Solution will be considered separately that’s why we assume that the amount of subscribers will increase only 20% in 2015 and will increase significantly in 2016 due to increase in Chinese market and more graduates willing to find a work with the help of LinkedIn. The average price is estimated to be $40 and will decrease till $36 due to higher share of job seekers in premium subscriptions. The long-term growth will be on the level of 25-30% annually. 0.00 0.50 1.00 1.50 2.00 20 24 30 40 48 60 70 75 Job seaker Business Business+ Executive Premium subscribers, mln people Premium subscribers estimation 2012 2013 Q1 Q2
  • 6. 5 Exhibit 6 - Premium subscription revenue projection, 2014-2018 (in thousands of $) Source: LinkedIn, Linked2Win, 2014 2. Marketing Solution 2.1. Industry overview (1) Advertising industry growth The advertising industry shows global growth possibilities over next 5 years, due to the world economic growth predictions and higher involvement of developing countries in the market. (2) Media advertising market statistics America is the world’s largest advertising and media market. At the same time, China, India, Latin America and Easten Europe are the fastest growing regions with 10% growth yearly in last 5 years. Western Europe market remains slow because of high unemployment rates and economic slowdown. It is predicted that market share of developing markets will increase from 25% in 2014 to 33% in 2018. (3) Digital advertising TAM The overall advertising landscape is directed by digital advertising, which is the most dynamic and significant part of media advertising. The audience, amount of advertisers of different scales and diversity of advertising increases significantly. For 2013, global digital advertising spending reached $120.05 billion, $140.15 billion is predicted for 2014 and double-digit growth is expected to push the market till 2016. Digital advertising composes one-quarter of the market, however, Its market share is expected to reach one-third in 2018. US still have the biggest digital advertising market (38%), Asia-Pacific region has 28% and Europe has 25% of the market. European countries 2013 2014E 2015E 2016E 2017E 2018E Total Revenue ($ thousands) 306,511 456,000 518,400 777,600 1,143,072 1,657,454 Average price ($) 40 38 36 36 36 36 Premium subscribers (1000/month) 639 1,000 1200 1800 2646 3836.7 Premium subscribers Growth (%) 61% 57% 20% 50% 47% 45% Number of users 276,842 345,000 420,000 495,000 560,000 610,000 Premium subscribers / Users 0.23% 0.29% 0.29% 0.36% 0.47% 0.63% Avg Rev / User 1.11 1.32 1.23 1.57 2.04 2.72 Unique 76000 92,534 112,374 136,400 156,562 184,798 Premium subscribers / Unique 0.84% 1.08% 1.07% 1.32% 1.69% 2.08% Total Addressable Market (people) 560,000 650,000 730,000 815,000 915,000 1,000,000 Total Addressable Market 620,015 859,130 901,029 1,280,291 1,867,698 2,717,138 Market Share 49% 53% 58% 61% 61% 61% PS Revenue growth % 60.94% 48.77% 13.68% 50.00% 47.00% 45.00%
  • 7. 6 have higher share of digital advertising to total media than USA (UK – 47.5%, Denmark – 40%, Australia - 37.5% and USA - 28%). Exhibit 7 So source: eMarketer.com, June 2014 Sou source: eMarketer.com, June 2014 (4) LinkedIn for professional marketers Marketers use social media platforms professionally in B2C and B2B marketing. In B2C market, Facebook has leading position as 97% of marketers usage. In B2B marketing, LinkedIn together with Facebook and twitter are highly used (over 85%). LinkedIn is used in business sector more actively than in B2C due to the specialization of the social platform. In the future, the company will be more focused in B2B after the acquisition of Bizo. Exhibit 8 Source: Statista, 2014 104.57 120.05 140.15 160.18 178.45 196.05 213.89 20.4% 14.8% 16.7% 14.3% 11.4% 9.9% 9.1% 32.3% 0.0% 10.0% 20.0% 30.0% 40.0% 50.0% 60.0% 70.0% 0 50 100 150 200 250 2012 2013 2014 2015 2016 2017 2018 Digital advertising (Worldwide) Digital advertising spending % change % of total market 503.15 516.2 545.4 574.18 604.77 633.85 662.73 4.4% 2.6% 5.7% 5.3% 5.3% 4.8% 4.6% 0.0% 10.0% 20.0% 30.0% 40.0% 50.0% 60.0% 70.0% 0 100 200 300 400 500 600 700 800 2012 2013 2014 2015 2016 2017 2018 Media advertising (Worldwide) Media advertising spending % change 97% 81% 60% 59% 89% 86% 52% 88% 0% 10% 20% 30% 40% 50% 60% 70% 80% 90% 100% Facebook Twitter YouTube LinkedIn Marketers usage of Social Media B2B B2C
  • 8. 7 (5) LinkedIn DA market penetration LinkedIn is a small player in the social media advertising industry (less than 1%). The company has increased its market share in the digital advertising market and it is estimated that in 5 years LinkedIn will capture 1.3% of the market , which is 2.5 timer bigger than that in 2013 (0.5%). Exhibit 9 - Digital advertising revenue share, by Company, 2012-2018 % of total digital ad revenue 2012 2013 2014 2015 2016 2017 2018 Google 40.9% 39.9% 40.8% 42.3% 41.8% 41.5% 41.3% Facebook 5.9% 7.4% 8.2% 9.0% 9.2% 9.5% 9.8% Twitter 0.6% 1.0% 1.6% 2.2% 2.4% 2.6% 2.8% LinkedIn 0.4% 0.5% 0.7% 0.9% 1.1% 1.2% 1.3% Total 36.8 42.6 48.1 53.4 59.8 64.5 71.0 Source: Emarketer.com, 2014 (6) Key drivers The main drivers in DA industry are: a. Amount of registered members. Positive trend for LinkedIn. b. The engagement of people: pages viewed and time spend. People that use LinkedIn for free have limitations, spend less time and make less pages views on the site than premium subscribers. With the introduction of Pulse publishing, average time spending started to increase. Mobile application improved the amount of unique members as well, as they constitute 45% of the total members. c. Targeting and measuring. LinkedIn present more detailed and systemized database for marketers than other social network sites, making targeting easier and more successful. LinkedIn released its own Ad API as well as other technical innovative features to make marketing more efficient. d. Average price. As the targeted auditory can be reached more easily, advertised will admit paying more to reach higher efficiency. (7) Competitive analysis The biggest social networks that generate revenue from digital advertising are Facebook, Twitter and LinkedIn. People are the most actively involved if Facebook with big amount of active users, page views and time spent. This results in high digital advertising revenue. DA Rev/ 1000 views of $0.5 is small compared to $1.6 of Twitter and $4.2 of LinkedIn, but each user sees more than 15000 pages resulting in $7.6 in DA Rev/ Active user, what is higher than $3.0 of Twitter and LinkedIn. LinkedIn have good chances to improve DA revenue per active user, as each view generates more revenue than that of Facebook and involvement is expected to increase.
  • 9. 8 Exhibit 10 - Competitive analysis, 2014, in thousands of $ Active users Views Time spent DA-Rev DA-Rev/ Active user DA-Rev / 1000 view Market cap P/E P/Rev Facebook 1,320 20,026 24 min 10,013 7.6 0.5 190,250 95 19.00 Twitter 271 504 3 min 807 3.0 1.6 25,610 430 26.58 LinkedIn 84 95 1 min 398 4.7 4.2 25,410 114 13.54 Source: comScore, Factset, Linked2Win (8) Revenue projections We assume that number of unique members will increase with the growth of pages views and time spent per person, due to recently introduced additional useful features in LinkedIn and future product development as well as increasing member base for networking. Revenue per unique visitor is estimated to grow due to better search targeting abilities and more successful business advertising that in other sites. USA and other countries market penetration will grow quickly. US will remain the main market in the next 5 years, developing countries market will move up rapidly. Exhibit 11 - Marketing Solutions revenue projection, 2014-2018 In thousands of $ 2013 2014E 2015E 2016E 2017E 2018E Total Revenue 362,000 463,970 655,493 908,950 1,183,528 1,462,841 Revenue growth 40% 28% 41% 39% 30% 24% Unique visitors 76,000 92,534 112,374 136,400 156,562 184,798 Pages views 83,000,000 107,900,000 145,665,000 189,364,500 236,705,625 284,046,750 Pages views growth 62.7% 30.0% 35.0% 30.0% 25.0% 20.0% Rev/ Unique 4.76 5.01 5.83 6.66 7.56 7.92 Rev/1000views 4.36 4.30 4.50 4.80 5.00 5.15 Pages / Unique 1,092 1,166 1,296 1,388 1,512 1,537 TAM 120,000,000 140,150,000 160,180,000 178,450,000 196,050,000 213,890,000 USA TAM 42,600,000 48,100,000 53,040,000 58,000,000 64,500,000 71,000,000 Other countries TAM 77,400,000 92,050,000 107,140,000 120,450,000 131,550,000 142,890,000 USA penetration 0.5% 0.6% 0.8% 1.0% 1.2% 1.3% World penetration 0.3% 0.3% 0.4% 0.5% 0.6% 0.7% USA Revenue 213,000 288,600 413,712 580,000 741,750 923,000 Other Revenue 149,000 175,370 241,781 328,950 441,778 539,841 USA % growth 44.7% 35.5% 43.4% 40.2% 27.9% 24.4% Other % growth 34.5% 17.7% 37.9% 36.1% 34.3% 22.2% US / World % 58.8% 62.2% 63.1% 63.8% 62.7% 63.1%
  • 10. 9 3. Recruiting industry 3. 1. Industry overview (1) Industry Definition The recruitment industry is composed of 1) Employment Placement Agencies, 2) Temporary Help Services and 3) Professional Employer Organizations that provide recruiting service for various business enterprises. The main source of revenue is service fee from the corporate. (2) Industry environment (trends) With the evolving of online recruit service providers such as LinkedIn.com and Monster.com, more companies are in the transition of managing their own recruiting by posting job listings online and job seekers also find employment via online postings. Due to these recent trends, traditional recruitment agencies are facing severe competitive threats. (3) Industry Statistics According to the IBIS Worlds(2014), the revenue of US Employment & Recruiting industry has grown at an annualized rate of 1.8% to $12 billion over the five years up to 2013, and it is estimated to remain stagnant (0% growth) over the next five years. This is mainly due to the recent recession and the astonishing growth of online recruit industry. During the same period, the revenue of LinkedIn has grown to $1.5billion (CAGR of 54.5%). In 2013, the US was the largest market with 34% of share, followed by Japan with 13% and the UK with 11%. Europe as a whole represented 35% of the global staffing market in 2013. The Emerging Markets accounted for 10%.1) 3.2. Industry Dynamic (1) Key External Drivers  Economic conditions (Economic cycle) The recruit industry is adaptive to the economic conditions. The revenue of industry directly related to the new job opening and unemployment rate. In addition, there is far less employee turnover when economic conditions are uncertain because employed workers are less inclined to pursue a new position when the labor market has few suitable openings. However, the online recruitment industry is less vulnerable to the economic conditions. This is because many corporate 1 Adecco group, Annual Report 2013,p.8
  • 11. 10 bring recruitment functions in-house in order to reduce the cost and the revenue from the job seeker (subscription revenue) tends to increase.  Employee turnover rate Not only the new job openings but also job turnover rate influences the demands of recruiting services. The employee turnover rate is influenced by the internal factors such as salary level, job satisfaction and external factors such as law and regulation, culture and labor market flexibilities.  Corporate profit The industry is sensitive to the corporate growth, which affects the demand for labor. (2) Key Internal Drivers  Access to highly skilled workforce The competitive edge of the recruit company depends on the pool of the highly skilled employees involved in their network. As the number of professional users increase, more and more corporate customer will be enticed to enter into the network. This network effect has been leveraging the growth of online recruit industry. LinkedIn has been gaining more users because it has been able to entice both registered users (potential employees) and corporate customer to join into its platform.  Ability to quickly adopt new technology New technology is vital. The prevalent use of the internet in order to provide information on job vacancies and the review of resumes by employees and employers, the optimized search engine to find most appropriate workforces have been changing the business process and competitive advantages among players.  Providing client confidentiality It is crucial to ensure confidentiality of operation and secure privacy of registered users and clients. 3.3. Competitive environment
  • 12. 11 (1) Recruit agency industry The recruit agency industry in US is highly fragmented. The major player measured by revenue are Adecco Group ($950million, market share: 8.1%) and Randstad Holding ($800million, market share: 6.8%). Those companies offer a various service related to HR, such as temporary staffing, permanent placement, career transition and talent development and in-house solution & HR solution. The remnant market is shared by a large number of small enterprises. (2) Online recruit industry Except for the dominant player, LinkedIn, other meaningful player in the online recruitment industry is Moster.com. Since established in 1999, Monster.com has been one of the largest employment website in the world. As of 2013, Monster.com has more than 200 million of registered users, with a local presence in more than 40 countries. The company’s revenue is primarily generated from the placement of job postings (Careers-North America: 55% and Careers-International: 36%) and internet advertising & fees (9%). Monter.com’s financial performance has been poor in recent year due to the recessive condition and direct competition with LinkedIn. In 2013, Moster.com’s revenue was $808million (YoY -9.3%), which represent 5- year average growth rate of -1.58% and net loss was $0.2million2) 3.4. Revenue Projection In 2013, LinkedIn’s Talent Solution revenue was $859 million which consists of 56% of total revenue. Talent Solution revenue comes from the subscription fee from LinkedIn Corporate Solutions, LinkedIn Jobs and Subscriptions and has two main customer bases: corporate user and professional organizations. According to the LinkedIn’s 2013 10K, the number of corporate solution users are 24,444. Up to 2013, the annual growth rate of revenue was 12.9%. The annual growth rate of number of corporate solution user and ARPU were each 98.2% and 11.4%. 2) Monster.com, Annual Report 2013, p.5
  • 13. 12 Exhibit 12 Note: In order to estimate the forward 5year Talent Solution revenue, we used this model Talent Solution revenue = TAM (Total Addressable market) x Penetration rate of Linked x ARPU (Average Revenue per user) (1) Estimation of TAM In order to estimate LinkedIn’s TAM, we estimated the number of corporate by employment size and assumed that LinkedIn’s primary target is corporate with 500+ employees and second target is corporate with 100~499 employees. Exhibit 13 - Number of companies by employment size in 2013 500+ 100~499 100+ US 17,671(26%) 81,243(18%) 98,914(19%) International 50,762(74%) 382,917(82%) 433,678(81%) Total 68,433(100%) 464,160(100%) 532,592(100%) Source: US Census Bureau, OECD, Government of Canada, Statistics Bureau of Japan, Brazilian Institute of Geography and Statistics, Indian Ministry of Statistics and Programme Information, Chinese Ministry of Commerce, EROP-GCC, ACRA (Singapore), IMF, UBS estimates After then, we projected future TAM by using the assumption of annual growth rate of 1%. We were not able to find the international Corporate’s growth rate. However, according to concensus.gov, The Number of US corporate has grown at 0.8% per year. 182% 156% 101% 64% 0% 50% 100% 150% 200% $0 $200 $400 $600 $800 $1,000 2009 2010 2011 2012 2013 Growth rate Revenue(Million) Talent Solution Revenue and Growth rate 144% 139% 78% 49% 0% 20% 40% 60% 80% 100% 120% 140% 160% - 5,000 10,000 15,000 20,000 25,000 30,000 2009 2010 2011 2012 2013 Growth rate Corporate Solution User Corporate Solution Uesr and Growth rate 16% 7% 13% 10% 0% 2% 4% 6% 8% 10% 12% 14% 16% 18% - 5.0 10.0 15.0 20.0 25.0 30.0 35.0 40.0 2009 2010 2011 2012 2013 Groth rate ARPU($thousand) ARPU and Growth rate
  • 14. 13 Exhibit 14 - The projection of TAM 2013 2014 2015 2016 2017 2018 Corporate +500(Global) 68,433 69,117 69,809 70,507 71,212 71,924 Corporate +100(Global) 413,398 417,532 421,707 425,924 430,184 434,485 Source: LinkedIn (2) The estimation of Penetration rate of LinkedIn Using those data, LinkedIn’s current market penetration rate corresponds to 36% of Global Corporate with 500+ employees or 6% of Global Corporates with 100+ employees. Although LinkedIn does not publish geographic segment data of Corporate solution users, considering the proportion of total revenue (US 40%: International 60%), current market penetration rate of US market is estimated higher than this simple estimation. Since LinkedIn’s business model is still eroding and there are no precedents, it was impossible to estimate the target penetration rate for 5 years. We approached reverse to get the target growth rate of Corporate user which corresponds to make its penetration rate of 20% of Global 100+ corporate in 5 years. With this assumption, we get Linkedin’s annual growth rate of corporate user as 30%. This looks like somewhat aggressive assumption, because in 2013 the number of US Corporate with +100 is 19% of total Corporate. However, considering the Linkedin’s strategy of expansion to the international market, we think this assumption is not too unrealistic. Exhibit 15 – Talent Solution Penetration rate 2013 2014 2015 2016 2017 2018 Corporate +500(Global) 36% 46% 59% 76% 98% 100% Corporate +100(Global) 6% 8% 10% 13% 16% 20%
  • 15. 14 (3) The Estimation of ARPU Up to 2013, the annual growth rate of ARPU has been 11.4%. Generally, as company’s penetration increase up to market saturation point, the ARPU have to decrease due to the increase in competition and price strategy to enlarge more customer base. However, considering the monopolistic statute of LinkedIn and the growth potential of ‘network effects’. We used this historic growth rate (11.4%) to estimate the ARPU. 4. CRM industry 4.1. Industry overview Custom relationship management (CRM) industry is a fairly matured industry, especially in the U.S. and Europe. A study from Computer Science shows that approximate 51% of organizations in the U.S. has adopted CRM (Computer Science, 2012). And the adoption trend shows the percentage will keep going up in the next five years. The easily accessible of computer technology makes the entry barrier of the CRM industry comparative low. However, the numbers of CRM firms in the United States is decreasing by 1.6% annually (IBISWorld, 2014). Because of the comparative power of small companies is way lower than the biggest three player, which occupied around 80% of market share in the industry (IBISWorld, 2014). (1) Industry Trends As CRM Revenue Worldwide Trend shows below, the revenue of the industry grows stably in recent years. The total market in 2013 exceed $14 billion. However, the growth rate has decreased from 26.3% in 2011 to 20.7% in 2012, and it will keep decreasing. The downward trend of growth rate indicates that the traditional CRM industry that contribute more than 70% of the total revenue is getting close to saturation. Unlike the traditional CRM, one of the sub industry of CRM – Social Network CRM – is standing at the beginning. Companies like LinkedIn is opening a new market of CRM by connect sales people and the world in different ways. And the revenue from social network CRM software will be more and more important in the future.
  • 16. 15 (2) Geographical Distribution As what we mentioned before, CRM industry is a mature industry in the United States. In 2013, the revenue that come from America contributed 50% of the total. And the entire America region contributed 66% of the total. Western Europe as the second biggest market contributed around 22% of the total. While the revenue from Asia Pacific area, which include China, Japan, Korea, etc., is only contributed 10% of the total. As the fast growing of the economics in Asia, the potential market is incredible big. Exhibit 15 Source: Gartner Source: Gartner 4.2 Industry Dynamic (1) External Driver  Economic environment Economic environment has a strong positive effect on the CRM industry. Under a good economic condition, the blooming of business and human resource will create a huge data base for corporations. Managers need to deal with their customer, their business, and their employee in an efficient way. Customer relationship management system is needed eagerly. Adversely, under a bad economic condition, most of corporations, especially small corporations, don’t need a third party to deal with their data. On the top of that, the price of the CRM system are comparatively high, they might unable to afford those payment. 0.0% 5.0% 10.0% 15.0% 20.0% 25.0% 30.0% - 5,000.00 10,000.00 15,000.00 20,000.00 25,000.00 30,000.00 CRM Revenue Worldwide Trend Total Revenue Total Growth Rate America50% Other America16% EMEA24% APAC10% CRM Regional Revenue in 2013 America Other America EMEA APAC
  • 17. 16  Development of e-commercial Market Custom relationship management industry is highly rely on the e-commerce market. CRM system can watching and measuring the performance of businesses. It’s not only helping managers to make the right decision, but also save managers a lot time to deal with other more important things. Thus, with the development of the e - commerce market, CRM industry is going to grow as well. (2) Internal Driver  Website Performance The website performance includes how webpage been designed and structured, how easy to understand, and how fast webpage can be reached. The website performance is one of the most important criteria for potential customer to decide whether they want to explore more in the software. And it is also important to existed clients. Clients have limited patient to deal with website’s bugs, such as a page does not show propriety, or it take too long to open a sub page.  Customers Satisfactions Customers satisfactions includes how the function of the software satisfied clients’ needs, and how fast can the software adopt new technology. With the development of the technology, customers’ loyalty to a platform/software is getting lower and lower. A new technology has ability to dilute market share unpredictably. (3) The role of LinkedIn in CRM industry Unlike most of existed cooperation in the CRM industry, LinkedIn built a brand new business model. Based on its unique personal profile data, Sales Navigator – the new product that LinkedIn launched recently – is going to provide more accurate information that a sales person need, make sales work more efficient, and easier to get in touch with the right person. On the top of that, the local website that LinkedIn open in China in this year may open the CRM market in Asia.
  • 18. 17 4.3 Sales Solution Revenue The new product –Sales Navigator -- announced by LinkedIn on July 31, 2014 is a revolution of sales perspective. As a social network CRM software, Sales Navigator is mainly designed for sales people in the B2B industry. Based on LinkedIn’s data system, sales people are able to target to the right person for their business, familiar with the person by read his/her profile online, and ask shared connections for introduction. LinkedIn’s sales solution is not only make sales easier and more efficient, but also open a whole new revenue stream for itself. Based on our conservative analysis, the annually revenue from sales solution is able to exceed one billion dollars in five years. (1) Estimation of TAM (Total Addressable Market) The model is aim to find out the total numbers of both existed and potential sales people for LinkedIn (TAM), as well as the reality of the numbers of sales can LinkedIn reach in the real (SOM). Based on reliable assumptions of growth rate and percentages, finding out the revenue from Sales Solution. (2) Predict Model The core assumption of revenue from the sales solution is: Total Revenue = Numbers of Sales People x Price of Sales Navigator Where: Numbers of sales people refer to salespeople who registered on LinkedIn in the certain year Price of Sales Navigator is weighted by percentage of people who is going to pay times by price listed. (See Appendix 2) (3) Total Addressable Market Based on all analysis above, the result of the total addressable market (TAM) and the total realized market (SOM) in the United State has been showed in table.4. And the result of the total addressable market (TAM) and the total realized market (SOM) in the area other than the United States is showed in table.5. As it shows in the U.S. market, LinkedIn is getting close to 100% of total addressable market. However, in the international market, excluded the United States, LinkedIn will reach approximate of 50% of the total addressable market.
  • 19. 18 Exhibit 16 (4) Scenario Analysis LinkedIn has list three price of the sales solution: $23.99/mo, $47.99/mo, and $74.99/mo. If the client chose to pay annually, the monthly payment will be slightly lower. So the condition of pay in annually has not been considered in all of three scenarios. Percentage in tables refers to the percentage of people who will pay the certain amount of money monthly. a. Base case Price 2014 2015 2016 2017 2018 $0.00 100% 97% 93% 89% 85% $23.99 0% 3.0% 6.0% 9.0% 12.0% $47.99 0 0.0% 0.6% 1.2% 1.8% $74.99 0 0.0% 0.3% 0.6% 0.9% Revenue - $238,269,294 $758,687,595 $1,410,969,363 $2,231,019,749 b. Higher case Price 2014 2015 2016 2017 2018 $0.00 100% 95% 89% 82% 76% $23.99 0% 5% 10% 15% 20% $47.99 0 0 1.0% 2% 3.0% $74.99 0 0 0.5% 1.0% 1.5% Revenue - $397,115,490 $1,200,325,820 $2,193,434,614 $3,427,953,933 c. Lower case Price 2014 2015 2016 2017 2018 $0.00 100% 99% 97% 95% 93% $23.99 0% 2% 3% 5% 6% $47.99 0 0% 0% 1% 1% $74.99 0 0% 0% 0% 0% Revenue - $119,134,647 $392,331,366 $732,038,256 $1,157,207,668
  • 20. 19 II. PORTERS FIVE FORCES ANLYSIS In order to get a detailed knowledge of the LinkedIn’s competitive structure, our team has decided to continue industry analysis further by using the Porters five forces Model. This model provides with the insights regarding the influence of current competitive position and helps to understand the varied factors that have a major role in strategy development. Moreover, this model helps to understand the degree of vulnerability of the company’s different segments. 1. Threat of new entrants When we consider both the business models of social industry i.e. *Business-to-Business or Business-to-Customers we see that’s the level of entry barriers is still a question to debate because on one side it’s difficult for new entrants to invest huge capital and get the large customer base and reach to the level where LinkedIn is currently and on the other side it’s also provides the new players with opportunity to study and analyze the market carefully and collaborate with other big companies to render their services which could later post threat to LinkedIn. The new entrants can pose challenge for established companies like LinkedIn by altering their costs according to the client’s budgets. But the technologies and the brand name that LinkedIn has acquired over the years makes it difficult for the new entrants as they have to acquire these before effectively competing with a firm which has proved itself as the dominant leader in its industry. Therefore firm like LinkedIn have the competitive advantage over its rivals as they have the ability to employ the new technologies, economies of scale and scope, huge capital investment, humongous customer base and a strong brand name. 2. Threats of substitute’s products LinkedIn has created a brand for themselves by continuously innovating the products and services they offer and as a result they have gained the trust of their customers which has further helped them to establish themselves as the leader in their industry. Nevertheless, it still faces competition from the other various companies and the online marketing alternatives*. In case of the competitors the Price/purchase tradeoff has to be take into consideration since the customers are generally vulnerable to the prices, they may at one side give off performance if offered low price on the other hand can also go for higher prices if the performance is increased.
  • 21. 20 3. Rivalry against Existing firms Rivalry against existing firms is moderate because LinkedIn has significantly proved them as the leader in the industry but this can be effected by the continuous changes in the customer expectations as well as because of the vigorous market of social media. However, LinkedIn provides a lot of options and features to its consumers (whether free or paid) thus targeting and capturing the different segments. Currently LinkedIn is facing competition from Facebook and Twitter in social media, Monster, CareerBuilder and Indeed.com in talent solutions and Salesforce, SAP, oracle in the marketing segment. Additionally various competitors in social media like Xing and Viadeo who were focused only in Europe initially have redeveloped their strategies by expanding to new segments and increasing their presence globally. Nevertheless, LinkedIn unique business model and its increasing user base has helped them to grow substantially and create a monopoly for them in the market. Entering into the Chinese market from henceforth will help them to grow further more in comparison to the other competitors. 4. Bargaining powers of buyer Bargaining power of buyers is between low to moderate as there is no concentration and no switching costs and LinkedIn has established themselves as the undisputed leader in the industry. Since the customer belong to varied segments from individuals, enterprises and corporate organizations there is low power to bargain due to absence of the concentration to a specific segment. Nevertheless, maintaining of the brand reputation is really important for LinkedIn as the company has created its name over the years and a small negative event can lead to movement of their customers to other options available. Additionally the company has to change is models according to the customer expectations by continuously adapting to the changing needs of their customers and by innovation. Furthermore, we also see that there are no switching costs so a customer can easily switch to other alternatives. But in case of LinkedIn who have exhibited as an undisputed leader in the market will have a positive effect of this as more customers will join the network because of the limited choices available to them and thereby users have more reasons to stay with the network.
  • 22. 21 5. Bargaining power of Suppliers Bargaining power of Suppliers is low because the company has a global presence and it targets various different professional segment in the online services. The various acquisitions by LinkedIn like slide-share and pulse have allowed the company to reach different potential segment in the market, thereby helping them to position themselves strong in comparison to the other suppliers. III. COMPANY ANLYSIS 1. Business Analysis We have use Business model Canvas in order to evaluate the business of the LinkedIn. The business model canvas helps us to evaluate the value proposition, different revenue stream and key profit drivers. 2. Value proposition LinkedIn strategy has been focusing on placing its members first and following their core value proposition of connecting talent with the right opportunity at massive scale. In order to put this idea into practice they focus on three main areas namely: Professional Identify, Networks and Knowledge and all these areas have a strategic objective attached to them. In case of professional identity it is the professional profile record of the members i.e. the company wants the user to leverage all the tools of LinkedIn in an efficient manner so that members can be found by professional’s .They want to work towards replacing the resumes by the profiles. In case of Networks the company objective is to connect all the worlds’ professionals i.e. 600 million knowledgeable, students and pre-professionals. Further in case of knowledge the objective is to establish LinkedIn as a definitive professional publishing platform. Additionally, they want to be a start of any sales opportunity (sales solution) and provide an effective way for marketers to engage professionals. When delivering value to its customers, LinkedIn again has 3 parameters with each having their strategic objectives namely being Hire, market and sell. With regard to hiring they want powering half of the hires by establishing them as the leading platform for passive recruiting scale while for market solutions they want to be the effective market to engage professionals while for the sales solution they want to be the start of every sales opportunity.
  • 23. 22 3. Cost structure The cost structure of LinkedIn have been quite stable over the years with Cost Of Goods Sold steady at 13% of revenue, Sales and Marketing at stable 32-34% of revenue, Product Development stable at 26% of revenue ,General and Admin at stable 13-15% of revenue and D&A at stable 9% of revenue. 4. SWOT ANALYSIS LinkedIn is one of the fastest growing social media company which has outperformed all its competitors that recently went public and as a result the stocks have been reaching all-time highs. The company has been expanding globally but the competition in the social industry is also increasing rapidly. So, we therefore decide to do a SWOT analysis in order know about the future probabilities. 4.1 Strengths  Revenue Model LinkedIn uses a unique and a strong business model with its revenue streaming from its different segments namely Talent solutions, Premium subscriptions, Market solutions and sales solutions. However, the major portion of the revenue flows from the recruiting portal i.e. the talent solutions which amounts to almost more than 50% of the revenue. The revenue has been increasing on an average of 38% per year in comparison to its competitors like Monster whose market share to a large extent is being hampered by LinkedIn.  First mover and huge user base It’s evident that LinkedIn enjoys a Monopoly in its industry and have proved themselves as an undisputed player in the professional networking market by effectively using its status of being the first mover by properly predicting the future trends, thereby positioning themselves very strongly in the social media category . Additionally, the LinkedIn has been able to increase the dominance in the market due to rapidly increasing user base of LinkedIn which accounts to approximately 313 million.
  • 24. 23  Trusted by corporate clients LinkedIn has been trusted by its corporate clients and a proof to this is its increasing number in corporate clients which have reached to 28,080 by 2Q14. Furthermore, the company has establish long term contracts with these clients which have helped them with a constant flow of revenues. 4.2 Weakness  User involvement The user involvement numbers have not been growing in the same trend due to Limited access to all members, though the numbers have increased since past years but still some actions can be taken in order to increase and enhance the engagement of users. It can also change its strategy for mobile apps in order to increase the user involvement as more and more people are shifting to mobile applications. It had increased to 45% from 30 % in the last year. But LinkedIn is still not using its mobile application to the fullest capacity to enhance the customer experience.  Highly dependent on online recruitment The company highly rely on the size of the recruitment business to increase its revenues in future. Additionally more than half of the revenues come from talent solutions and also it contributes the largest to sales. As a consequence, LinkedIn is perceived as online recruiting website more than a social media and networking  Cultural differences One of the main problems that LinkedIn has to deal with expanding its global reach is the cultural differences. Since different companies have different work culture, LinkedIn faces difficulty in understanding and connecting those companies.
  • 25. 24 4.3 Opportunities  Advertising The advertising business of the LinkedIn is not growing on the same pace as it is for other segments and the company has a very large scope in the advertising market wherein they can efficiently utilize the data of their users and provide them with additional advertisements in order to increase its revenue. Its earn a smaller proportion to other companies like Facebook. Thus LinkedIn should use this segment more in order to increase its revenue further.  Content platform The company has by far done an excellent job to grown them as a platform for publishing and content sharing. The application influencers has been very successful in bringing the famous and successful leaders and sharing their opinions with the users. It has also been successful in content sharing through its applications like slide share. So the company can increase and improve the user involvement and experience by continuously innovating in these applications which would further increase the revenues. The company can also integrate various others features like Skype/IM in order to improve the communications. 4.4 Threats  Upcoming social platforms The various new social platforms whether directly related to the market or not are competing with LinkedIn in terms of users. They not only fight for the users but also for the time spent by these users on other website. Companies like Facebook are competing with LinkedIn for the users.  Unreliability of data There is a possibility that some users in LinkedIn might put inaccurate data or skills about themselves or might use the site for wrong purposes can lead to damaging the reputation of LinkedIn.
  • 26. 25 5. M&A Evaluation Exhibit 18 - List of the LinkedIn acquisitions Source: LinkedIn LinkedIn has taken a very cautious approach toward the acquisitions. Despite being in a fast- growing stage, it did only eleven acquisitions in the four-year time period since it went to IPO : two in 2010, three in 2011, two in 2012, one in 2013 and three acquisitions so far this year. It also shows an uprising trend in terms of the volume or the price for LinkedIn acquisitions. As in the exhibit below, it shows that the total acquisition spending in 2014 (which is only 8 months at this moment) already surpassed the previous three years combined. LinkedIn has taken a very cautious approach toward the acquisitions. Despite being in a fast- growing stage, it did only eleven acquisitions in the four-year time period since it went to IPO : two in 2010, three in 2011, two in 2012, one in 2013 and three acquisitions so far this year. It also shows an uprising trend in terms of the volume or the price for LinkedIn acquisitions. As in the
  • 27. 26 exhibit below, it shows that the total acquisition spending in 2014 (which is only 8 months at this moment) already surpassed the previous three years combined. The key acquistions are listed in Appendix Link. 6. M&A Strategy LinkedIn acquired the target companies mainly because of the following reasons: either contact- sharing feature or content-sharing feature. The contact-sharing improvements helped LinkedIn to expand its customer base by pulling in the potential members from other social networks and web services and facilitating the current members to reach out potential stakeholders. For example, Rapportive integrated the LinkedIn, Gmail, Facebook and Twitter accounts; Bright provided the technology for recruiters to find better candidates based on the profile, and vice versa; Bizo provided a more efficiency tool for B2B marketing. On the other hand, the content-sharing features allow LinkedIn to strengthen its stickness to the users. LinkedIn members spend more time per visit and page views Slideshare From 2011 to 2013, the total page views grew from 29 billion counts to 47 billion counts annually. Additionally, the methodology used by LinkedIn towards buying acquisitions is buying the technology instead of buying the growth, as technology would benefits its future blueprint. For instance, Bright didn’t had a sustainable revenue model to support its user growth, and Slideshare and Pulse were even free service providers. Thus, we assume there is no unorganic growth LinkedIn obtain from the acquisitions. Finally, we can also see that LinkedIn has only target the companies located in San Francisco Bay Area. The knowledge of the environment and corporate culture of target companies help LinkedIn to reduce the integration cost and risk.
  • 28. 27 7. Management Team Management teams plays a vital role in the success of the organization as the success of the company depends on the way its employees perform and Managers forms a crucial part if the success of the employees and a true example of this is the CEO of LinkedIn Jeff Weiner itself. If he would have not questioned the previous CEO Reid Hoffman regarding the framework of his decision, he would have not become the CEO of LinkedIn. His clear vision of what he sees LinkedIn in future has made all the difference for the company. As it said good investment companies have visionary and long term focused management teams having clear goals and well- identified purpose of what they want now and most importantly in future. Its Jeff wiener vision that has led the company which just came public in 2011 to reach an astonishing market capitalization of 25.4 billion. He had also increased the revenue by 1.5 billion in 2013. His laurels just not only stays to LinkedIn but also with the companies he has worked prior to LinkedIn. Like in case of Yahoo where he was the vice president of one of the division he generated a revenue of 3 billion in 1 year with 3000 employees. Additionally he has not only thought of what the company needs to focus now in order to sustain its position rather he has also vision about how he wants LinkedIn to look in the next decade and have started taking steps in order to achieve them with their vision being “ Creating opportunity for every member of the global workforce”. The management team includes various people just concentrated on a specific area like the chief financial officer Steve Sordello who had previously worked in a team brought that bought first ever quarter profitability. He helped the company grew its revenue and earnings to an extent that a company having market value of less than 40 million reached 2 billion. As a result of this, company like LinkedIn would naturally attract talent as they clear vision, purpose and people would love to work for this company because they feel genuinely identified with the goals and purposes of the organization.
  • 29. 28 IV. Valuation 1. Valuation Methodology Although DCF method is theoretically reasonable and provides the closest thing to an intrinsic stock value. It has a major disadvantage that it is particularly sensitive to assumptions of the perpetuity growth rates and discount rates. For these reasons, relative valuation method such as PE multiple is more used in valuation of high-tech companies which grow fast and no debt. 2. Pro Forma Income Statement (Unit : Thousand) 2013 2014(E) 2015(E) 2016(E) 2017(E) 2018(E) Revenue $1,529 $2,165 $3,217 $5,060 $7,525 $10,839 Cost of Revenue $203 $284 $386 $607 $847 $1,192 Gross Operating Profit $1,326 $1,882 $2,831 $4,452 $6,678 $9,646 Sales & Marketing $522 $755 $1,122 $1,771 $2,634 $3,794 Research & Development $396 $537 $798 $1,289 $1,900 $2,719 General and administrative $226 $334 $450 $658 $978 $1,409 Operating Income before D & A (EBITDA) $182 $255 $461 $734 $1,166 $1,725 Depreciation & Amortization $135 $230 $350 $550 $818 $1,179 Other income (expense), net $1 $5 $5 $5 $5 $5 Earning Before Interest Expenses (EBIT) $49 $30 $116 $189 $353 $551 Income Taxes $22 $60 $40 $66 $123 $193 Net Income $27 $30 $75 $123 $229 $358 Non-GAAP Adjustments $161 $258 $382 $589 $878 $1,249 Non-GAAP Net Income $187 $228 $457 $712 $1,107 $1,608 Diluted Commom Stock Shares $119 $126 $126 $126 $126 $126 EPS $0.23 -$0.24 $0.60 $0.97 $1.82 $2.84 Non-GAAP EPS $1.61 $1.81 $3.63 $5.65 $8.79 $12.76 3. Estimation of EPS (1) Assumption 1. Revenue Since Linkedin is currently eroding and fast growing, our revenue estimation is based on the projection of Total Addressible market(TAM) and Linkedin’s target penetration rate.
  • 30. 29 Talent Solutions We assumed that in 2018, Linkedin’s penetration rate of corporate solution user reaches up to 25% of corporate target user (Global corpotate +100 employee). Marketing Solution we assumed that key drivers (number of unique users and time spent per person) will grow mainly due to the increasing user bases and launching of new features in LinkedIn. Sales Solution We assued that TAM (Numbers of Sales People) of Sales Solution increase at a rate of growth rate of higer educated population and using Numbers of sales registered on Linkedin worldwide. 2. Expense For Year 2014 We are forecasting the cost of revenue, sales and marketing expense, product development expense, general administrative expense, other income and tax expense according to the actual numbers of 2014 Q1 and Q2 and past years. The number of annual Depreciation and Amortization expense was given by Linkedin on a 2014 Q2 earnings call. For Year 2015 -2018 Exhibit 19: Operating Expense Assumption
  • 31. 30 Cost of Revenue We assume the general and administrative expense will face a downtrend in portion of sales, 12%,12%,11%,11% separately during the four-year period. Sales and Marketing expense With a new products, we assume the sales and marketing expense will remain the same level of amount as it’s in 2014. Product Development Since Linkedin has a strong focus on the future vision, we expect it will continuely and constantly invest in its talents to develop new products and features. We assume the product and development expense will remain 25% of the revenue in five years. General & Administrative We assume the general and administrative expense will face a downtrend in portion of sales, 14%,13%,13%,13% separately during the four-year period. Depreciation and Amortization We assume that depreciation and amortization expense will be remain the same portion of 2014, approximately 11% of the sales. We expect the M&A activities will bring the amortization expense year by year. Other Income (Expense) While the increasing cash inflows are expected, We assume Linkedin will spend the cash in M&A activities instead of buying market securities. Thus, the other income remain the same amount as in 2014. Income tax expense According to the projections from Factset, we assume the corporate effective tax rate is 35%. Non-GAAP Adjustments Stock-based Compensation and tax benefits
  • 32. 31 Exhibit 20 Source: Linkedin Stock-based compensation and the related tax benefits is the major adjustment items from GAAP net income to Non-GAAP net income. The main driver of the stock-based compensation is the stock options distributed to the employees. As we expect the stock price of Linkedin will grow, the uptrend of the stock compensation is also expected. Amortization of Intangible Assets We assume the growth rate of amortization expenses is 25%, which is equal to the intangible assets Tax Benefits We assume the effective tax rate for Non-GAAP adjustments is 25%, based on the historical number. 3. Diluted Common Stock Shares Linkedin announced its expected diluted shares as 126,000 in 2014 Q2 earnings call. We don’t expect main changes on it in five years.
  • 33. 32 4. Estimation of P/E Ratio Exhibit 21 - Valuation Comparisons – Information Technology Industry Source: Factset Exhibit 21 lists the expected 2014 Non-GAAP EPS, P/E Ratio, 5-year Long-term EPS Growth (2014, Factset) and P/E to Growth Rate (PEG) of 19 main players in information technology industries. Thus, We run linear regression to find out the correlation between LT EPS Growth Rate and P/E Ratio. The result is shown below in Exhibit 22.
  • 34. 33 Exhibit 22: Regression Model of LT EPS Growth Rate to P/E Ratio Source : Factset The R squared is 0.4636, while the p-value is 0.0013, which means the regression model is coefficient and significant. As enjoying the 45% LT EPS growth rate currently, we expect the LT EPS growth rate will dropped to 20% in the EY 2018, and leads to approximately P/E Ratio 50. In addition, the PEG will be 2.5 in EY 2018. 5. Target Price By multipling 50x P/E Ratio and expected Non-GAAP EPS $12.76, we can get our target price $638 per share on Dec.31, 2018.
  • 35. 34 Reference IBISWorld, “CRM System Providers in the US”, May 2014 IBISWorld, “Online Recruitment Sites in the US”, May 2014 BISWorld, “Online Recruitment Sites in the US”, May 2014 CRM Research, “Sizing Up the CRM Software Market”, 2013 BUREAU of Labor Statistics “Occupational Employment and Wages”, May 2013 CIA, “The world fact book”, June 20, 2014 CIA, “The United States fact book”, June 20, 2014 Work & Roll, “Industry and Porter’s Five Force Analysis: Social Media”, Aug 17, 2013 WikiWealth, “Linkedin Co - Five Forces Analysis” The Motley, “LinkedIn: A SWOT Analysis”, July 18, 2013 PR Newswire, “Bizo Delivers Record-Setting Fourth Quarter; Company Enters 2014 with $50M Revenue Run Rate”. Jun 05, 2014
  • 36. 35 Appendix.1. PRIMARY RESEARCH Our team decided to further carry our analysis of the company by doing a primary research by conducting a survey in order to know how much are people aware about LinkedIn and further that for what purpose are they using LinkedIn and whether they are ready to pay for the services . We mainly targeted 4 countries namely India, China, Taiwan and Eastern Europe. This survey helped us to analyze the various markets that LinkedIn has shifted its focus to recently and further to know about the various growth opportunities or possible risks for the company by getting to know what people expect out of LinkedIn. The research was done using surveys and telephonic interviews and the sample size of the survey was 763 respondents. Survey Result China India Ukraine Taiwan Number of responses 313 257 158 35 1 Gender Male 53% 58.67% 51.59% 54% Female 47% 41.63% 48.41% 46% 2 Age 18-24 11% 60.31% 86.08% 0% 25-34 45% 27.23% 12.3% 53% 35-44 22% 6.61% 1.27% 32% 45-54 11% 5.85% 0.63% 9% 55-64 9% 0% 0% 0% 65 + 2% 0% 0% 6% 3 Career stage Hired 75% 41.63% 42.41% 80% Job searching 17% 39.7% 39.24% 14% No job and does not want a job 8% 10.89% 18.35% 6% Hiring (in case of HR) 7.78% 4 Source for job search Website 59% 65.36% 71.79% 85.7% Hunter 14% 1.94% 11.54% 28.6% Referral 42% 27.23% 11.54% 68.6% Other 5% 5.47% 5.13% 28.6% 5 LinkedIn members Yes 20% 72.27% 32.49% 65.7% No 80% 27.24% 67.11% 34.3% 6 Reason of no registration I didn’t know it 77% 78.57% 85.85% 58.3% For specific reason (for example privacy etc.) 23% 21.43% 14.15% 41.7% 7 Main purpose of registration with LinkedIn Networking 56% 58.82% 45.19% 68.2% Job searching 56% 23.54% 51.85% 9.1% Others 56% 2.67% 0% 22.7%
  • 37. 36 Recruiting employees 0% 14.97% 2.96% 0% 8 Willingness to pay Yes 75% 21.39% 14.74% 9.5% No 25% 78.61% 85.26% 90.5% 9 The most attractive function People you may know 69% 32.19% Send email to people 37% 6.85% Search a job 68% 60.96% 10 How people know about LinkedIn Friend 52% 69.43% 90.9% Website 18% 14.01% 9.1% Never heard 12.74% Other 30% 3.82% 11 How do u recruit employees Campus recruitment 45.94% Referral 21.62% Direct applying for jobs 10.81% LinkedIn 13.51% Others 8.12% Analysis Ukraine Almost 1 million people are registered in Ukraine, 44% of them are active users. Members live mainly in urban areas and 70% of them work in 5 big cities, Kyiv captures 50% by itself. Registered members compose 1.8% of total population of the country and 4.7% of economically active citizens. People involved in this social network haje a job in IT sphere or finance. The primary research targeted the auditory of student, resent graduates and young professionals. The survey answers come mainly fro people in age frame of 18-24 and 25-34 (95%). Survey foundings:  The majorety of respondees are hired (42%) and serch for a job (40%).  People usually use websites to search for a job. This creates opportunities for LinkedIn.  32% are registered in LinkedIn and half of them are unique users.  Other 68% of people are not registered in LinkedIn because in 86% of cases they did not know it.  Two main purposes of membership are job searcking (52%) and networking (45%).  15% of people are willing to pay for services, showing interest in the company.  61% of people consider job search the most attractive function.
  • 38. 37  The majority of people (70%) know about LinkedIn because of friends recomendations. Conclusion: LinkedIn penetration in Ukraine has good possibilities to grow with focus on job search and Talent Solution, as there is no similar company that proposes this kind of services. The knowledge spreading about main idea and usefulness of LinkedIn still needs to be improved, the main source of information for graduates can be universities. In 5 years the amount of people registered and involved can increase 500%. China Total collected amount of answers of our primarily research from China is 313. The range of age as well as region of responses are respectively wide. Some interesting facts of the result shows as below:  One third of responses in China search job via two main ways: recruiter website and referral.  Only 9% of People who already hired registered LinkedIn, while approximate 35% of all other groups have registered LinkedIn.  Based on the range of age, the younger the group is, the more people registered in LinkedIn. Group under 20 years old has 51% of people registered; group between 20 to 29 years old has 21% of people registered.  80% of responses did not register in LinkedIn, 77% of this group of has never heard LinkedIn before; 12% of them feel it is useless.  The way of 52.38% of responses get to know LinkedIn via friends’ recommendation.  75% of people who registered would like to pay for premium services. Market risks assessment Comparative environment China’s professional social network platform has started as the same time as LinkedIn. Tianji – the first professional social network platform in China – was founded in 2004. In the recent market, there are several competitors in the market. They are already well known, and most of them provide all their service free for individual customers.
  • 39. 38 1. Culture difference LinkedIn is a very American style platform. Networking in western country is more based on friends, clients, coworkers, while eastern style networking is more rely on relative relationship. Thus, in eastern countries, people may consider more about their privacy of networking. 2. Price of the service Prices of LinkedIn’s premium service in China is maintain as same as that listed in the U.S. Consider about the currency rate, it will be a certain amount of payment for Chinese users. On the top of that, one of the unique features of Chinese market is individual customer tend to not pay for online service. India The primary research targeted the student as well as the recruiters. While the survey responses came mainly form 18-24 and 25-35 amounting to be 87.54% Survey founding:  The respondents were off different career stage out of which 42% were hired and 39.7% were searching and 7.78 were the recruiting who were looking for potential employees  65.36% of people use website as a means of job searching clearing indicating a huge scope for LinkedIn.  72.27% were registered on LinkedIn and out of the remaining 27.24% who were not there on LinkedIn, 78.57 dint know about LinkedIn while the others dint find LinkedIn useful  The main purpose behind registration was networking (58.82%), job searching (23.54%) and recruiting employees (14.97).  A major population of the respondents were not willing to pay which accounted to be 78.61%.  When asked from the recruiters that which source they use the most for recruiting people, 45.94% said from campus recruitment, 21.62 said from referrals, 13.51 %used LinkedIn.
  • 40. 39 Appendix.2. Assumption of Sales Solution’s TAM Model List of Items Number Growth rate /Percentage Total world population A g.1 Total upper educational population B p.1 Population registered on LinkedIn worldwide C g.2 Numbers of sales registered on LinkedIn worldwide D p.2 Numbers of B2B sales registered on LinkedIn worldwide E p.3 Total sales people TAM F p.4 Total B2B sales people TAM G p.5 Total U.S. population H g.3 Total upper educational population in the U.S. I p.6 Population registered on LinkedIn in the U.S. J g.4 Numbers of sales registered on LinkedIn in the U.S. K p.7 Numbers of B2B sales registered on LinkedIn in the U.S. L p.8 Total sales people TAM in the U.S. M p.9 Total B2B sales people TAM in the U.S. N p.10 Description: A: number from world Factbook (https://www.cia.gov) B: number announced by LinkedIn (CEO’s speech) C: based on LinkedIn’s disclosure (http://www.sec.gov) D: based on the recent sales people on LinkedIn. E: based on the percentage (p.3) of Numbers of sales registered on LinkedIn worldwide (D) F: based on the percentage (p.4) of Total upper educational population (B) G: based on the percentage (p.5) of Total sales people TAM (F) H: number from US Factbook (https://www.cia.gov) I: number from Census United State (http://www.census.gov) J: based on LinkedIn’s disclosure (http://www.sec.gov) K: based on the recent sales people on LinkedIn in the U.S. L: based on the percentage (p.8) of Numbers of sales registered on LinkedIn in the U.S. (K) M: based on the percentage (p.9) of Total upper educational population in the U.S. (I) N: based on the percentage (p.10) of Total sales people TAM in the U.S. (M) Assumptions: g.1: growth rate from world Factbook (https://www.cia.gov), assuming keeping flat in 5 years. g.2: assuming the growth rate will be slightly lower than previous years g.3: growth rate from US Factbook (https://www.cia.gov), assuming keeping flat in 5 years. g.4: assuming the growth rate will be slightly lower than previous years p.1: assuming the percentage will be slightly higher year by year p.2: assuming the percentage of registered sales people will keep flat in 5 years
  • 41. 40 p.3: assuming B2B / (B2B+B2C) sales people = B2B / (B2B+B2C) companies p.4: assuming registered sales/registered people = sales TAM/ Total TAM p.5: assuming registered b2b sales/registered people = b2b sales TAM/ Total TAM p.6: assuming the percentage will be slightly higher year by year p.7: assuming the percentage of registered sales people will keep flat in 5 years p.8: assuming B2B / (B2B+B2C) sales people = B2B/ (B2B+B2C) companies p.9: assuming registered sales/registered people = sales TAM/ Total TAM p.10: assuming registered b2b sales/registered people = b2b sales TAM/ Total TAM Calculation: Total B2B Sales People TAM (G) = p.5 * Total sales people TAM (F) = p.5 * p.4 * Total upper educational population (B) = p.5 * p.4 * Total world population (A) = p.5 * p.4 * A Total B2B Sales People SOM (E) = p.3 * Numbers of sales registered on LinkedIn worldwide (E) = p.3 * p.2 * Population registered on LinkedIn worldwide (C) = p.3 * p.2 * C Total B2B Sales People TAM in the U.S. (N) = p.10 * Total sales people TAM in the U.S. (M) = p.10 * p.9 * Total upper educational population in the U.S. (I) = p.10 * p.9 * p.6 * Total U.S. population (H) = p.10 * p.9 * p.6 * H Total B2B Sales People SOM in the U.S. (L) = p.8 * Numbers of sales registered on LinkedIn in the U.S. (K) = p.8 * p.7 * Population registered on LinkedIn in the U.S. (J) = p.8 * p.7 * Total B2B Sales People TAM international = Total B2B Sales People TAM (Worldwide – U.S.) Total B2B Sales People SOM international = Total B2B Sales People SOM (Worldwide – U.S.)
  • 42. 41 Appendex 3. LinkedIn’s M&A History Slideshare On May 17, 2012, LinkedIn completed its acquisition of Slideshare, Inc. (“Slideshare”), a leading provider of a professional and educational content platform that allows users to upload documents (mostly PowerPoint slides) to share ideas, exchange the conduct research, and connect with other business professionals. LinkedIn’s purchase price is $74.1 million. ($41.9 stock value and $32.2 million cash). The integration of Slideshare platform has helped in strengthening the content of professional networks of LinkedIn and making the members’ profile more credible. Pulse On April 17, 2013, LinkedIn purchased Alphonso Labs, Inc. (Pulse), a leading news reader and content distribution platform mainly based on mobile devices for $47.6 million ($44 million stock value and $3.6 million). With this acquisitions LinkedIn aimed at integrating the technology of Pulse into through social networks, to provide more relevant news experience with content tailored to the members’ professional interests both on the Pulse app and on LinkedIn.com. Furthermore, in order to continue with smooth integration LinkedIn also terminated its in-house new reader LinkedIn Today in November, 2013 (LinkedIn Annual Report, 2013) Bright On February 28, 2014, LinkedIn completed its acquisition of Bright Media Corporation ("Bright") for $101.8 million ($50.2 million stock value and $51.6 cash). Bright was the fourth biggest job recruiting websites before the acquisition and was famous for its unique machine learning algorithm and data analytic technology (Bright Score) of job matching. (LinkedIn 2nd Quarterly Report, 2014) Bizo On July 22, 2014, LinkedIn announced that it is going to acquire Bizo which was global leading platform for business audience for approximately $175 million, consist of 90% cash payment and 10 % stock shares exchange. According to the earning release for the year 2013, Bizo generated $50 million annual revenue and $38.3 million bookings. Bizo's data management and targeting technology enables precise and measurable B2B multi-channel marketing programs. (PR Newswire, 2014). However, LinkedIn will discontuned the The main reason for the acquisition is
  • 43. 42 to leverage Bizo’s products and technology to create a larger B2B focused business. (LinkedIn 2014 Q2 Results Transcripts)