bhopal Call Girls 👙 6297143586 👙 Genuine WhatsApp Number for Real Meet
Riskier business
1. 22 | Baltic Transport Journal | 3/2016
those statistics related to sport and rec-
reational vessels if they show a collision
with a trade vessel). Meanwhile, pleas-
ure crafts generated the most accidents
among all kinds of water transportation,
e.g. 98% of rescue operations concerned
a pleasure craft.
Interestingly, a collision with another
ship – which may at first glance be per-
ceived as a typical scenario – is in fact
not the main reason behind an accident.
In the first place there is loss of control
(24%), contact is on the second spot (18%;
defined as a collision with an external
object, e.g. breakwater, pier, ice, etc.),
J
ust to illustrate the general view,
in the years 2011-2014 a total of
9,180 incidents were reported to
the European Marine Casualty
Information Platform (EMCIP). As many
as 390 people lost their lives, while 3,250
were injured. Approximately two-thirds
of the occurrences involved ship damage,
whereas the remaining ones were related to
accidents on-board. As much as 178 ships
sunk, most of which were fishing vessels. As
a cause, human error was to blame in two-
thirds of the cases.
Casualties in general
Regrettably, the number of casualties is
growing. The appalling year-on-year differ-
ence between 2014 and 2011 was +138%, and
unfortunately this is not the end, because
the number of accidents in 2015 has sup-
posedly grown even further to an estimated
3,500-4,000. There were definitely more
casualties with a ship within the reported
period (affecting not only humans, but also
equipment and cargo), and less occupational
accidents (they only happen to people); the
2011-2014 period resulted in a total of 6,254
casualties with a ship, and 2,926 occupa-
tional accidents.
EMSA’s newest annual overview of marine casualties and incidents
Riskier business
by Maciej Kniter
The European Maritime Safety Agency (EMSA) has published a report summarizing the recent accidents
that occurred in the maritime sector. Unfortunately, sailing the seven seas has in recent years become more
hazardous, as the number of both incidents and casualties has risen.
Regrettably, the number of casualties
is growing. The appalling year-on-year
difference between 2014 and 2011 was
+138%, and unfortunately this is not the
end, because the number of accidents in
2015 has supposedly grown even further
to an estimated 3,500-4,000.
Causes of ships & accidents
As mentioned above, during the 2011-
-2014 period, out of the whole group of
ships involved in all accidents, 44% of
them were freighters, followed by pas-
senger ships (23%; pax ships defined as
vessels specifically designed to carry more
than 12 people), service ships like tugs
or dredgers (15%), fishing vessels (13%),
and lastly – the remaining 5% encompass
inland waterway ships, recreational crafts,
navy ships, and vessels of unknown types
(it is worth noting that EMSA only collects
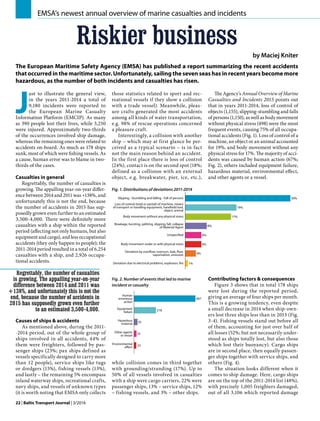
The Agency’s Annual Overview of Marine
Casualties and Incidents 2015 points out
that in years 2011-2014, loss of control of
objects (1,155), slipping-stumbling and falls
of persons (1,150), as well as body movement
without physical stress (498) were the most
frequent events, causing 75% of all occupa-
tional accidents (Fig. 1). Loss of control of a
machine, an object or an animal accounted
for 19%, and body movement without any
physical stress for 17%. The majority of acci-
dents was caused by human action (67%;
Fig. 2), others included equipment failure,
hazardous material, environmental effect,
and other agents or a vessel.
Fig. 1. Distributions of deviations 2011-2014
Fig. 2. Number of events that led to marine
incident or casualty
while collision comes in third together
with grounding/stranding (17%). Up to
50% of all vessels involved in casualties
with a ship were cargo carriers, 22% were
passenger ships, 13% – service ships, 12%
– fishing vessels, and 3% – other ships.
Contributing factors & consequences
Figure 3 shows that in total 178 ships
were lost during the reported period,
giving an average of four ships per month.
This is a growing tendency, even despite
a small decrease in 2014 when ship-own-
ers lost three ships less than in 2013 (Fig.
3-4). Fishing vessels stand out before all
of them, accounting for just over half of
all losses (52%; but not necessarily under-
stood as ships totally lost, but also those
which lost their buoyancy). Cargo ships
are in second place, then equally passen-
ger ships together with service ships, and
others (Fig. 4).
The situation looks different when it
comes to ship damage. Here, cargo ships
are on the top of the 2011-2014 list (48%),
with precisely 1,005 freighters damaged,
out of all 3,106 which reported damage
2. 3/2016 | Baltic Transport Journal | 23
Maritime
on-board. Second place is held by passen-
ger ships (22%), the third by fishing vessels
(13%), the fourth by service ships (12%)
and the last one by others (5%).
The Overview states that “The total
number of lives lost during the period
2011-2014 was 393, with a significant
increase in 2014 in comparison with all
previous years.” Out of this number, 303
fatalities were seafarers. All in all, fatali-
ties were listed in three groups – crew
members, passengers, and others (e.g. har-
bour workers). Almost half (46%) of the
fatalities occurred on cargo ships, pax
and fishing vessels were second (both
23%), followed by service ships (7%), and
others (1%).
As many as 3,252 people were injured
within the reported period as a result of
2,815 circumstances. The percentage of seri-
ous injuries (cases when a person is unable to
function normally for more than 72 hours)
remains more or less stable – at approx.
30% of all injuries. However, the number
of people injured is also growing; in 2011,
463 people were injured, one year later – 781,
in 2013 – 933, and in 2014 – 1,075. Contrary
to the fatalities, most injuries took place
on-board passenger ships (38%), then on
cargo vessels (29%), followed by fishing and
high sea within the Exclusive Economic
Zone (EEZ) is third with its 9%. One of
the main, and in fact simple conclusions
that can be drawn is that the number of
accidents is correlated to the density of
traffic (Map 1). Denmark, for instance, is
a gateway to the Baltic Sea, so the number
of accidents here is much higher than for
example in the north. By looking at the
distribution of ship flags, we can observe
that in the vast majority of cases it was an
EU ship that was involved in the situation
(83%), out of the total 10,440 vessels con-
cerned. Up to 77% of all accidents hap-
pened in territorial and internal waters.
What should be done, then, to avoid
accidents which cost a lot of money and
sometimes even peoples’ lives? Through
the period of 2011-2014, an investigation
advised in 43% to take more care about
operational practice. Human factors were
pointed out to be improved in 17%, while
safety navigation – 13%. Other recom-
mendations were mentioned in 10% of all
investigation results, while the remaining
17% was separated into advice relating to
machinery, lifesaving equipment, fire pro-
tection, cargo carriage, seaworthiness, and
electrical installations.
We all want the number of sea accidents
to decrease and should do all that we can to
ensure safety on-board. The human factor
is still the highest in the “cause ranking”, so
there’s a room for further improvement. But,
unfortunately (or maybe just being realis-
tic), all of our activities inherently contain
a margin of possible error, therefore in the
end it’s about handling the various hazards
in this risky business. ‚
Through the period of 2011-2014, an
investigation advised in 43% to take more
care about operational practice. Human
factors were pointed out to be improved in
17%, while safety navigation – 13%.
service ships (each 16%), and 1% on others.
Most injuries happened to the crew – 80%
of all injuries in the reported period (17%
to passengers, 3% to the others).
Stage & location
Another thing is the stage of the jour-
ney (voyage segment), where the acci-
dent occurred. The majority of accidents
happened when a ship was in mid-water
(2,642), and during arrival (1,996). How-
ever, this does not equal accidents on the
high sea, because looking at geography,
42% of the accidents happened in ports.
Coastal waters up to 12 nautical miles wit-
nessed 27% of the occurrences, while the
Fig. 3. Number of ships lost per year Fig. 4. Distribution of ships sunk 2011-2014
Map 1. Distribution of of accidents in the Baltic Sea and approaches
37
27
52
28
65
13
39
40
30
41
11
14
73
30
13
52
38
17
79
3
7
6
8
2
2
115
223
173
346
11
192
184
1011
240
216
Source for all graphic materials: EMSA’s Annual Overview of Marine Casualties and Incidents 2015