SlideShare una empresa de Scribd logo
1 de 49
Descargar para leer sin conexión
The Benefits of Natural Gas
Production and Exports for
U.S. Small Businesses
Raymond J. Keating
Chief Economist
Small Business & Entrepreneurship Council
May 2013
www.sbecouncil.org
Contents
Executive Summary . . . . . . . . . . . . . . . . . . . . . . . . . . . . . . . . . . . . . . . . . . . 3
Introduction . . . . . . . . . . . . . . . . . . . . . . . . . . . . . . . . . . . . . . . . . . . . . . . . . 5
I. United States . . . . . . . . . . . . . . . . . . . . . . . . . . . . . . . . . . . . . . . . . . . . . . . . 6
II. Arkansas . . . . . . . . . . . . . . . . . . . . . . . . . . . . . . . . . . . . . . . . . . . . . . . . . . . 11
III. Colorado . . . . . . . . . . . . . . . . . . . . . . . . . . . . . . . . . . . . . . . . . . . . . . . . . . 14
IV. Louisiana . . . . . . . . . . . . . . . . . . . . . . . . . . . . . . . . . . . . . . . . . . . . . . . . . . 17
V. North Dakota . . . . . . . . . . . . . . . . . . . . . . . . . . . . . . . . . . . . . . . . . . . . . . . 20
VI. Ohio . . . . . . . . . . . . . . . . . . . . . . . . . . . . . . . . . . . . . . . . . . . . . . . . . . . . . . 23
VII. Oklahoma . . . . . . . . . . . . . . . . . . . . . . . . . . . . . . . . . . . . . . . . . . . . . . . . . 26
VIII. Pennsylvania . . . . . . . . . . . . . . . . . . . . . . . . . . . . . . . . . . . . . . . . . . . . . . . 29
IX. Texas . . . . . . . . . . . . . . . . . . . . . . . . . . . . . . . . . . . . . . . . . . . . . . . . . . . . . 32
X. Utah . . . . . . . . . . . . . . . . . . . . . . . . . . . . . . . . . . . . . . . . . . . . . . . . . . . . . . 35
XI. West Virginia . . . . . . . . . . . . . . . . . . . . . . . . . . . . . . . . . . . . . . . . . . . . . . . 38
XII. Wyoming . . . . . . . . . . . . . . . . . . . . . . . . . . . . . . . . . . . . . . . . . . . . . . . . . . 41
XIII. LNG Exports: Expand or Limit Opportunities? . . . . . . . . . . . . . . . . . . . . . 44
About the Author . . . . . . . . . . . . . . . . . . . . . . . . . . . . . . . . . . . . . . . . . . . 47
Endnotes . . . . . . . . . . . . . . . . . . . . . . . . . . . . . . . . . . . . . . . . . . . . . . . . . . 48
www.sbecouncil.org
The Benefits of Natural Gas Production and Exports for U.S. Small Businesses | 3
Executive Summary
The U.S. natural gas market has changed dramatically in recent years, as evidenced by a 55 percent decline
in the annual average price of natural gas occurring between 2005 and 2011. While assorted market factors
come into play, this reduction in natural gas prices has been a direct result of expanded natural gas pro-
duction in the U.S. Increased production has been a boon for the energy sector, including for employment
and business growth, especially in those states where natural gas production has expanded, with indirect
benefits across the nation.
increased by 947 percent, due to a combination of hori-
zontal drilling and hydraulic fracturing.
Jobs Growth. For the U.S. overall, while total employment
declined by 3.7 percent from 2005 to 2010, jobs grew by
27.6 percent in the oil and gas extraction sector; by 15.1
percent in the drilling oil and gas wells sector; by 38.5 per-
cent in the support sector for oil and gas operations; by 47
percent in the oil and gas pipeline and related structures
construction sector; and by 62 percent in the oil and gas
field machinery and equipment manufacturing sector.
Small Business Growth. Meanwhile, the same contrast
held in terms of changes in the number of businesses,
including small business. For all of the U.S., total employer
firms declined by 4.2 percent from 2005 to 2010, including
a 3.7 percent decline in firms with less than 20 workers, and
a 4.2 percent fall in firms with less than 500 workers. But
within the energy sector, business growth in key industries
has been striking:
• The number of oil and gas extraction employer firms
grew by 3.1 percent, including growth of 2.5 percent
among firms with less than 20 workers and 3 percent
among firms with less than 500 workers.
Export Opportunities. Looking ahead, the opportunity
exists for exporting liquefied natural gas (LNG), given the
large differential in natural gas prices in the U.S. versus else-
where in the world, and rising global demand. Unfortu-
nately, though, there is a movement afoot to have
government limit LNG exports, based on the unfounded
fear that LNG exports will dramatically drive up domestic
natural gas prices. But the economy is not a zero-sum
game. Expanded demand for U.S. natural gas internation-
ally will be a net positive, resulting in greater U.S. natural
gas production, increased investment, enhanced GDP
growth, rising incomes, and more jobs.
Several studies have validated the abundance of domestic
natural gas for international export. The International
Energy Administration recently projected that “the United
States becomes a net exporter of natural gas by 2020 and
is almost self-sufficient in energy, in net terms, by 2035.” In
addition, a recent study for the Brookings Institution noted,
“In their analyses, both Deloitte and EIA found that the
majority – 63 percent, according to both studies – of the
exported natural gas will come from new production as
opposed to displaced consumption from other sectors.”
This report looks at some of the tremendous benefits that
have emerged for the U.S. economy due to a vast expan-
sion in natural gas production in less than a decade. In par-
ticular, this report focuses on the growth in jobs and the
number of small and midsize businesses in key energy sec-
tors, including in states where natural gas production has
increased and where such production is expected to
expand. It follows that the U.S. becoming a leader in meet-
ing global natural gas demand would be a clear benefit to
the overall U.S. economy, and again, particularly in those
states leading the way in natural gas production.
Rising Production. Natural gas production increased by 27
percent from 2005 to 2011. This increase in natural gas has
come from high production levels from shale gas, which
Expanded demand for U.S. natural
gas internationally will be a net
positive, resulting in greater U.S.
natural gas production, increased
investment, enhanced GDP growth,
rising incomes, and more jobs.
4 | The Benefits of Natural Gas Production and Exports for U.S. Small Businesses
• The number of drilling oil and gas wells employer firms
grew by 7.2 percent, including 4.7 percent among firms
with less than 20 workers and 7.3 percent among firms
with less than 500.
• The number of oil and gas operations employer firms
grew by 24.5 percent, including 24.5 percent among
firms with less than 20 workers and 24.6 percent among
firms with less than 500.
• The number of oil and gas pipeline and related structures
construction employer firms grew by 5.1 percent, includ-
ing growth of 3.5 percent among firms with less than 500
workers.
• The number of oil and gas field machinery and equip-
ment manufacturing employer firms grew by 61.0 per-
cent, including growth of 59.0 percent among firms with
less than 20 workers and 62.7 percent among firms with
less than 500 workers.
Small Business Population. At the same time, small and
midsize firms overwhelmingly populate each of the energy
sectors considered. Businesses with less than 20 workers
came in at
• 91.3 percent of oil and gas extraction employer firms;
• 80.4 percent of drilling oil and gas wells employer firms;
• 84.7 percent of oil and gas operations employer firms;
• 63 percent of oil and gas pipeline and related structures
construction employer firms; and
• 60.3 percent of oil and gas field machinery and equip-
ment manufacturing employer firms.
It follows that the U.S. becoming a
leader in meeting global natural gas
demand would be a clear benefit to
the overall U.S. economy, and again,
particularly in those states leading
the way in natural gas production.
In the 11 states examined in this report, the dominance of
small and midsize firms populating energy industries held
as well. Interestingly, the contrast between a national
decline in overall jobs and businesses, and growth in key
energy sectors often was even far more striking than the
national differences. The general case of energy industries
adding jobs and small businesses, as opposed to national
declines, held in the 10 states – that is, in Arkansas, Col-
orado, Louisiana, North Dakota, Oklahoma, Pennsylvania,
Texas, Utah, West Virginia, and Wyoming – where natural
gas production was up markedly. (A Summary Sheet for
each state is available.)
Opportunities Ahead. The expectation that nearly two-
thirds of LNG exports would be met via new production
speaks to further strong growth for small and midsize busi-
nesses, and for employment. At the same time, the minimal
price impact that expanded exports might have on domes-
tic prices would have small effects on domestic consumers
of natural gas, especially given the enormous declines
we’ve already experienced in natural gas prices. And even
those small, potential price increases must be further offset
against the effect of the overall positive for economic
growth coming via expanded natural gas production.
Clearly, LNG exports guided by market forces mean
further expanding opportunity for small and midsize
businesses to be created, to grow, and to create jobs.
The Benefits of Natural Gas Production and Exports for U.S. Small Businesses | 5
While assorted market factors come into play, lower natu-
ral gas prices have resulted directly from expanded U.S.
natural gas production. That increased production has been
good news for the energy sector, including for employment
and business growth, especially in those states where nat-
ural gas production has expanded, with indirect benefits
spreading across the nation.
Looking ahead, the opportunity exists for exporting lique-
fied natural gas (LNG)1
, given the large differential in nat-
ural gas prices in the U.S. versus elsewhere in the world,
and rising global demand. For example, in November
2012, the International Energy Administration reported:
“The WEO finds that the extraordinary growth in oil and
natural gas output in the United States will mean a sea-
change in global energy flows. In the New Policies Sce-
nario, the WEO’s central scenario, the United States
becomes a net exporter of natural gas by 2020 and is
almost self-sufficient in energy, in net terms, by 2035…
While the regional picture for natural gas varies, the global
outlook over the coming decades looks to be bright, as
demand increases by 50% to 5 trillion cubic metres in
2035. Nearly half of the increase in production to 2035 is
from unconventional gas, with most of this coming from
the United States, Australia and China.”2
The U.S. becoming a leader in meeting global natural gas
demand would be a clear benefit to the overall U.S. econ-
omy, and particularly in states leading the way in natural
gas production.
It’s important to consider the benefits that accrue to work-
ers, small businesses, individual states, and the U.S. econ-
omy when domestic energy production, such as in natural
gas, expands. Let’s review key points.
Introduction
The U.S. natural gas market has changed dramatically in recent years. Consider the drop in natural gas
prices. For example, the annual average price of natural gas (dollars/mil. BTUs) went from $9.014 in 2005 to
$4.026 in 2011. That 55 percent decline generated considerable savings for U.S. households and businesses via
electricity prices – given that 25 percent of electric power is generated via natural gas – as well as for a wide
array of industries that use natural gas in their production processes.
Looking ahead, the opportunity
exists for exporting liquefied
natural gas (LNG), given the large
differential in natural gas prices in
the U.S. versus elsewhere in the
world, and rising global demand.
6 | The Benefits of Natural Gas Production and Exports for U.S. Small Businesses
I. United States
After small increases throughout the 1990s, for example,
natural gas production in the U.S. hit a high of 19.62 tril-
lion cubic feet in 2001, and then declined for the following
four years. In 2005, U.S. natural gas marketed production
registered 18.05 trillion cubic feet, which was roughly the
same level as in 1993. However, growth resumed, and nat-
ural gas production in the U.S. hit 23 trillion cubic feet in
2011, which was a 27 percent increase over 2005. All of the
increase in natural gas production basically has come from
shale gas, which increased by 947 percent from 2005 to
2011. What’s behind this vast expansion in recent produc-
tion, not to mention an expanded view of resources into
the future?
The EIA explained, “Over the past decade, the combina-
tion of horizontal drilling and hydraulic fracturing has
allowed access to large volumes of shale gas that were pre-
viously uneconomical to produce. The production of natu-
ral gas from shale formations has rejuvenated the natural
gas industry in the United States.”3
Looking into the future, the EIA “projects U.S. natural gas
production to increase from 23.0 trillion cubic feet in 2011
to 33.1 trillion cubic feet in 2040, a 44% increase. Almost all
of this increase in domestic natural gas production is due to
projected growth in shale gas production, which grows from
7.8 trillion cubic feet in 2011 to 16.7 trillion cubic feet in
2040. Although the prospects for shale gas production are
promising, there remains considerable uncertainty regarding
2011 Projections
Shale Gas
Nonassociated Offshore
Nonassociated Onshore
Coalbed Methane
TightGas
Associated with Oil
Alaska
History
35
30
25
20
15
10
5
0
1990 2000 2010 2020 2030 2040
Figure 3: U.S. Dry Natural Gas Production by Source, 1990-2040
Source: This figure is from the AEO2013 Early Release Overview, U.S. Energy Information Administration, December 5, 2012
The Benefits of Natural Gas Production and Exports for U.S. Small Businesses | 7
That expansion in production
has led to growth in employment
in the energy sector, while the
overall economy experienced a
decline in jobs.
the size and economics of this resource… An analysis in the
Annual Energy Outlook 2012 (released June 2012) indicates
that the uncertainty in the size and economics of the domes-
tic shale gas resources could have a considerable impact on
future domestic natural gas production and that 2035 shale
gas production could be between 9.7 trillion cubic feet and
20.5 trillion cubic feet. U.S. total natural gas production is
projected to range between 26.1 trillion cubic feet and 34.1
trillion cubic feet.”4
For good measure, proved reserves of U.S. dry natural gas
went from 192.5 trillion cubic feet in 2004 to 304.6 trillion
cubic feet in 2010 – a 58 percent expansion.
This revolution in natural gas production – coupled with an
increase in U.S. oil production (also due to the extraction tech-
nologies of hydraulic fracturing and horizontal drilling being
applied, especially in Texas and North Dakota) – has provided
considerable growth in the energy sector of our economy in
recent years, while the overall economy has badly faltered.
It is important to keep in mind when looking ahead that
projected resources and production in the areas of oil and
natural gas usually turn out to be grossly under-estimated
given innovations and improvements that occur in explo-
ration and production technologies – as has been so glar-
ingly the case with increases in both oil and natural gas
production in recent years that were not expected a rela-
tively short time ago.
As already noted (and see Table 1), U.S. natural gas marketed
production grew by 27 percent between 2005 and 2011.
Table 1: U.S. Natural Gas Marketed Production
2005: 18,927.1 billion cubic feet
2011: 24,036.4 billion cubic feet
Impact on Jobs
That expansion in production has led to growth in employ-
ment in the energy sector, while the overall economy expe-
rienced a decline in jobs.
Table 2 compares employment growth (all employment and
business data from Census Bureau “County Business Pat-
terns” unless otherwise noted) among employer firms in
the overall economy, and in various energy industry sectors.
The difference in the employment story between the energy
sector and the overall economy could not be starker. While
overall employment fell between 2005 and 2010, jobs grew
markedly in the energy sector given the striking expansion
in domestic natural gas and oil production.
While U.S. total employment declined by 3.7 percent from
2005 to 2010, jobs grew by the following:
• 27.6 percent in the oil and gas extraction sector;5
• 15.1 percent in the drilling oil and gas wells sector;6
• 38.5 percent in the support sector for oil and gas opera-
tions;7
• 47 percent in the oil and gas pipeline and related struc-
tures construction sector;8
and
• 62 percent in the oil and gas field machinery and equip-
ment manufacturing sector.9
While U.S. employers overall shed 4.3 million jobs over this
period, employers in the five energy industries included
here directly added 146,000 jobs.
8 | The Benefits of Natural Gas Production and Exports for U.S. Small Businesses
Impact on Small Business
At the same time, and not surprisingly, while the number of
businesses (in this case, employer firms) in the nation
declined, business growth was strong among the energy
sector. And it is critical to note the role and growth of
smaller businesses.
Table 3 makes clear that expanded production in the
energy sector has been a boon for small and midsize enter-
prises. Or, to look at it from a different angle, expanded
energy production has been driven by small and midsize
businesses.
For all of the U.S., total employer firms declined by 4.2 per-
cent from 2005 to 2010, including a 3.7 percent decline in
firms with less than 20 workers, and a 4.2 percent fall in
firms with less than 500 workers. Again, compare those
declines to the growth in energy industries over the same
period:
• Among oil and gas extraction businesses, the number of
employer firms grew by 3.1 percent, including growth of
2.5 percent among firms with less than 20 workers and
3.0 percent among firms with less than 500 workers.
• Among drilling oil and gas wells businesses, the number
of employer firms grew by 7.2 percent, including growth
of 4.7 percent among firms with less than 20 workers and
7.3 percent among firms with less than 500 workers.
• Among oil and gas operations businesses, the number
of employer firms grew by 24.5 percent, including growth
Percent
Sector 2005 2010 Change
Total 116,317,003 111,970,095 -3.7%
Oil/Gas Extraction 85,562 109,199 27.6%
Drilling Oil and Gas Wells 66,084 76,072 15.1%
Support for Oil and Gas Operations 136,038 188,468 38.5%
Oil and Gas Pipeline and
Related Structures Construction 86,321 126,856 47.0%
Oil and Gas Field Machinery
and Equipment Manufacturing 30,580 49,542 62.0%
Table 2: Employment Growth Among Employer Firms, 2005-2010
of 24.5 percent among firms with less than 20 workers
and 24.6 percent among firms with less than 500 workers.
• Among oil and gas pipeline and related structures con-
struction businesses, the number of employer firms grew
by 5.1 percent, including growth of 3.5 percent among
firms with less than 500 workers.
• Among oil and gas field machinery and equipment man-
ufacturing businesses, the number of employer firms
grew by 61.0 percent, including growth of 59.0 percent
among firms with less than 20 workers and 62.7 percent
among firms with less than 500 workers.
The growth in both jobs and small-midsize employer firms
in the energy sector has been striking in recent years, once
again especially given the abysmal performance of the
overall economy.
Finally, it must be noted that the energy sector in fact is not
all about huge enterprises. As noted in Table 3, each energy
sector looked at here is overwhelmingly populated by small
and midsize firms.
• Among oil and gas extraction businesses, 91.3 percent
of employer firms in 2010 had less than 20 workers, and
98.6 percent had fewer than 500 employees.
• Among drilling oil and gas wells businesses, 80.4 percent
of employer firms in 2010 had less than 20 workers, and
97.8 percent had fewer than 500 employees.
• Among oil and gas operations businesses, 84.7 percent
The Benefits of Natural Gas Production and Exports for U.S. Small Businesses | 9
U.S. Total Employer Firms
Number of Employees As Percent of Total Firms
Total Less 20 Less 500 Less 20 Less 500
2005 5,983,546 5,357,887 5,966,069 89.5% 99.7%
2010 5,734,538 5,160,404 5,717,302 90.0% 99.7%
Chg 05-10 -4.2% -3.7% -4.2%
Oil/Gas Extraction Employer Firms
Number of Employees As Percent of Total Firms
Total Less 20 Less 500 Less 20 Less 500
2005 6,317 5,800 6,230 91.8% 98.6%
2010 6,513 5,947 6,420 91.3% 98.6%
Chg 05-10 3.1% 2.5% 3.0%
Drilling Oil and Gas Wells Firms
Number of Employees As Percent of Total Firms
Total Less 20 Less 500 Less 20 Less 500
2005 1,833 1,509 1,791 82.3% 97.7%
2010 1,965 1,580 1,921 80.4% 97.8%
Chg 05-10 7.2% 4.7% 7.3%
Support for Oil and Gas Operations
Number of Employees As Percent of Total Firms
Total Less 20 Less 500 Less 20 Less 500
2005 6,183 5,238 6,101 84.7% 98.7%
2010 7,696 6,522 7,601 84.7% 98.8%
Chg 05-10 24.5% 24.5% 24.6%
Oil and Gas Pipeline and Related Structures Construction
Number of Employees As Percent of Total Firms
Total Less 20 Less 500 Less 20 Less 500
2005 1,612 1,075 1,561 66.7% 96.8%
2010 1,695 1,068 1,616 63.0% 95.3%
Chg 05-10 5.1% -0.7% 3.5%
Oil and Gas Field Machinery and Equipment Manufacturing
Number of Employees As Percent of Total Firms
Total Less 20 Less 500 Less 20 Less 500
2005 480 293 442 61.0% 92.1%
2010 773 466 719 60.3% 93.0%
Chg 05-10 61.0% 59.0% 62.7%
Table 3: Employer Firms – U.S. Total and Energy Industries, 2005-2010
10 | The Benefits of Natural Gas Production and Exports for U.S. Small Businesses
of employer firms in 2010 had less than 20 workers, and
98.8 percent had fewer than 500 employees.
• Among oil and gas pipeline and related structures con-
struction businesses, 63.0 percent of employer firms in
2010 had less than 20 workers, and 95.3 percent had
fewer than 500 employees.
• Among oil and gas field machinery and equipment man-
ufacturing businesses, 60.3 percent of employer firms in
2010 had less than 20 workers, and 93.0 percent had
fewer than 500 employees.
Finally, in looking at the full picture of the impact uncon-
ventional oil and natural gas production – that is, “uncon-
ventional natural gas extracted from shale formations and
from tight sands and unconventional oil extracted from
shale and other dense rocks” – on the U.S. economy, IHS
found:10
• “In 2012, capital expenditures will surpass $87 billion.
These expenditures supporting the growth of unconven-
tional oil and gas activity will reach $172.5 billion in 2020
and more than $353 billion in 2035.”
• “Over 1.7 million jobs are attributable to unconventional
oil and gas development today. These employment con-
tributions are expected to rise to 3 million by the end of
the decade and to 3.5 million jobs by 2035.”
• “In 2012, unconventional oil and gas will contribute
almost $238 billion in value added to the US economy.
This contribution to gross domestic product (GDP) will
increase more than 75% by 2020 to over $416 billion. By
the final year of the forecast period, 2035, this will
increase to nearly $475 billion.”
Now let’s consider the developments in key states experiencing
expanded opportunities on the natural gas production front.
The Benefits of Natural Gas Production and Exports for U.S. Small Businesses | 11
II. Arkansas
The increase in natural gas production has been dramatic in Arkansas via the Fayetteville Shale area. The
state’s natural gas production, as highlighted in Table 4, expanded by 462.7 percent from 2005 to 2011.
Impact on Jobs
Table 5 compares employment growth (again, all employ-
ment and business data from Census Bureau “County Busi-
ness Patterns” unless otherwise noted) among employer
establishments in the overall state, and in various energy
industry sectors. The difference in the employment story
between the energy sector and the overall economy is
striking.
While overall employment fell between 2005 and 2010,
jobs grew markedly in the energy sector given the expan-
sion in energy production.
Arkansas total employment declined by 5.1 percent from
2005 to 2010, but jobs grew by the following:
Table 4: Arkansas Natural Gas Marketed Production
2005: 190.5 billion cubic feet
2011: 1,072.2 billion cubic feet
• 161.5 percent in the oil and gas extraction sector;
• 254.9 percent in the drilling oil and gas wells sector;
• 259.4 percent in the support sector for oil and gas oper-
ations; and
• 126.9 percent in the oil and gas pipeline and related
structures construction sector.
While Arkansas employers overall shed 51,950 jobs over this
period, employers in the four energy industries (where data
was available) included here added more than 5,600 jobs.
Percent
Sector 2005 2010 Change
Total 1,017,424 965,474 -5.1%
Oil/Gas Extraction 637 1,666 161.5%
Drilling Oil and Gas Wells 692 2,456 254.9%
Support for Oil and Gas Operations 817 2,936 259.4%
Oil and Gas Pipeline and
Related Structures Construction 588 1,334 126.9%
Oil and Gas Field Machinery
and Equipment Manufacturing NA NA NA
Table 5: Arkansas Employment Growth Among Employer Establishments, 2005-2010
Impact on Small Business
At the same time, while the number of businesses (in this
case, establishments) declined in the nation and in Arkansas
(though at a slower pace of decline in Arkansas compared
to the U.S.), the number of establishments grew strongly
among Arkansas’ energy sector. And it is critical to note the
role and growth of smaller businesses.
Table 6 makes clear that expanded production in the
energy sector has been a boon for small and midsize enter-
prises in the state. Or, to look at it from a different angle,
expanded energy production has been driven by small and
midsize businesses.
For all of the U.S., total employer establishments declined
by 1.4 percent from 2005 to 2010, including a 3.5 percent
decline in establishments with less than 20 workers, and a
3.1 percent fall in establishments with less than 500 workers.
In Arkansas, total establishments declined by 1.3 percent,
including a 1.5 percent fall among establishments with less
than 20 workers, and a 1.3 percent decline among those
with less than 500 workers.
But compare those declines to the growth in these energy
industries in Arkansas:
• Among oil and gas extraction businesses, the number of
employer establishments grew by 14.6 percent, includ-
ing growth of 13.1 percent among those with less than 20
workers and 14.6 percent among establishments with
less than 500 workers.
• Among drilling oil and gas wells businesses, the number
of employer establishments grew by 56.3 percent, includ-
ing growth of 40.0 percent among establishments with
less than 20 workers and 56.3 percent among establish-
ments with less than 500 workers.
• Among oil and gas operations businesses, the number
of employer establishments grew by 77 percent, includ-
ing growth of 51.8 percent among establishments with
less than 20 workers and 77 percent among establish-
ments with less than 500 workers.
12 | The Benefits of Natural Gas Production and Exports for U.S. Small Businesses
The growth in both jobs and small-midsize employer estab-
lishments in the energy sector has been striking in recent
years, especially given the abysmal performance of the
overall economy.
Finally, it must be noted that the Arkansas energy sector is
not all about big energy businesses. As noted in Table 6,
each energy sector looked at is overwhelmingly populated
by small and midsize establishments.
• Among oil and gas extraction businesses, 93.1 percent of
employer establishments in 2010 had less than 20 workers,
and 100 percent had fewer than 500 employees.
• Among drilling oil and gas wells businesses, 70 percent of
employer establishments in 2010 had less than 20 workers,
and 100 percent had fewer than 500 employees.
• Among oil and gas operations businesses, 81.8 percent of
employer establishments in 2010 had less than 20 workers,
and 98.8 percent had fewer than 500 employees.
• Among oil and gas pipeline and related structures con-
struction businesses, 48.3 percent of employer estab-
lishments in 2010 had less than 20 workers, and 95.3
percent had fewer than 500 employees.
The Benefits of Natural Gas Production and Exports for U.S. Small Businesses | 13
Arkansas Total Establishments
Number of Employees As Percent of Total Firms
Total Less 20 Less 500 Less 20 Less 500
2005 66,039 57,236 65,844 86.7% 99.7%
2010 65,158 56,394 65,018 86.5% 99.8%
AR 05-10 -1.3% -1.5% -1.3%
US 05-10 -1.4% -3.5% -3.1%
Arkansas Oil/Gas Extraction Employer Establishments
Number of Employees As Percent of Total Firms
Total Less 20 Less 500 Less 20 Less 500
2005 89 84 89 94.4% 100%
2010 102 95 102 93.1% 100%
Chg 05-10 14.6% 13.1% 14.6%
Arkansas Drilling Oil and Gas Wells Establishments
Number of Employees As Percent of Total Firms
Total Less 20 Less 500 Less 20 Less 500
2005 32 25 32 78.1% 100%
2010 50 35 50 70.0% 100%
Chg 05-10 56.3% 40.0% 56.3%
Arkansas Support for Oil and Gas Operations Establishments
Number of Employees As Percent of Total Firms
Total Less 20 Less 500 Less 20 Less 500
2005 87 83 87 95.4% 100%
2010 154 126 154 81.8% 100%
Chg 05-10 77.0% 51.8% 77.0%
Arkansas Oil and Gas Pipeline and Related Structures Construction Establishments
Number of Employees As Percent of Total Firms
Total Less 20 Less 500 Less 20 Less 500
2005 30 20 30 66.7% 100%
2010 29 14 29 48.3% 100%
Chg 05-10 -3.3% -30.0% -3.3%
Arkansas Oil and Gas Field Machinery and Equipment Manufacturing Establishments
Number of Employees As Percent of Total Firms
Total Less 20 Less 500 Less 20 Less 500
2005 1 0 1 0% 100%
2010 2 1 2 50% 100%
Chg 05-10 100% - 100%
Table 6: Establishments – Arkansas Total and Energy Industries, 2005-2010
14 | The Benefits of Natural Gas Production and Exports for U.S. Small Businesses
III. Colorado
The increase in natural gas production has been notable in Colorado. The state’s natural gas production, as
highlighted in Table 7, expanded by 44.5 percent from 2005 to 2011.
Impact on Jobs
Table 8 compares employment growth (again, all employ-
ment and business data from Census Bureau “County Busi-
ness Patterns” unless otherwise noted) among employer
establishments in the overall state, and in various energy
industry sectors. The difference in the employment story
between the energy sector and the overall economy is
impressive.
While overall employment grew between 2005 and 2010
in Colorado – compared to a decline in the U.S. overall –
jobs grew markedly in the energy sector given the expan-
sion in energy production.
While U.S. total employment declined, Colorado total
Table 7: Colorado Natural Gas Marketed Production
2005: 1,133.1 billion cubic feet
2011: 1,637.6 billion cubic feet
employment grew by 1.0 percent from 2005 to 2010. On
the energy front, jobs grew by the following:
• 58.5 percent in the oil and gas extraction sector;
• 34.9 percent in the drilling oil and gas wells sector; and
• 74.6 percent in the support sector for oil and gas opera-
tions.
While Colorado employers overall added 19,072 jobs over
this period, employers in the four energy industries (where
data was available) included here added more than 6,363
jobs. That’s one in three jobs added coming from these
energy industries.
Percent
Sector 2005 2010 Change
Total 1,936,264 1,955,336 1.0%
Oil/Gas Extraction 4,060 6,447 58.8%
Drilling Oil and Gas Wells 2,678 3,612 34.9%
Support for Oil and Gas Operations 4,381 7,648 74.6%
Oil and Gas Pipeline and
Related Structures Construction 1,473 1,248 -15.3%
Oil and Gas Field Machinery
and Equipment Manufacturing NA NA NA
Table 8: Colorado Employment Growth Among Employer Establishments, 2005-2010
The Benefits of Natural Gas Production and Exports for U.S. Small Businesses | 15
Impact on Small Business
At the same time, while the number of businesses (in this
case, establishments) in the nation declined, in Colorado,
the number of establishments grew, and they expanded
robustly in the state’s energy sector. And it is critical to note
the role and growth of smaller businesses.
Table 9 makes clear that expanded production in the
energy sector has been a boon for small and midsize enter-
prises in the state. Or, to look at it from a different angle,
expanded energy production has been driven by small and
midsize businesses.
For all of the U.S., total employer establishments declined
by 1.4 percent from 2005 to 2010, including a 3.5 percent
decline in establishments with less than 20 workers, and a
3.1 percent fall in establishments with less than 500 work-
ers.
In Colorado, total establishments increased by 0.6 percent,
including a 1.2 percent increase among establishments with
less than 20 workers, and a 0.6 percent rise among those
with less than 500 workers.
Again, compare the U.S. decline to the growth in these
energy industries in Colorado:
• Among oil and gas extraction businesses, the number of
employer establishments grew by 7.6 percent, including
growth of 6.8 percent among establishments with less
than 20 workers and 7.0 percent among establishments
with less than 500 workers.
• Among drilling oil and gas wells businesses, the number
of employer establishments grew by 12.8 percent, includ-
ing growth of 12.7 percent among establishments with
less than 20 workers and 14.1 percent among establish-
ments with less than 500 workers.
• Among oil and gas operations businesses, the number
of employer establishments grew by 61.4 percent, includ-
ing growth of 58 percent among establishments with less
than 20 workers and 61 percent among establishments
with less than 500 workers.
• Among oil and gas pipeline and related structures con-
struction businesses, the number of employer establish-
ments grew by 2 percent, including growth of 14.3
percent among establishments with less than 20 workers
and 2 percent among those with less than 500 workers.
The growth in both jobs and small-midsize employer estab-
lishments in the energy sector has been noteworthy, again
especially given the abysmal performance of the overall
economy.
Finally, it must be noted that the Colorado energy sector in
fact is not all about huge enterprises. As noted in Table 9,
each energy sector looked at is overwhelmingly populated
by small and midsize establishments.
• Among oil and gas extraction businesses, 87.4 percent of
employer establishments in 2010 had less than 20 workers,
and 99.5 percent had fewer than 500 employees.
• Among drilling oil and gas wells businesses, 73.2 percent
of employer establishments in 2010 had less than 20
workers, and 100 percent had fewer than 500 employees.
• Among oil and gas operations businesses, 87.4 percent of
employer establishments in 2010 had less than 20 workers,
and 99.5 percent had fewer than 500 employees.
• Among oil and gas pipeline and related structures con-
struction businesses, 78.4 percent of employer estab-
lishments in 2010 had less than 20 workers, and 100
percent had fewer than 500 employees.
• Among oil and gas field machinery and equipment man-
ufacturing businesses, 75 percent of employer establish-
ments in 2010 had less than 20 workers, and 100 percent
had fewer than 500 employees.
16 | The Benefits of Natural Gas Production and Exports for U.S. Small Businesses
Colorado Total Establishments
Number of Employees As Percent of Total Firms
Total Less 20 Less 500 Less 20 Less 500
2005 151,070 133,125 150,799 88.1% 99.8%
2010 151,973 134,726 151,695 88.7% 99.8%
CO 05-10 0.6% 1.2% 0.6%
US 05-10 -1.4% -3.5% -3.1%
Oil/Gas Extraction Employer Establishments
Number of Employees As Percent of Total Firms
Total Less 20 Less 500 Less 20 Less 500
2005 369 325 369 88.1% 100%
2010 397 347 395 87.4% 99.5%
Chg 05-10 7.6% 6.8% 7.0%
Drilling Oil and Gas Wells Establishments
Number of Employees As Percent of Total Firms
Total Less 20 Less 500 Less 20 Less 500
2005 86 63 85 73.3% 98.8%
2010 97 71 97 73.2% 100%
Chg 05-10 12.8% 12.7% 14.1%
Support for Oil and Gas Operations Establishments
Number of Employees As Percent of Total Firms
Total Less 20 Less 500 Less 20 Less 500
2005 355 317 354 89.3% 99.7%
2010 573 501 570 87.4% 99.5%
Chg 05-10 61.4% 58.0% 61.0%
Oil and Gas Pipeline and Related Structures Construction Establishments
Number of Employees As Percent of Total Firms
Total Less 20 Less 500 Less 20 Less 500
2005 50 35 50 70.0% 100%
2010 51 40 51 78.4% 100%
Chg 05-10 2.0% 14.3% 2.0%
Oil and Gas Field Machinery and Equipment Manufacturing Establishments
Number of Employees As Percent of Total Firms
Total Less 20 Less 500 Less 20 Less 500
2005 5 3 5 60% 100%
2010 4 3 4 75% 100%
Chg 05-10 -20% 0% -20%
Table 9: Establishments – Colorado Total and Energy Industries, 2005-2010
The Benefits of Natural Gas Production and Exports for U.S. Small Businesses | 17
IV. Louisiana
The increase in natural gas production has been sizeable in Louisiana, to say the least. The state’s natural
gas production, as highlighted in Table 10, expanded by 133.7 percent from 2005 to 2011.
Impact on Jobs
Table 11 compares employment growth (again, all employ-
ment and business data from Census Bureau “County Busi-
ness Patterns” unless otherwise noted) among employer
establishments in the overall state, and in various energy
industry sectors. The difference in the employment story
between the energy sector and the overall economy is
notable, even with the decline in the oil and gas extraction
sector.
While overall employment declined between 2005 and
2010 in Louisiana – though at a much slower rate than the
decline in the U.S. overall – jobs grew markedly in the
energy sector given the expansion in energy production.
Table 10: Louisiana Natural Gas Marketed Production
2005: 1,296.0 billion cubic feet
2011: 3,029.2 billion cubic feet
Percent
Sector 2005 2010 Change
Total 1,617,507 1,599,551 -1.1%
Oil/Gas Extraction 10,280 8,565 -16.7%
Drilling Oil and Gas Wells 6,524 6,765 3.7%
Support for Oil and Gas Operations 26,069 32,247 23.7%
Oil and Gas Pipeline and
Related Structures Construction 14,452 28,897 100%
Oil and Gas Field Machinery
and Equipment Manufacturing NA 3,575 NA
Table 11: Louisiana Employment Growth Among Employer Establishments, 2005-2010
While Louisiana and U.S. total employmentdeclined, Louisiana
employment grew in three of the four energy sectors for which
data was available, expanding by the following:
• 3.7 percent in the drilling oil and gas wells sector;
• 23.7 percent in the support sector for oil and gas opera-
tions; and
• 100 percent in the oil and gas pipeline and related struc-
tures construction industry.
While Louisiana employers overall shed 17,956 jobs over
this period, employers in the four energy industries (where
data was available) included here added 19,149 jobs. That’s
an incredible contrast.
18 | The Benefits of Natural Gas Production and Exports for U.S. Small Businesses
Impact on Small Businesses
At the same time, while the number of businesses (in this
case, establishments) in the nation declined, in Louisiana,
the number of establishments grew, and they expanded
strongly in the state’s energy sector. It is critical to note the
role and growth of smaller businesses as well.
Table 12 makes clear that expanded production in the
energy sector has been a boon for small and midsize enter-
prises in the state. Or, to look at it from a different angle,
expanded energy production has been driven by small and
midsize businesses.
For all of the U.S., total employer establishments declined
by 1.4 percent from 2005 to 2010, including a 3.5 percent
decline in firms with less than 20 workers, and a 3.1 per-
cent fall in firms with less than 500 workers.
In Louisiana, total establishments increased by 0.6 percent,
including a 0.5 percent increase among establishments with
less than 20 workers, and a 0.6 percent rise among those
with less than 500 workers.
Again, compare the U.S. decline to the growth in these
energy industries in Louisiana:
• Among oil and gas extraction businesses, the number of
employer establishments grew by 6.0 percent, including
growth of 8.8 percent among establishments with less
than 20 workers and 6.6 percent among establishments
with less than 500 workers.
• Among oil and gas operations businesses, the number
of employer establishments grew by 24.1 percent, includ-
ing growth of 27.7 percent among establishments with
less than 20 workers and 24.6 percent among establish-
ments with less than 500 workers.
• Among oil and gas pipeline and related structures con-
struction businesses, the number of employer establish-
ments grew by 25.7 percent, including growth of 24.3
percent among establishments with less than 500 workers.
• Among field machinery and equipment manufacturing
businesses, the number of employer establishments grew
by 35.6 percent, including growth of 63 percent among
establishments with less than 20 workers and 35.6 per-
cent among establishments with less than 500 workers.
The growth in both jobs and small-midsize employer estab-
lishments in the energy sector has been noteworthy in
recent years, again especially given the abysmal perform-
ance of the overall economy.
Finally, it must be noted that the Louisiana energy sector
in fact is not all about huge enterprises. As noted in Table
12, each energy sector looked at is overwhelmingly popu-
lated by small and midsize establishments.
• Among oil and gas extraction businesses, 79.6 percent of
employer establishments in 2010 had less than 20 workers,
and 99.5 percent had fewer than 500 employees.
• Among drilling oil and gas wells businesses, 69.5 percent
of employer establishments in 2010 had less than 20 workers,
and 99.4 percent had fewer than 500 employees.
• Among oil and gas operations businesses, 74 percent of
employer establishments in 2010 had less than 20 work-
ers, and 98.9 percent had fewer than 500 employees.
• Among oil and gas pipeline and related structures con-
struction businesses, 43.9 percent of employer estab-
lishments in 2010 had less than 20 workers, and 97
percent had fewer than 500 employees.
• Among oil and gas field machinery and equipment man-
ufacturing businesses, 55 percent of employer establish-
ments in 2010 had less than 20 workers, and 100 percent
had fewer than 500 employees.
The Benefits of Natural Gas Production and Exports for U.S. Small Businesses | 19
Louisiana Total Establishments
Number of Employees As Percent of Total Firms
Total Less 20 Less 500 Less 20 Less 500
2005 102,790 87,638 102,526 85.3% 99.7%
2010 103,365 88,081 103,130 85.2% 99.8%
LA 05-10 0.6% 0.5% 0.6%
US 05-10 -1.4% -3.5% -3.1%
Oil/Gas Extraction Employer Establishments
Number of Employees As Percent of Total Firms
Total Less 20 Less 500 Less 20 Less 500
2005 397 308 393 77.6% 99.0%
2010 421 335 419 79.6% 99.5%
Chg 05-10 6.0% 8.8% 6.6%
Drilling Oil and Gas Wells Establishments
Number of Employees As Percent of Total Firms
Total Less 20 Less 500 Less 20 Less 500
2005 179 127 177 70.9% 98.9%
2010 177 123 176 69.5% 99.4%
Chg 05-10 -1.1% -3.1% -0.6%
Support for Oil and Gas Operations Establishments
Number of Employees As Percent of Total Firms
Total Less 20 Less 500 Less 20 Less 500
2005 738 531 727 72.0% 98.5%
2010 916 678 906 74.0% 98.9%
Chg 05-10 24.1% 27.7% 24.6%
Oil and Gas Pipeline and Related Structures Construction Establishments
Number of Employees As Percent of Total Firms
Total Less 20 Less 500 Less 20 Less 500
2005 105 58 103 55.2% 98.1%
2010 132 58 128 43.9% 97.0%
Chg 05-10 25.7% 0% 24.3%
Oil and Gas Field Machinery and Equipment Manufacturing Establishments
Number of Employees As Percent of Total Firms
Total Less 20 Less 500 Less 20 Less 500
2005 59 27 59 45.8% 100%
2010 80 44 80 55.0% 100%
Chg 05-10 35.6% 63.0% 35.6%
Table 12: Establishments – Louisiana Total and Energy Industries, 2005-2010
20 | The Benefits of Natural Gas Production and Exports for U.S. Small Businesses
V. North Dakota
The big energy story in North Dakota in recent years has been the increase in oil production, pushing the
state to ranking second among the states in oil output. At the same time,though,the increase in natural gas
production has been sizeable as well. The state’s natural gas production,as highlighted in Table 13,expanded
by 84.8 percent from 2005 to 2011.
Table 13: North Dakota Natural Gas Marketed Production
2005: 52.557 billion cubic feet
2011: 97.102 billion cubic feet
Percent
Sector 2005 2010 Change
Total 270,479 294,907 9.0%
Oil/Gas Extraction 1,130 1,607 42.2%
Drilling Oil and Gas Wells 554 1,442 160.3%
Support for Oil and Gas Operations 1,036 3,604 247.9%
Oil and Gas Pipeline and
Related Structures Construction NA 75 NA
Oil and Gas Field Machinery
and Equipment Manufacturing NA NA NA
Table 14: North Dakota Employment Growth Among Employer Establishments, 2005-2010
Impact on Jobs
Table 14 compares employment growth (again, all employ-
ment and business data from Census Bureau “County Busi-
ness Patterns” unless otherwise noted) among employer
establishments in the overall state, and in various energy
industry sectors. The difference in the employment story
between North Dakota, including its energy sector, and the
overall U.S. economy is striking.
While overall employment increased between 2005 and
2010 in North Dakota, jobs grew even faster in the energy
sector given the expansion in energy production.
While U.S. total employment declined, North Dakota
employment grew overall, including in each energy sector
for which data was available, expanding by the following:
• 42.2 percent in the oil and gas extraction sector;
• 160.3 percent in the drilling oil and gas wells sector; and
• 247.9 percent in the support sector for oil and gas oper-
ations.
North Dakota employers overall added 24,428 jobs over
this period, with employers in the three energy industries
(where data was available) included here adding 3,933.
The Benefits of Natural Gas Production and Exports for U.S. Small Businesses | 21
Impact on Small Businesses
At the same time, while the number of businesses (in this
case, establishments) in the nation declined, in North
Dakota, the number of establishments grew, and they
expanded strongly in the state’s energy sector. It is critical
to note the role and growth of smaller businesses as well.
Table 15 makes clear that expanded production in the
energy sector has been a boon for small and midsize enter-
prises in the state. Or, to look at it from a different angle,
expanded energy production has been driven by small and
midsize businesses.
For all of the U.S., total employer establishments declined
by 1.4 percent from 2005 to 2010, including a 3.5 percent
decline in establishments with less than 20 workers, and a
3.1 percent fall in establishments with less than 500 workers.
In North Dakota, total establishments increased by 3.7 per-
cent, including a 1.0 percent increase among establish-
ments with less than 20 workers, and a 2.5 percent rise
among those with less than 500 workers.
Again, compare the U.S. decline to the growth in these
energy industries in North Dakota:
• Among oil and gas extraction businesses, the number of
employer establishments grew by 28.1 percent, includ-
ing growth of 44 percent among establishments with less
than 20 workers and 32.3 percent among establishments
with less than 500 workers.
• Among drilling oil and gas wells businesses, the number
of employer establishments grew by 20 percent, includ-
ing growth of 18.2 percent among establishments with
less than 20 workers and 20 percent among establish-
ments with less than 500 workers.
• Among oil and gas operations businesses, the number
of employer establishments grew by 74.5 percent, includ-
ing growth of 46.1 percent among establishments with
less than 20 workers and 74.5 percent among establish-
ments with less than 500 workers.
The growth in both jobs and small-midsize employer estab-
lishments in the energy sector has been noteworthy in
recent years, especially given the abysmal performance of
the overall economy.
Finally, it must be noted that the North Dakota energy sec-
tor in fact is not all about huge enterprises. As noted in
Table 15, each energy sector looked at is overwhelmingly
populated by small and midsize establishments.
• Among oil and gas extraction businesses, 87.8 percent of
employer establishments in 2010 had less than 20 workers,
and 100 percent had fewer than 500 employees.
• Among drilling oil and gas wells businesses, 54.2 percent
of employer establishments in 2010 had less than 20
workers, and 100 percent had fewer than 500 employees.
• Among oil and gas operations businesses, 73 percent of
employer establishments in 2010 had less than 20 workers,
and 100 percent had fewer than 500 employees.
• Among oil and gas pipeline and related structures con-
struction businesses, 85.7 percent of employer estab-
lishments in 2010 had less than 20 workers, and 100
percent had fewer than 500 employees.
• Among oil and gas field machinery and equipment man-
ufacturing businesses, 33 percent of employer establish-
ments in 2010 had less than 20 workers, and 100 percent
had fewer than 500 employees.
22 | The Benefits of Natural Gas Production and Exports for U.S. Small Businesses
North Dakota Total Establishments
Number of Employees As Percent of Total Firms
Total Less 20 Less 500 Less 20 Less 500
2005 21,061 15,268 18,768 72.5% 89.1%
2010 21,832 15,427 19,236 70.7% 88.1%
ND 05-10 3.7% 1.0% 2.5%
US 05-10 -1.4% -3.5% -3.1%
Oil/Gas Extraction Employer Establishments
Number of Employees As Percent of Total Firms
Total Less 20 Less 500 Less 20 Less 500
2005 32 25 31 78.1% 96.9%
2010 41 36 41 87.8% 100%
Chg 05-10 28.1% 44.0% 32.3%
Drilling Oil and Gas Wells Establishments
Number of Employees As Percent of Total Firms
Total Less 20 Less 500 Less 20 Less 500
2005 20 11 20 55.0% 100%
2010 24 13 24 54.2% 100%
Chg 05-10 20.0% 18.2% 20.0%
Support for Oil and Gas Operations Establishments
Number of Employees As Percent of Total Firms
Total Less 20 Less 500 Less 20 Less 500
2005 102 89 102 87.3% 100%
2010 178 130 178 73.0% 100%
Chg 05-10 74.5% 46.1% 74.5%
Oil and Gas Pipeline and Related Structures Construction Establishments
Number of Employees As Percent of Total Firms
Total Less 20 Less 500 Less 20 Less 500
2005 7 6 7 85.7% 100%
2010 7 6 7 85.7% 100%
Chg 05-10 0% 0% 0%
Oil and Gas Field Machinery and Equipment Manufacturing Establishments
Number of Employees As Percent of Total Firms
Total Less 20 Less 500 Less 20 Less 500
2005 2 2 2 100% 100%
2010 3 1 3 33.0% 100%
Chg 05-10 50.0% -50.0% 50.0%
Table 15: Establishments – North Dakota Total and Energy Industries, 2005-2010
The Benefits of Natural Gas Production and Exports for U.S. Small Businesses | 23
VI. Ohio
The opportunity for increased shale natural gas production exists in Ohio, but is only beginning to move
forward. The state’s natural gas production, as noted in Table 16, actually contracted between 2005 and
2011, falling by 7.8 percent.
Again,though,theopportunitiesforexpandedproductioncertainlyexistwithboththeUticaandMarcellusShale
plays reaching into the state. In fact, it is worth noting that a December 2012 IHS study projected that jobs tied to
unconventionaloilandgasproductioninOhiocouldrisefrom38,830in2012to143,595in2020and266,624in2035.11
Table 16: Ohio Natural Gas Marketed Production
2005: 85.523 billion cubic feet
2011: 78.858 billion cubic feet
Percent
Sector 2005 2010 Change
Total 4,762,618 4,352,481 -8.6%
Oil/Gas Extraction 1,355 1,340 -1.1%
Drilling Oil and Gas Wells 515 542 5.7%
Support for Oil and Gas Operations 1,206 1,023 -15.2%
Oil and Gas Pipeline and
Related Structures Construction 2,281 2,411 5.7%
Oil and Gas Field Machinery
and Equipment Manufacturing NA NA NA
Table 17: Ohio Employment Growth Among Employer Establishments, 2005-2010
For good measure, a recent New York Times story noted
how investment in the state is stepping up.12
It was noted in
the report that “natural gas buried in shale thousands of feet
below the surface is attracting more than $1 billion in private
investment and rapidly reviving the area as an energy pro-
ducer. To prepare, market and transport the natural gas,
companies are building an expansive network of regional
field offices, processing plants and other infrastructure… In
public statements, though, energy industry executives have
said drilling and production are being impeded by a short-
age of processing plants and pipelines. Chesapeake and
other leading production and processing companies are
attacking that problem with an infrastructure development
program never seen here, said Thomas E. Stewart, executive
vice president of the Ohio Oil and Gas Association… With
all this energy-related construction, industry executives
believe that Ohio will produce two billion to three billion
cubic feet of processed gas daily within the decade.”
Impact on Jobs
Table 17 compares employment growth (again, all employ-
24 | The Benefits of Natural Gas Production and Exports for U.S. Small Businesses
ment and business data from Census Bureau “County Busi-
ness Patterns” unless otherwise noted) among employer
establishments in the overall state, and in various energy
industry sectors. Unfortunately, given the limited activity on
the energy front, Ohio has suffered along with the rest of
the nation during these tough economic times.
While U.S. total employment declined from 2005 to 2010,
it fell even more in Ohio. And the jobs story in the energy
sector was mixed, with employment:
• declining by 1.1 percent in the oil and gas extraction sector;
• increasing by 5.7 percent in the drilling oil and gas wells
sector;
• declining by 15.2 percent in the support sector for oil and
gas operations; and
• increasing by 5.7 percent in the oil and gas pipeline and
related structures construction.
Impact on Small Businesses
And while the number of businesses (in this case, estab-
lishments) in the nation declined, in Ohio, the decline was
even larger.
As noted in Table 18, for all of the U.S., total employer estab-
lishments declined by 1.4 percent from 2005 to 2010, includ-
ing a 3.5 percent decline in firms with less than 20 workers,
and a 3.1 percent fall in firms with less than 500 workers.
In Ohio, total establishments decreased by 6.4 percent,
including a 9.5 percent drop among establishments with
less than 20 workers, and a 8.6 percent fall off among those
with less than 500 workers.
Again, compared with the U.S. in general and other states
that have moved ahead aggressively on energy production,
Ohio’s numbers in the energy sector regarding establish-
ment growth have been very mixed:
• Among oil and gas extraction businesses, the number of
employer establishments fell by 5.7 percent, including a
fall of 6.2 percent among establishments with less than
20 workers and 5.7 percent among establishments with
less than 500 workers.
• Among drilling oil and gas wells businesses, the number
of employer establishments declined by 1.4 percent,
including growth of 5 percent among establishments with
less than 20 workers and a decline of 1.4 percent among
establishments with less than 500 workers.
• Among oil and gas operations businesses, the number
of employer establishments actually grew by 9.4 percent,
including growth of 9.4 percent among establishments
with less than 20 workers and 9.4 percent among estab-
lishments with less than 500 workers.
• Among oil and gas pipeline and related structures con-
struction businesses, the number of employer establish-
ments grew by 16.9 percent, including growth of 13.2
percent among establishments with less than 20 workers
and 19 percent among those with less than 500.
• Among oil and gas field machinery and equipment manu-
facturing businesses, the number of employer establish-
ments fell by 33.3 percent, including a decline of 50 percent
among establishments with less than 20 workers and 33.3
percent among establishments with less than 500 workers.
Nonetheless, it must be noted that the Ohio energy sector
still in fact is not about huge enterprises. As noted in Table
18, each energy sector looked at is overwhelmingly popu-
lated by small and midsize establishments.
• Among oil and gas extraction businesses, 92.9 percent of
employer establishments in 2010 had less than 20 work-
ers, and 100 percent had fewer than 500 employees.
• Among drilling oil and gas wells businesses, 91.3 percent
of employer establishments in 2010 had less than 20
workers, and 100 percent had fewer than 500 employees.
• Among oil and gas operations businesses, 92.1 percent
of employer establishments in 2010 had less than 20
workers, and 100 percent had fewer than 500 employees.
• Among oil and gas pipeline and related structures con-
struction businesses, 62.3 percent of employer estab-
lishments in 2010 had less than 20 workers, and 100
percent had fewer than 500 employees.
• Among oil and gas field machinery and equipment man-
ufacturing businesses, 66.7 percent of employer estab-
lishments in 2010 had less than 20 workers, and 100
percent had fewer than 500 employees.
In the end, the change in Ohio employment and small busi-
ness growth will increase like other states with significant
shale-based energy resources once the state starts moving
ahead aggressively with production. And that will only be
fed further via LNG exports.
The Benefits of Natural Gas Production and Exports for U.S. Small Businesses | 25
Ohio Total Establishments
Number of Employees As Percent of Total Firms
Total Less 20 Less 500 Less 20 Less 500
2005 270,968 181,984 223,825 67.2% 82.6%
2010 253,491 164,646 204,503 65.0% 80.7%
OH 05-10 -6.4% -9.5% -8.6%
US 05-10 -1.4% -3.5% -3.1%
Oil/Gas Extraction Employer Establishments
Number of Employees As Percent of Total Firms
Total Less 20 Less 500 Less 20 Less 500
2005 209 195 209 93.3% 100%
2010 197 183 197 92.9% 100%
Chg 05-10 -5.7% -6.2% -5.7%
Drilling Oil and Gas Wells Establishments
Number of Employees As Percent of Total Firms
Total Less 20 Less 500 Less 20 Less 500
2005 70 60 70 85.7% 100%
2010 69 63 69 91.3% 100%
Chg 05-10 -1.4% 5.0% -1.4%
Support for Oil and Gas Operations Establishments
Number of Employees As Percent of Total Firms
Total Less 20 Less 500 Less 20 Less 500
2005 138 127 138 92.0% 100%
2010 151 139 151 92.1% 100%
Chg 05-10 9.4% 9.4% 9.4%
Oil and Gas Pipeline and Related Structures Construction Establishments
Number of Employees As Percent of Total Firms
Total Less 20 Less 500 Less 20 Less 500
2005 59 38 58 64.4% 98.3%
2010 69 43 69 62.3% 100%
Chg 05-10 16.9% 13.2% 19.0%
Oil and Gas Field Machinery and Equipment Manufacturing Establishments
Number of Employees As Percent of Total Firms
Total Less 20 Less 500 Less 20 Less 500
2005 9 8 9 88.9% 100%
2010 6 4 6 66.7% 100%
Chg 05-10 -33.3% -50.0% -33.3%
Table 18: Establishments – Ohio Total and Energy Industries, 2005-2010
26 | The Benefits of Natural Gas Production and Exports for U.S. Small Businesses
Impact on Jobs
Table 20 compares employment growth (again, all employ-
ment and business data from Census Bureau “County Busi-
ness Patterns” unless otherwise noted) among employer
establishments in the overall state, and in various energy
industry sectors. The difference in the employment story
between Oklahoma, including its energy sector, and the
overall U.S. economy is striking.
While overall employment increased between 2005 and
2010 in Oklahoma, jobs grew robustly in the energy sector
given the expansion in energy production.
While U.S. total employment declined, Oklahoma employ-
ment grew overall, including in the energy sector, expand-
ing by the following:
VII. Oklahoma
Natural gas production in Oklahoma,as highlighted in Table 19,expanded by 15.2 percent from 2005 to 2011.
Table 19: Oklahoma Natural Gas Marketed Production
2005: 1,639.3 billion cubic feet
2011: 1,888.9 billion cubic feet
Percent
Sector 2005 2010 Change
Total 1,220,285 1,241,168 1.7%
Oil/Gas Extraction 9,878 14,685 48.7%
Drilling Oil and Gas Wells 6,460 7,317 13.3%
Support for Oil and Gas Operations 12,705 16,520 30.0%
Oil and Gas Pipeline and
Related Structures Construction 2,956 3,825 29.4%
Oil and Gas Field Machinery
and Equipment Manufacturing 3,746 3,744 -0.05%
Table 20: Oklahoma Employment Growth Among Employer Establishments, 2005-2010
• 48.7 percent in the oil and gas extraction sector;
• 13.3 percent in the drilling oil and gas wells sector;
• 30 percent in the support sector for oil and gas opera-
tions; and
• 29.4 percent in the oil and gas pipeline and related struc-
tures construction sector.
Oklahoma employers overall added 20,833 jobs over this
period, with employers in the energy industries included
here adding 10,346, or half the jobs added.
The Benefits of Natural Gas Production and Exports for U.S. Small Businesses | 27
Impact on Small Businesses
At the same time, while the number of businesses (in this
case, establishments) in the nation declined, in Oklahoma,
the number of establishments grew, and they expanded
strongly in the state’s energy sector. It is critical to note the
role and growth of smaller businesses as well.
Table 21 makes clear that expanded production in the
energy sector has been a boon for small and midsize enter-
prises in the state. Or, to look at it from a different angle,
expanded energy production has been driven by small and
midsize businesses.
For all of the U.S., total employer establishments declined
by 1.4 percent from 2005 to 2010, including a 3.5 percent
decline in firms with less than 20 workers, and a 3.1 per-
cent fall in firms with less than 500 workers.
In Oklahoma, total establishments increased by 1.7 percent,
including a 1.4 percent increase among establishments with
less than 20 workers, and a 1.7 percent rise among those
with less than 500 workers.
Again, compare the U.S. decline to the growth in these
energy industries in Oklahoma:
• Among oil and gas extraction businesses, the number of
employer establishments grew by 11.8 percent, includ-
ing growth of 10.2 percent among establishments with
less than 20 workers and 11.8 percent among establish-
ments with less than 500 workers.
• Among oil and gas operations businesses, the number
of employer establishments grew by 37.3 percent, includ-
ing growth of 35.7 percent among establishments with
less than 20 workers and 37.3 percent among establish-
ments with less than 500 workers.
• Among oil and gas pipeline and related structures con-
struction businesses, the number of employer establish-
ments grew by 14.3 percent, including growth of 9.0
percent among those with less than 20 workers and 13.3
percent among establishments with less than 500 work-
ers.
• Among oil and gas field machinery and equipment man-
ufacturing businesses, the number of employer estab-
lishments grew by 28.4 percent, including growth of 36.1
percent among those with less than 20 workers and 28.8
percent among those with less than 500 workers.
The growth in both jobs and small-midsize employer estab-
lishments in Oklahoma’s energy sector has been strong in
recent years, again especially given the abysmal perform-
ance of the overall U.S. economy.
Finally, it must be noted that the Oklahoma energy sector
in fact is not the domain of huge enterprises. As noted in
Table 21, each energy sector looked at is overwhelmingly
populated by small and midsize establishments.
• Among oil and gas extraction businesses, 90.6 percent of
employer establishments in 2010 had less than 20 workers,
and 99.9 percent had fewer than 500 employees.
• Among drilling oil and gas wells businesses, 79.7 percent
of employer establishments in 2010 had less than 20 workers,
and 98.3 percent had fewer than 500 employees.
• Among oil and gas operations businesses, 86.9 percent of
employer establishments in 2010 had less than 20 workers,
and 99.8 percent had fewer than 500 employees.
• Among oil and gas pipeline and related structures con-
struction businesses, 64.3 percent of employer estab-
lishments in 2010 had less than 20 workers, and 99.1
percent had fewer than 500 employees.
• Among oil and gas field machinery and equipment man-
ufacturing businesses, 57 percent of employer establish-
ments in 2010 had less than 20 workers, and 98.8 percent
had fewer than 500 employees.
28 | The Benefits of Natural Gas Production and Exports for U.S. Small Businesses
Oklahoma Total Establishments
Number of Employees As Percent of Total Firms
Total Less 20 Less 500 Less 20 Less 500
2005 88,548 76,986 88,369 86.9% 99.8%
2010 90,050 78,044 89,885 86.7% 99.8%
OK 05-10 1.7% 1.4% 1.7%
US 05-10 -1.4% -3.5% -3.1%
Oil/Gas Extraction Employer Establishments
Number of Employees As Percent of Total Firms
Total Less 20 Less 500 Less 20 Less 500
2005 1,076 989 1,075 91.9% 99.9%
2010 1,203 1,090 1,202 90.6% 99.9%
Chg 05-10 11.8% 10.2% 11.8%
Drilling Oil and Gas Wells Establishments
Number of Employees As Percent of Total Firms
Total Less 20 Less 500 Less 20 Less 500
2005 235 195 233 83.0% 99.1%
2010 237 189 233 79.7% 98.3%
Chg 05-10 0.9% -3.0% 0%
Support for Oil and Gas Operations Establishments
Number of Employees As Percent of Total Firms
Total Less 20 Less 500 Less 20 Less 500
2005 914 804 912 88.0% 99.8%
2010 1,255 1,091 1,252 86.9% 99.8%
Chg 05-10 37.3% 35.7% 37.3%
Oil and Gas Pipeline and Related Structures Construction Establishments
Number of Employees As Percent of Total Firms
Total Less 20 Less 500 Less 20 Less 500
2005 98 66 98 67.3% 100%
2010 112 72 111 64.3% 99.1%
Chg 05-10 14.3% 9.0% 13.3%
Oil and Gas Field Machinery and Equipment Manufacturing Establishments
Number of Employees As Percent of Total Firms
Total Less 20 Less 500 Less 20 Less 500
2005 67 36 66 53.7% 98.5%
2010 86 49 85 57.0% 98.8%
Chg 05-10 28.4% 36.1% 28.8%
Table 21: Establishments – Oklahoma Total and Energy Industries, 2005-2010
The Benefits of Natural Gas Production and Exports for U.S. Small Businesses | 29
Impact on Jobs
Table 23 compares employment growth (again, all employ-
ment and business data from Census Bureau “County Busi-
ness Patterns” unless otherwise noted) among employer
establishments in the overall state, and in various energy indus-
try sectors. The difference in the employment story between
the energy sector and the overall economy is striking.
While overall employment fell between 2005 and 2010,
jobs grew markedly in the energy sector given the expan-
sion in energy production.
While both U.S. and Pennsylvania total employment
declined from 2005 to 2010, Pennsylvania jobs grew by the
following:
• 80.8 percent in the oil and gas extraction sector;
• 218.7 percent in the drilling oil and gas wells sector;
• 120.7 percent in the support sector for oil and gas oper-
ations; and
• 150.3 percent in the oil and gas pipeline and related
structures construction sector.
While Pennsylvania employers overall shed 106,437 jobs
over this period, employers in the four energy industries
(where data was available) included here added more than
5,823 jobs.
VIII. Pennsylvania
The increase in natural gas production has been dramatic in Pennsylvania via the Marcellus Shale area.
The state’s natural gas production, as highlighted in Table 22, expanded by 677.8 percent from 2005 to 2011.
Table 22: Pennsylvania Natural Gas Marketed Production
2005: 168.5 billion cubic feet
2011: 1,310.6 billion cubic feet
Percent
Sector 2005 2010 Change
Total 5,082,630 4,976,193 -2.1%
Oil/Gas Extraction 1,809 3,270 80.8%
Drilling Oil and Gas Wells 846 2,696 218.7%
Support for Oil and Gas Operations 1,640 3,620 120.7%
Oil and Gas Pipeline and
Related Structures Construction 1,025 2,566 150.3%
Oil and Gas Field Machinery
and Equipment Manufacturing 347 301 -13.3%
Table 23: Pennsylvania Employment Growth Among Employer Establishments, 2005-2010
30 | The Benefits of Natural Gas Production and Exports for U.S. Small Businesses
Impact on Small Businesses
At the same time, while the number of businesses (in this
case, establishments) declined in the nation and in Penn-
sylvania, the number of establishments grew strongly
among Pennsylvania’s energy sector. And it is critical to
note the role and growth of smaller businesses.
Table 24 makes clear that expanded production in the
energy sector has been a boon for small and midsize enter-
prises in the state. Or, to look at it from a different angle,
expanded energy production has been driven by small and
midsize businesses.
For all of the U.S., total employer establishments declined
by 1.4 percent from 2005 to 2010, including a 3.5 percent
decline in firms with less than 20 workers, and a 3.1 per-
cent fall in firms with less than 500 workers.
In Pennsylvania, total establishments declined by 2.1 per-
cent, including a 2.2 percent fall among establishments with
less than 20 workers, and a 2.1 percent decline among
those with less than 500 workers.
Compare those declines to the growth in these energy
industries in Pennsylvania:
• Among oil and gas extraction businesses, the number of
employer establishments grew by 40.7 percent, includ-
ing growth of 36.3 percent among establishments with
less than 20 workers and 40.7 percent among establish-
ments with less than 500 workers.
• Among drilling oil and gas wells businesses, the number
of employer establishments grew by 104.2 percent,
including growth of 121.6 percent among establishments
with less than 20 workers and 102.1 percent among
establishments with less than 500 workers.
• Among supporting oil and gas operations businesses, the
number of employer establishments grew by 119.5 per-
cent, including growth of 111.7 percent among those
with less than 20 workers and 119.5 percent among
establishments with less than 500 workers.
• Among oil and gas pipeline and related structures con-
struction businesses, the number of employer establish-
ments grew by 14.8 percent, including growth of 13
percent among establishments with less than 500 workers.
The growth in both jobs and small-midsize employer estab-
lishments in the energy sector has been striking in recent
years, especially given the abysmal performance of the
overall economy.
Finally, it must be noted that the Pennsylvania energy sec-
tor is not all about huge enterprises. As noted in Table 24,
each energy sector looked at is overwhelmingly populated
by small and midsize establishments.
• Among oil and gas extraction businesses, 80.1 percent of
employer establishments in 2010 had less than 20 workers,
and 100 percent had fewer than 500 employees.
• Among drilling oil and gas wells businesses, 83.7 percent
of employer establishments in 2010 had less than 20
workers, and 99 percent had fewer than 500 employees.
• Among oil and gas operations businesses, 75.1 percent
of employer establishments in 2010 had less than 20
workers, and 100 percent had fewer than 500 employees.
• Among oil and gas pipeline and related structures con-
struction businesses, 74.2 percent of employer estab-
lishments in 2010 had less than 20 workers, and 98.4
percent had fewer than 500 employees.
• Among oil and gas field machinery and equipment man-
ufacturing establishments, 50 percent of employer estab-
lishments in 2010 had less than 20 workers, and 100
percent had fewer than 500 employees.
The Benefits of Natural Gas Production and Exports for U.S. Small Businesses | 31
Pennsylvania Total Establishments
Number of Employees As Percent of Total Firms
Total Less 20 Less 500 Less 20 Less 500
2005 303,333 258,823 302,449 85.3% 99.7%
2010 297,023 253,251 296,208 85.3% 99.7%
PA 05-10 -2.1% -2.2% -2.1%
US 05-10 -1.4% -3.5% -3.1%
Oil/Gas Extraction Employer Establishments
Number of Employees As Percent of Total Firms
Total Less 20 Less 500 Less 20 Less 500
2005 150 124 150 82.7% 100%
2010 211 169 211 80.1% 100%
Chg 05-10 40.7% 36.3% 40.7%
Drilling Oil and Gas Wells Establishments
Number of Employees As Percent of Total Firms
Total Less 20 Less 500 Less 20 Less 500
2005 48 37 48 77.1% 100%
2010 98 82 97 83.7% 99.0%
Chg 05-10 104.2% 121.6% 102.1%
Support for Oil and Gas Operations Establishments
Number of Employees As Percent of Total Firms
Total Less 20 Less 500 Less 20 Less 500
2005 77 60 77 77.9% 100%
2010 169 127 169 75.1% 100%
Chg 05-10 119.5% 111.7% 119.5%
Oil and Gas Pipeline and Related Structures Construction Establishments
Number of Employees As Percent of Total Firms
Total Less 20 Less 500 Less 20 Less 500
2005 54 46 54 85.2% 100%
2010 62 46 61 74.2% 98.4%
Chg 05-10 14.8% 0% 13.0%
Oil and Gas Field Machinery and Equipment Manufacturing Establishments
Number of Employees As Percent of Total Firms
Total Less 20 Less 500 Less 20 Less 500
2005 11 5 11 45.5% 100%
2010 10 5 10 50.0% 100%
Chg 05-10 -9.1% 0% -9.1%
Table 24: Establishments – Pennsylvania Total and Energy Industries, 2005-2010
32 | The Benefits of Natural Gas Production and Exports for U.S. Small Businesses
Impact on Jobs
Table 26 compares employment growth (all employment
and business data from Census Bureau “County Business
Patterns” unless otherwise noted) among employer estab-
lishments in the overall state, and in various energy indus-
try sectors.
The difference in the employment story in Texas versus the
U.S. at large is breathtaking, including the growth in the
Texas energy sector.
While Texas total employment increased by 5.8% percent
from 2005 to 2010, jobs grew by the following:
• 25.7 percent in the oil and gas extraction sector;
• 3.8 percent in the drilling oil and gas wells sector;
• 47.9 percent in the support sector for oil and gas opera-
tions;
• 42.3 percent in the oil and gas pipeline and related struc-
tures construction sector; and
• 28.8 percent in the oil and gas field machinery and equip-
ment manufacturing sector.
Texas employers overall added 480,136 jobs over this
period, including employers in the energy industries
included here adding 53,692 jobs.
IX. Texas
The increase in natural gas production has been considerable in Texas. The state’s natural gas production,
as highlighted in Table 25, expanded by 34.8 percent from 2005 to 2011.
Table 25: Texas Natural Gas Marketed Production
2005: 5,276.4 billion cubic feet
2011: 7,112.9 billion cubic feet
Percent
Sector 2005 2010 Change
Total 8,305,102 8,785,238 5.8%
Oil/Gas Extraction 34,124 42,889 25.7%
Drilling Oil and Gas Wells 31,310 32,485 3.8%
Support for Oil and Gas Operations 53,064 78,505 47.9%
Oil and Gas Pipeline and
Related Structures Construction 29,299 41,699 42.3%
Oil and Gas Field Machinery
and Equipment Manufacturing 20,544 26,455 28.8%
Table 26: Texas Employment Growth Among Employer Establishments, 2005-2010
The Benefits of Natural Gas Production and Exports for U.S. Small Businesses | 33
Impact on Small Businesses
At the same time, while the number of businesses (in this
case, establishments) declined in the nation, the number of
establishments grew strongly in Texas, including in the
energy sector. And it is critical to note the role and growth
of smaller businesses.
Table 27 makes clear that expanded production in the
energy sector has been a boon for small and midsize enter-
prises in the state. Or, to look at it from a different angle,
expanded energy production has been driven by small and
midsize businesses.
For all of the U.S., total employer establishments declined
by 1.4 percent from 2005 to 2010, including a 3.5 percent
decline in firms with less than 20 workers, and a 3.1 per-
cent fall in firms with less than 500 workers.
In Texas, total establishments increased by 4.9 percent,
including a 4.7 percent increase among establishments with
less than 20 workers, and a 4.9 percent increase among
those with less than 500 workers. The growth in energy
industries in Texas were:
• Among oil and gas extraction businesses, the number of
employer establishments grew by 9 percent, including
growth of 6.7 percent among establishments with less
than 20 workers and 9.1 percent among establishments
with less than 500 workers.
• Among drilling oil and gas wells businesses, the number
of employer establishments grew by 19.1 percent, includ-
ing growth of 12 percent among establishments with less
than 20 workers and 20.7 percent among establishments
with less than 500 workers.
• Among supporting oil and gas operations businesses, the
number of employer establishments grew by 34.2 per-
cent, including growth of 29.4 percent among establish-
ments with less than 20 workers and 34.4 percent among
establishments with less than 500 workers.
• Among oil and gas pipeline and related structures con-
struction businesses, the number of employer establish-
ments grew by 37.8 percent, including growth of 36
percent among establishments with less than 20 workers
and 38.2 percent among establishments with less than
500 workers.
• Among oil and gas field machinery and equipment man-
ufacturing businesses, the number of employer estab-
lishments grew by 11.4 percent, including growth of 14.8
percent among establishments with less than 20 workers
and 11.4 percent among those with less than 500.
The growth in both jobs and small-midsize employer estab-
lishments in the energy sector has been striking in recent
years, especially given the abysmal performance of the
overall economy.
Finally, it must be noted that the Texas energy sector in fact
is not all about so-called “Big Oil.” As noted in Table 27,
each energy sector looked at is overwhelmingly populated
by small and midsize establishments.
• Among oil and gas extraction businesses, 88.7 percent of
employer establishments in 2010 had less than 20 workers,
and 99.9 percent had fewer than 500 employees.
• Among drilling oil and gas wells businesses, 72 percent of
employer establishments in 2010 had less than 20 workers,
and 98.6 percent had fewer than 500 employees.
• Among oil and gas operations businesses, 78.3 percent of
employer establishments in 2010 had less than 20 workers,
and 99.6 percent had fewer than 500 employees.
• Among oil and gas pipeline and related structures con-
struction businesses, 53.3 percent of employer estab-
lishments in 2010 had less than 20 workers, and 97
percent had fewer than 500 employees.
• Among oil and gas field machinery and equipment man-
ufacturing establishments, 54.4 percent of employer
establishments in 2010 had less than 20 workers, and
96.8 percent had fewer than 500 employees.
34 | The Benefits of Natural Gas Production and Exports for U.S. Small Businesses
Texas Total Establishments
Number of Employees As Percent of Total Firms
Total Less 20 Less 500 Less 20 Less 500
2005 497,758 423,838 496,364 85.1% 99.7%
2010 522,146 443,599 520,718 85.0% 99.7%
TX 05-10 4.9% 4.7% 4.9%
US 05-10 -1.4% -3.5% -3.1%
Oil/Gas Extraction Employer Establishments
Number of Employees As Percent of Total Firms
Total Less 20 Less 500 Less 20 Less 500
2005 2,958 2,681 2,952 90.6% 99.8%
2010 3,225 2,860 3,222 88.7% 99.9%
Chg 05-10 9.0% 6.7% 9.1%
Drilling Oil and Gas Wells Establishments
Number of Employees As Percent of Total Firms
Total Less 20 Less 500 Less 20 Less 500
2005 587 449 571 76.5% 97.3%
2010 699 503 689 72.0% 98.6%
Chg 05-10 19.1% 12.0% 20.7%
Support for Oil and Gas Operations Establishments
Number of Employees As Percent of Total Firms
Total Less 20 Less 500 Less 20 Less 500
2005 2,377 1,930 2,365 81.2% 99.5%
2010 3,191 2,497 3,179 78.3% 99.6%
Chg 05-10 34.2% 29.4% 34.4%
Oil and Gas Pipeline and Related Structures Construction Establishments
Number of Employees As Percent of Total Firms
Total Less 20 Less 500 Less 20 Less 500
2005 365 197 353 54.0% 96.7%
2010 503 268 488 53.3% 97.0%
Chg 05-10 37.8% 36.0% 38.2%
Oil and Gas Field Machinery and Equipment Manufacturing Establishments
Number of Employees As Percent of Total Firms
Total Less 20 Less 500 Less 20 Less 500
2005 307 162 297 52.8% 96.7%
2010 342 186 331 54.4% 96.8%
Chg 05-10 11.4% 14.8% 11.4%
Table 27: Establishments – Texas Total and Energy Industries, 2005-2010
The Benefits of Natural Gas Production and Exports for U.S. Small Businesses | 35
Impact on Jobs
Table 29 compares employment growth (again, all employ-
ment and business data from Census Bureau “County Busi-
ness Patterns” unless otherwise noted) among employer
establishments in the overall state, and in various energy
industry sectors.
The difference in the employment story in Utah versus the
U.S. at large is striking, including the growth in the Utah
energy sector.
While Utah total employment increased by 4.8% percent
from 2005 to 2010, jobs grew by the following:
• 22.9 percent in the oil and gas extraction sector;
• 17.4 percent in the drilling oil and gas wells sector; and
• 50.1 percent in the support sector for oil and gas opera-
tions.
Utah employers overall added 46,457 jobs over this period,
including employers in the energy industries included here
adding 1,038 jobs.
X. Utah
The increase in natural gas production has been sizeable in Utah. The state’s natural gas production, as
highlighted in Table 28, expanded by 51.9 percent from 2005 to 2011.
Table 28: Utah Natural Gas Marketed Production
2005: 301.2 billion cubic feet
2011: 457.5 billion cubic feet
Percent
Sector 2005 2010 Change
Total 974,686 1,021,143 4.8%
Oil/Gas Extraction 1,027 1,262 22.9%
Drilling Oil and Gas Wells 610 716 17.4%
Support for Oil and Gas Operations 1,582 2,374 50.1%
Oil and Gas Pipeline and
Related Structures Construction 547 452 -17.4%
Oil and Gas Field Machinery
and Equipment Manufacturing NA NA NA
Table 29: Utah Employment Growth Among Employer Establishments, 2005-2010
36 | The Benefits of Natural Gas Production and Exports for U.S. Small Businesses
Impact on Small Businesses
At the same time, while the number of businesses (in this
case, establishments) declined in the nation, the number of
establishments grew strongly in Utah, including in the
energy sector. And it is critical to note the role and growth
of smaller businesses.
Table 30 makes clear that expanded production in the
energy sector has been a boon for small and midsize enter-
prises in the state. Or, to look at it from a different angle,
expanded energy production has been driven by small and
midsize businesses.
For all of the U.S., total employer establishments declined
by 1.4 percent from 2005 to 2010, including a 3.5 percent
decline in firms with less than 20 workers, and a 3.1 per-
cent fall in firms with less than 500 workers.
In Utah, though, total establishments increased by 5.0 per-
cent, including a 5.3 percent rise among establishments
with less than 20 workers, and a 5.0 percent increase
among those with less than 500 workers. The growth in
energy industries in Utah were:
• Among oil and gas extraction businesses, the number of
employer establishments grew by 3.6 percent, including
growth of 10 percent among establishments with less
than 20 workers and 3.6 percent among establishments
with less than 500 workers.
• Among drilling oil and gas wells businesses, the number
of employer establishments grew by 56.8 percent, includ-
ing growth of 33.3 percent among establishments with
less than 20 workers and 56.8 percent among establish-
ments with less than 500 workers.
• Among supporting oil and gas operations businesses, the
number of employer establishments grew by 41.2 per-
cent, including growth of 39.9 percent among establish-
ments with less than 20 workers and 41.2 percent among
establishments with less than 500 workers.
• Among oil and gas pipeline and related structures con-
struction businesses, the number of employer establish-
ments grew by 4.2 percent, including growth of 4.2 percent
among establishments with less than 500 workers.
• Among oil and gas field machinery and equipment manu-
facturing businesses, the number of employer establish-
ments grew by 33.3 percent, including growth of 33.3
percent among establishments with less than 500 workers.
The growth in both jobs and small-midsize employer estab-
lishments in the energy sector has been striking in recent
years, especially given the abysmal performance of the
overall economy.
Finally, it must be noted that the Utah energy sector in fact
is not all about large companies. As noted in Table 30, each
energy sector looked at is overwhelmingly populated by
small and midsize establishments.
• Among oil and gas extraction businesses, 75.9 percent of
employer establishments in 2010 had less than 20 workers,
and 100 percent had fewer than 500 employees.
• Among drilling oil and gas wells businesses, 75.9 percent
of employer establishments in 2010 had less than 20
workers, and 100 percent had fewer than 500 employees.
• Among oil and gas operations businesses, 89.2 percent
of employer establishments in 2010 had less than 20
workers, and 100 percent had fewer than 500 employees.
• Among oil and gas pipeline and related structures con-
struction businesses, 64 percent of employer establish-
ments in 2010 had less than 20 workers, and 100 percent
had fewer than 500 employees.
• Among oil and gas field machinery and equipment man-
ufacturing establishments, 75 percent of employer estab-
lishments in 2010 had less than 20 workers, and 100
percent had fewer than 500 employees.
The Benefits of Natural Gas Production and Exports for U.S. Small Businesses | 37
Utah Total Establishments
Number of Employees As Percent of Total Firms
Total Less 20 Less 500 Less 20 Less 500
2005 65,549 57,040 65,399 87.0% 99.8%
2010 68,820 60,074 68,656 87.3% 99.8%
UT 05-10 5.0% 5.3% 5.0%
US 05-10 -1.4% -3.5% -3.1%
Oil/Gas Extraction Employer Establishments
Number of Employees As Percent of Total Firms
Total Less 20 Less 500 Less 20 Less 500
2005 56 40 56 71.4% 100%
2010 58 44 58 75.9% 100%
Chg 05-10 3.6% 10.0% 3.6%
Drilling Oil and Gas Wells Establishments
Number of Employees As Percent of Total Firms
Total Less 20 Less 500 Less 20 Less 500
2005 37 33 37 89.2% 100%
2010 58 44 58 75.9% 100%
Chg 05-10 56.8% 33.3% 56.8%
Support for Oil and Gas Operations Establishments
Number of Employees As Percent of Total Firms
Total Less 20 Less 500 Less 20 Less 500
2005 170 153 170 90.0% 100%
2010 240 214 240 89.2% 100%
Chg 05-10 41.2% 39.9% 41.2%
Oil and Gas Pipeline and Related Structures Construction Establishments
Number of Employees As Percent of Total Firms
Total Less 20 Less 500 Less 20 Less 500
2005 24 18 24 75.0% 100%
2010 25 16 25 64.0% 100%
Chg 05-10 4.2% -11.1% 4.2%
Oil and Gas Field Machinery and Equipment Manufacturing Establishments
Number of Employees As Percent of Total Firms
Total Less 20 Less 500 Less 20 Less 500
2005 3 3 3 100% 100%
2010 4 3 4 75% 100%
Chg 05-10 33.3% 0% 33.3%
Table 30: Establishments – Utah Total and Energy Industries, 2005-2010
38 | The Benefits of Natural Gas Production and Exports for U.S. Small Businesses
Impact on Jobs
Table 32 compares employment growth (all employment
and business data from Census Bureau “County Business
Patterns” unless otherwise noted) among employer estab-
lishments in the overall state, and in various energy indus-
try sectors. The key point in the employment story in West
Virginia has to do with the energy sector.
While West Virginia total employment decreased by 0.9%
percent from 2005 to 2010, jobs grew by the following:
• 44.2 percent in the oil and gas extraction sector;
• 9.4 percent in the drilling oil and gas wells sector; and
• 99 percent in the support sector for oil and gas opera-
tions.
West Virginia employers overall shed 5,049 jobs over this
period, yet employers in the energy industries included
here (three for which there are data) added 2,028 jobs.
XI. West Virginia
The increase in natural gas production has been sizeable in West Virginia.The state’s natural gas production,
as highlighted in Table 31, expanded by 78.2 percent from 2005 to 2011.
Table 31: West Virginia Natural Gas Marketed Production
2005: 221.1 billion cubic feet
2011: 394.1 billion cubic feet
Percent
Sector 2005 2010 Change
Total 565,499 560,450 -0.9%
Oil/Gas Extraction 1,806 2,605 44.2%
Drilling Oil and Gas Wells 929 1,016 9.4%
Support for Oil and Gas Operations 1,154 2,296 99.0%
Oil and Gas Pipeline and
Related Structures Construction 868 1,000-2,499 NA
Oil and Gas Field Machinery
and Equipment Manufacturing NA NA NA
Table 32: West Virginia Employment Growth Among Employer Establishments, 2005-2010
The Benefits of Natural Gas Production and Exports for U.S. Small Businesses | 39
Impact on Small Businesses
At the same time, while the number of businesses (in this
case, establishments) declined in the nation and in West
Virginia overall, the number of establishments grew strongly
in West Virginia’s energy sector. And it is critical to note the
role and growth of smaller businesses.
Table 33 makes clear that expanded production in the
energy sector has been a boon for small and midsize enter-
prises in the state. Or, to look at it from a different angle,
expanded energy production has been driven by small and
midsize businesses.
For all of the U.S., total employer establishments declined
by 1.4 percent from 2005 to 2010, including a 3.5 percent
decline in firms with less than 20 workers, and a 3.1 per-
cent fall in firms with less than 500 workers.
In West Virginia, total establishments declined by 5.0 per-
cent, including a 5.5 percent fall among establishments with
less than 20 workers, and a 5.0 percent decline among
those with less than 500 workers. However, the growth in
energy industries in West Virginia were:
• Among oil and gas extraction businesses, the number of
employer establishments grew by 9.6 percent, including
growth of 5.3 percent among establishments with less
than 20 workers and 9.6 percent among establishments
with less than 500 workers.
• Among drilling oil and gas wells businesses, the number
of employer establishments grew by 12.5 percent, includ-
ing growth of 36.6 percent among establishments with
less than 20 workers and 12.5 percent among establish-
ments with less than 500 workers.
• Among supporting oil and gas operations businesses, the
number of employer establishments grew by 48.3 per-
cent, including growth of 45.2 percent among establish-
ments with less than 20 workers and 48.3 percent among
establishments with less than 500 workers.
• Among oil and gas pipeline and related structures con-
struction businesses, the number of employer establish-
ments grew by 14.3 percent, including growth of 30.2
percent among establishments with less than 20 workers,
and 14.3 percent among establishments with less than
500 workers.
The growth in both jobs and small-midsize employer estab-
lishments in the energy sector has been striking in recent
years, especially given the abysmal performance of the
overall economy.
Finally, it must be noted that the West Virginia energy sec-
tor in fact is not all about huge enterprises. As noted in
Table 33, each energy sector looked at is overwhelmingly
populated by small and midsize establishments.
• Among oil and gas extraction businesses, 86.9 percent of
employer establishments in 2010 had less than 20 workers,
and 100 percent had fewer than 500 employees.
• Among drilling oil and gas wells businesses, 77.8 percent
of employer establishments in 2010 had less than 20
workers, and 100 percent had fewer than 500 employees.
• Among oil and gas operations businesses, 82.2 percent
of employer establishments in 2010 had less than 20
workers, and 100 percent had fewer than 500 employees.
• Among oil and gas pipeline and related structures con-
struction businesses, 75 percent of employer establish-
ments in 2010 had less than 20 workers, and 100 percent
had fewer than 500 employees.
• Among oil and gas field machinery and equipment man-
ufacturing establishments, 50 percent of employer estab-
lishments in 2010 had less than 20 workers, and 100
percent had fewer than 500 employees.
40 | The Benefits of Natural Gas Production and Exports for U.S. Small Businesses
West Virginia Total Establishments
Number of Employees As Percent of Total Firms
Total Less 20 Less 500 Less 20 Less 500
2005 40,735 35,419 40,656 86.9% 99.8%
2010 38,676 33,463 38,604 86.5% 99.8%
WV 05-10 -5.0% -5.5% -5.0%
US 05-10 -1.4% -3.5% -3.1%
Oil/Gas Extraction Employer Establishments
Number of Employees As Percent of Total Firms
Total Less 20 Less 500 Less 20 Less 500
2005 188 170 188 90.4% 100%
2010 206 179 206 86.9% 100%
Chg 05-10 9.6% 5.3% 9.6%
Drilling Oil and Gas Wells Establishments
Number of Employees As Percent of Total Firms
Total Less 20 Less 500 Less 20 Less 500
2005 40 26 40 65.0% 100%
2010 45 35 45 77.8% 100%
Chg 05-10 12.5% 36.6% 12.5%
Support for Oil and Gas Operations Establishments
Number of Employees As Percent of Total Firms
Total Less 20 Less 500 Less 20 Less 500
2005 87 73 87 83.9% 100%
2010 129 106 129 82.2% 100%
Chg 05-10 48.3% 45.2% 48.3%
Oil and Gas Pipeline and Related Structures Construction Establishments
Number of Employees As Percent of Total Firms
Total Less 20 Less 500 Less 20 Less 500
2005 35 23 35 65.7% 100%
2010 40 30 40 75.0% 100%
Chg 05-10 14.3% 30.4% 14.3%
Oil and Gas Field Machinery and Equipment Manufacturing Establishments
Number of Employees As Percent of Total Firms
Total Less 20 Less 500 Less 20 Less 500
2005 4 2 4 50.0% 100%
2010 2 1 2 50.0% 100%
Chg 05-10 -50.0% -50.0% -50.0%
Table 33: Establishments – West Virginia Total and Energy Industries, 2005-2010
The Benefits of Natural Gas Production and Exports for U.S. Small Businesses | 41
Impact on Jobs
Table 35 compares employment growth (again, all employ-
ment and business data from Census Bureau “County Busi-
ness Patterns” unless otherwise noted) among employer
establishments in the overall state, and in various energy
industry sectors.
Employment growth in Wyoming was positive over the
period of 2005 to 2010, compared to a decline nationally,
with Wyoming’s energy sector showing particularly solid
expansion.
While Wyoming total employment increased by 6.8% percent
from 2005 to 2010, jobs grew by the following:
• 34.9 percent in the oil and gas extraction sector;
• 35.3 percent in the drilling oil and gas wells sector;
• 2.2 percent in the support sector for oil and gas opera-
tions; and
• 234.9 percent in the oil and gas pipeline and related
structures construction sector.
Wyoming employers overall added 13,112 jobs over this
period, yet employers in the energy industries included
here (four for which there are data) added 3,751 jobs.
XII. Wyoming
The increase in natural gas production has been notable in Wyoming. The state’s natural gas production,as
highlighted in Table 34, expanded by 31.7 percent from 2005 to 2011.
Table 34: Wyoming Natural Gas Marketed Production
2005: 1,639.3 billion cubic feet
2011: 2,159.4 billion cubic feet
Percent
Sector 2005 2010 Change
Total 191,934 205,046 6.8%
Oil/Gas Extraction 2,663 3,592 34.9%
Drilling Oil and Gas Wells 3,041 3,604 35.3%
Support for Oil and Gas Operations 7,342 7,506 2.2%
Oil and Gas Pipeline and
Related Structures Construction 892 2,987 234.9%
Oil and Gas Field Machinery
and Equipment Manufacturing NA 364 NA
Table 35: Wyoming Employment Growth Among Employer Establishments, 2005-2010
42 | The Benefits of Natural Gas Production and Exports for U.S. Small Businesses
Impact on Small Businesses
At the same time, while the number of businesses (in this
case, establishments) declined in the nation, the number of
establishments grew in Wyoming, including in the energy
sector. And it is critical to note the role and growth of
smaller businesses.
Table 36 makes clear that expanded production in the
energy sector has been a boon for small and midsize enter-
prises in the state. Or, to look at it from a different angle,
expanded energy production has been driven by small and
midsize businesses.
For all of the U.S., total employer establishments declined
by 1.4 percent from 2005 to 2010, including a 3.5 percent
decline in firms with less than 20 workers, and a 3.1 per-
cent fall in firms with less than 500 workers.
In Wyoming, total establishments increased by 2.5 percent,
including a 2.6 percent rose among establishments with less
than 20 workers, and a 2.5 percent increased among those
with less than 500 workers.
The growth in energy industries in Wyoming was:
• Among drilling oil and gas wells businesses, the number
of employer establishments grew by 20.6 percent, includ-
ing growth of 19.6 percent among establishments with
less than 20 workers and 20.6 percent among establish-
ments with less than 500 workers.
• Among supporting oil and gas operations businesses, the
number of employer establishments grew by 13.6 per-
cent, including growth of 13.3 percent among establish-
ments with less than 20 workers and 13.9 percent among
establishments with less than 500 workers.
• Among oil and gas pipeline and related structures con-
struction businesses, the number of employer establish-
ments grew by 40.7 percent, including growth of 51.3
percent among establishments with less than 20 workers,
and 38.9 percent among establishments with less than
500 workers.
The growth in both jobs and small-midsize employer estab-
lishments in the energy sector has been striking in recent
years, especially given the abysmal performance of the
overall economy.
Finally, it must be noted that the Wyoming energy sector in
fact is not all about big businesses. As noted in Table 36,
each energy sector looked at is overwhelmingly populated
by small and midsize firms.
• Among oil and gas extraction businesses, 75.6 percent of
employer establishments in 2010 had less than 20 workers,
and 100 percent had fewer than 500 employees.
• Among drilling oil and gas wells businesses, 75.8 percent
of employer establishments in 2010 had less than 20
workers, and 100 percent had fewer than 500 employees.
• Among oil and gas operations businesses, 83.5 percent of
employer establishments in 2010 had less than 20 workers,
and 99.6 percent had fewer than 500 employees.
• Among oil and gas pipeline and related structures con-
struction businesses, 73.7 percent of employer estab-
lishments in 2010 had less than 20 workers, and 98.7
percent had fewer than 500 employees.
• Among oil and gas field machinery and equipment man-
ufacturing establishments, 45.5 percent of employer
establishments in 2010 had less than 20 workers, and 100
percent had fewer than 500 employees.
The Benefits of Natural Gas Production and Exports for U.S. Small Businesses | 43
Wyoming Virginia Total Establishments
Number of Employees As Percent of Total Firms
Total Less 20 Less 500 Less 20 Less 500
2005 19,736 17,804 19,715 90.2% 99.9%
2010 20,231 18,270 20,213 90.3% 99.9%
WY 05-10 2.5% 2.6% 2.5%
US 05-10 -1.4% -3.5% -3.1%
Oil/Gas Extraction Employer Establishments
Number of Employees As Percent of Total Firms
Total Less 20 Less 500 Less 20 Less 500
2005 205 159 205 77.6% 100%
2010 180 136 180 75.6% 100%
Chg 05-10 -12.2% -14.5% -12.2%
Drilling Oil and Gas Wells Establishments
Number of Employees As Percent of Total Firms
Total Less 20 Less 500 Less 20 Less 500
2005 98 81 98 82.7% 100%
2010 128 97 128 75.8% 100%
Chg 05-10 20.6% 19.6% 20.6%
Support for Oil and Gas Operations Establishments
Number of Employees As Percent of Total Firms
Total Less 20 Less 500 Less 20 Less 500
2005 412 345 409 83.7% 99.3%
2010 468 391 466 83.5% 99.6%
Chg 05-10 13.6% 13.3% 13.9%
Oil and Gas Pipeline and Related Structures Construction Establishments
Number of Employees As Percent of Total Firms
Total Less 20 Less 500 Less 20 Less 500
2005 54 37 54 68.5% 100%
2010 76 56 75 73.7% 98.7%
Chg 05-10 40.7% 51.3% 38.9%
Oil and Gas Field Machinery and Equipment Manufacturing Establishments
Number of Employees As Percent of Total Firms
Total Less 20 Less 500 Less 20 Less 500
2005 11 8 11 72.7 100%
2010 11 5 11 45.5% 100%
Chg 05-10 0% -37.5% 0%
Table 36: Establishments – Wyoming Total and Energy Industries, 2005-2010
Report: Benefits of Natural Gas Production & Exports for US Small Businesses

Más contenido relacionado

La actualidad más candente

VF: Exploration and Production: Q4 2018 | Region Focus: Appalachia
VF: Exploration and Production: Q4 2018 | Region Focus: AppalachiaVF: Exploration and Production: Q4 2018 | Region Focus: Appalachia
VF: Exploration and Production: Q4 2018 | Region Focus: AppalachiaMercer Capital
 
EY Price Point: global oil and gas market outlook, Q2, April 2020
EY Price Point: global oil and gas market outlook, Q2, April 2020EY Price Point: global oil and gas market outlook, Q2, April 2020
EY Price Point: global oil and gas market outlook, Q2, April 2020EY
 
Bord Gáis Energy Index August 2015
Bord Gáis Energy Index August 2015Bord Gáis Energy Index August 2015
Bord Gáis Energy Index August 2015Bord Gáis Energy
 
What is Carbon Tax or a Price for Carbon
What is Carbon Tax or a Price for CarbonWhat is Carbon Tax or a Price for Carbon
What is Carbon Tax or a Price for Carbonpaul young cpa, cga
 
Report: The Economics of Shale Gas Development
Report: The Economics of Shale Gas DevelopmentReport: The Economics of Shale Gas Development
Report: The Economics of Shale Gas DevelopmentMarcellus Drilling News
 
EY Price Point: global oil and gas market outlook, Q2 | April 2022
EY Price Point: global oil and gas market outlook, Q2 | April 2022EY Price Point: global oil and gas market outlook, Q2 | April 2022
EY Price Point: global oil and gas market outlook, Q2 | April 2022EY
 
EY Price Point: global oil and gas market outlook
EY Price Point: global oil and gas market outlookEY Price Point: global oil and gas market outlook
EY Price Point: global oil and gas market outlookEY
 
Lifting a 40 Year Ban on U.S. Crude Oil Exports
Lifting a 40 Year Ban on U.S. Crude Oil ExportsLifting a 40 Year Ban on U.S. Crude Oil Exports
Lifting a 40 Year Ban on U.S. Crude Oil ExportsBenson_t
 
EY Q1 2020 price point
EY Q1 2020 price pointEY Q1 2020 price point
EY Q1 2020 price pointEY
 
Energy monthly 26th oct'16
Energy monthly   26th oct'16Energy monthly   26th oct'16
Energy monthly 26th oct'16Choice Equity
 
EY Price Point: global oil and gas market outlook
EY Price Point: global oil and gas market outlookEY Price Point: global oil and gas market outlook
EY Price Point: global oil and gas market outlookEY
 
EY Price Point: global oil and gas market outlook, Q2 April 2021
EY Price Point: global oil and gas market outlook, Q2 April 2021EY Price Point: global oil and gas market outlook, Q2 April 2021
EY Price Point: global oil and gas market outlook, Q2 April 2021EY
 
Slides ifri eyl_mazzega_covid19_opec_impacts
Slides ifri eyl_mazzega_covid19_opec_impactsSlides ifri eyl_mazzega_covid19_opec_impacts
Slides ifri eyl_mazzega_covid19_opec_impactsTanja42
 
America-Petrochemical-Outlook-H1-2017
America-Petrochemical-Outlook-H1-2017America-Petrochemical-Outlook-H1-2017
America-Petrochemical-Outlook-H1-2017Justin Schneewind
 
Steel Sector - Canada and USA - August 2020
Steel Sector - Canada and USA - August 2020 Steel Sector - Canada and USA - August 2020
Steel Sector - Canada and USA - August 2020 paul young cpa, cga
 
Steel Sector| Canada| July 2020
Steel Sector| Canada| July 2020 Steel Sector| Canada| July 2020
Steel Sector| Canada| July 2020 paul young cpa, cga
 

La actualidad más candente (20)

VF: Exploration and Production: Q4 2018 | Region Focus: Appalachia
VF: Exploration and Production: Q4 2018 | Region Focus: AppalachiaVF: Exploration and Production: Q4 2018 | Region Focus: Appalachia
VF: Exploration and Production: Q4 2018 | Region Focus: Appalachia
 
CASE Network E-briefs 1.2010 - The global recession and energy markets
CASE Network E-briefs 1.2010 - The global recession and energy marketsCASE Network E-briefs 1.2010 - The global recession and energy markets
CASE Network E-briefs 1.2010 - The global recession and energy markets
 
EY Price Point: global oil and gas market outlook, Q2, April 2020
EY Price Point: global oil and gas market outlook, Q2, April 2020EY Price Point: global oil and gas market outlook, Q2, April 2020
EY Price Point: global oil and gas market outlook, Q2, April 2020
 
Bord Gáis Energy Index August 2015
Bord Gáis Energy Index August 2015Bord Gáis Energy Index August 2015
Bord Gáis Energy Index August 2015
 
What is Carbon Tax or a Price for Carbon
What is Carbon Tax or a Price for CarbonWhat is Carbon Tax or a Price for Carbon
What is Carbon Tax or a Price for Carbon
 
Report: The Economics of Shale Gas Development
Report: The Economics of Shale Gas DevelopmentReport: The Economics of Shale Gas Development
Report: The Economics of Shale Gas Development
 
EY Price Point: global oil and gas market outlook, Q2 | April 2022
EY Price Point: global oil and gas market outlook, Q2 | April 2022EY Price Point: global oil and gas market outlook, Q2 | April 2022
EY Price Point: global oil and gas market outlook, Q2 | April 2022
 
EY Price Point: global oil and gas market outlook
EY Price Point: global oil and gas market outlookEY Price Point: global oil and gas market outlook
EY Price Point: global oil and gas market outlook
 
Lifting a 40 Year Ban on U.S. Crude Oil Exports
Lifting a 40 Year Ban on U.S. Crude Oil ExportsLifting a 40 Year Ban on U.S. Crude Oil Exports
Lifting a 40 Year Ban on U.S. Crude Oil Exports
 
EY Q1 2020 price point
EY Q1 2020 price pointEY Q1 2020 price point
EY Q1 2020 price point
 
Energy monthly 26th oct'16
Energy monthly   26th oct'16Energy monthly   26th oct'16
Energy monthly 26th oct'16
 
EY Price Point: global oil and gas market outlook
EY Price Point: global oil and gas market outlookEY Price Point: global oil and gas market outlook
EY Price Point: global oil and gas market outlook
 
EY Price Point: global oil and gas market outlook, Q2 April 2021
EY Price Point: global oil and gas market outlook, Q2 April 2021EY Price Point: global oil and gas market outlook, Q2 April 2021
EY Price Point: global oil and gas market outlook, Q2 April 2021
 
Slides ifri eyl_mazzega_covid19_opec_impacts
Slides ifri eyl_mazzega_covid19_opec_impactsSlides ifri eyl_mazzega_covid19_opec_impacts
Slides ifri eyl_mazzega_covid19_opec_impacts
 
Oil Primer - Trung
Oil Primer - TrungOil Primer - Trung
Oil Primer - Trung
 
America-Petrochemical-Outlook-H1-2017
America-Petrochemical-Outlook-H1-2017America-Petrochemical-Outlook-H1-2017
America-Petrochemical-Outlook-H1-2017
 
Steel Sector - Canada and USA - August 2020
Steel Sector - Canada and USA - August 2020 Steel Sector - Canada and USA - August 2020
Steel Sector - Canada and USA - August 2020
 
Steel Sector| Canada| July 2020
Steel Sector| Canada| July 2020 Steel Sector| Canada| July 2020
Steel Sector| Canada| July 2020
 
EY Price Point
EY Price PointEY Price Point
EY Price Point
 
PMCWeeklyReview_082115
PMCWeeklyReview_082115PMCWeeklyReview_082115
PMCWeeklyReview_082115
 

Destacado

Rex Energy Corporate Presentation - March 2013
Rex Energy Corporate Presentation - March 2013Rex Energy Corporate Presentation - March 2013
Rex Energy Corporate Presentation - March 2013Marcellus Drilling News
 
Study: Elevated Levels of Arsenic in Water Wells Near Barnett Shale Drilling
Study: Elevated Levels of Arsenic in Water Wells Near Barnett Shale DrillingStudy: Elevated Levels of Arsenic in Water Wells Near Barnett Shale Drilling
Study: Elevated Levels of Arsenic in Water Wells Near Barnett Shale DrillingMarcellus Drilling News
 
EV Energy Partners Investors Talk at IPAA OGIS San Francisco
EV Energy Partners Investors Talk at IPAA OGIS San FranciscoEV Energy Partners Investors Talk at IPAA OGIS San Francisco
EV Energy Partners Investors Talk at IPAA OGIS San FranciscoMarcellus Drilling News
 
PA H.B. 950 - Permanently Ban New Marcellus Shale Drilling on State Forestland
PA H.B. 950 - Permanently Ban New Marcellus Shale Drilling on State ForestlandPA H.B. 950 - Permanently Ban New Marcellus Shale Drilling on State Forestland
PA H.B. 950 - Permanently Ban New Marcellus Shale Drilling on State ForestlandMarcellus Drilling News
 
Energy Vision Report: Tomorrow’s Trucks: Leaving the Era of Oil Behind
Energy Vision Report: Tomorrow’s Trucks: Leaving the Era of Oil BehindEnergy Vision Report: Tomorrow’s Trucks: Leaving the Era of Oil Behind
Energy Vision Report: Tomorrow’s Trucks: Leaving the Era of Oil BehindMarcellus Drilling News
 
Bipartisan Policy Center Study: New Dynamics of the U.S. Natural Gas Market
Bipartisan Policy Center Study: New Dynamics of the U.S. Natural Gas MarketBipartisan Policy Center Study: New Dynamics of the U.S. Natural Gas Market
Bipartisan Policy Center Study: New Dynamics of the U.S. Natural Gas MarketMarcellus Drilling News
 
WVU Study: Air, Noise and Light Monitoring for Marcellus/Utica Wells
WVU Study: Air, Noise and Light Monitoring for Marcellus/Utica WellsWVU Study: Air, Noise and Light Monitoring for Marcellus/Utica Wells
WVU Study: Air, Noise and Light Monitoring for Marcellus/Utica WellsMarcellus Drilling News
 
EV Energy Partners Investor Presentation at the Credit Suisse MLP and Energy ...
EV Energy Partners Investor Presentation at the Credit Suisse MLP and Energy ...EV Energy Partners Investor Presentation at the Credit Suisse MLP and Energy ...
EV Energy Partners Investor Presentation at the Credit Suisse MLP and Energy ...Marcellus Drilling News
 
PA Senate Bill 259 - Division Order for Oil & Gas Royalties
PA Senate Bill 259 - Division Order for Oil & Gas RoyaltiesPA Senate Bill 259 - Division Order for Oil & Gas Royalties
PA Senate Bill 259 - Division Order for Oil & Gas RoyaltiesMarcellus Drilling News
 
Economic Analysis of Costs for Implementing New BLM Fracking Rules for Drilli...
Economic Analysis of Costs for Implementing New BLM Fracking Rules for Drilli...Economic Analysis of Costs for Implementing New BLM Fracking Rules for Drilli...
Economic Analysis of Costs for Implementing New BLM Fracking Rules for Drilli...Marcellus Drilling News
 
Recommended Best Management Practices for Marcellus Shale Gas Development in ...
Recommended Best Management Practices for Marcellus Shale Gas Development in ...Recommended Best Management Practices for Marcellus Shale Gas Development in ...
Recommended Best Management Practices for Marcellus Shale Gas Development in ...Marcellus Drilling News
 
Marcellus and Utica Shale Databook 2013 – Sample Pages for Vol. 1
 Marcellus and Utica Shale Databook 2013 – Sample Pages for Vol. 1 Marcellus and Utica Shale Databook 2013 – Sample Pages for Vol. 1
Marcellus and Utica Shale Databook 2013 – Sample Pages for Vol. 1Marcellus Drilling News
 
CRS: U.S. Crude Oil and Natural Gas Production in Federal and Non-Federal Areas
CRS: U.S. Crude Oil and Natural Gas Production in Federal and Non-Federal AreasCRS: U.S. Crude Oil and Natural Gas Production in Federal and Non-Federal Areas
CRS: U.S. Crude Oil and Natural Gas Production in Federal and Non-Federal AreasMarcellus Drilling News
 
Pro-Drilling Rally to Welcome President Obama to Binghamton
Pro-Drilling Rally to Welcome President Obama to BinghamtonPro-Drilling Rally to Welcome President Obama to Binghamton
Pro-Drilling Rally to Welcome President Obama to BinghamtonMarcellus Drilling News
 
Ohio ODNR Forced Pooling ("Unitization") Guidelines
Ohio ODNR Forced Pooling ("Unitization") GuidelinesOhio ODNR Forced Pooling ("Unitization") Guidelines
Ohio ODNR Forced Pooling ("Unitization") GuidelinesMarcellus Drilling News
 

Destacado (15)

Rex Energy Corporate Presentation - March 2013
Rex Energy Corporate Presentation - March 2013Rex Energy Corporate Presentation - March 2013
Rex Energy Corporate Presentation - March 2013
 
Study: Elevated Levels of Arsenic in Water Wells Near Barnett Shale Drilling
Study: Elevated Levels of Arsenic in Water Wells Near Barnett Shale DrillingStudy: Elevated Levels of Arsenic in Water Wells Near Barnett Shale Drilling
Study: Elevated Levels of Arsenic in Water Wells Near Barnett Shale Drilling
 
EV Energy Partners Investors Talk at IPAA OGIS San Francisco
EV Energy Partners Investors Talk at IPAA OGIS San FranciscoEV Energy Partners Investors Talk at IPAA OGIS San Francisco
EV Energy Partners Investors Talk at IPAA OGIS San Francisco
 
PA H.B. 950 - Permanently Ban New Marcellus Shale Drilling on State Forestland
PA H.B. 950 - Permanently Ban New Marcellus Shale Drilling on State ForestlandPA H.B. 950 - Permanently Ban New Marcellus Shale Drilling on State Forestland
PA H.B. 950 - Permanently Ban New Marcellus Shale Drilling on State Forestland
 
Energy Vision Report: Tomorrow’s Trucks: Leaving the Era of Oil Behind
Energy Vision Report: Tomorrow’s Trucks: Leaving the Era of Oil BehindEnergy Vision Report: Tomorrow’s Trucks: Leaving the Era of Oil Behind
Energy Vision Report: Tomorrow’s Trucks: Leaving the Era of Oil Behind
 
Bipartisan Policy Center Study: New Dynamics of the U.S. Natural Gas Market
Bipartisan Policy Center Study: New Dynamics of the U.S. Natural Gas MarketBipartisan Policy Center Study: New Dynamics of the U.S. Natural Gas Market
Bipartisan Policy Center Study: New Dynamics of the U.S. Natural Gas Market
 
WVU Study: Air, Noise and Light Monitoring for Marcellus/Utica Wells
WVU Study: Air, Noise and Light Monitoring for Marcellus/Utica WellsWVU Study: Air, Noise and Light Monitoring for Marcellus/Utica Wells
WVU Study: Air, Noise and Light Monitoring for Marcellus/Utica Wells
 
EV Energy Partners Investor Presentation at the Credit Suisse MLP and Energy ...
EV Energy Partners Investor Presentation at the Credit Suisse MLP and Energy ...EV Energy Partners Investor Presentation at the Credit Suisse MLP and Energy ...
EV Energy Partners Investor Presentation at the Credit Suisse MLP and Energy ...
 
PA Senate Bill 259 - Division Order for Oil & Gas Royalties
PA Senate Bill 259 - Division Order for Oil & Gas RoyaltiesPA Senate Bill 259 - Division Order for Oil & Gas Royalties
PA Senate Bill 259 - Division Order for Oil & Gas Royalties
 
Economic Analysis of Costs for Implementing New BLM Fracking Rules for Drilli...
Economic Analysis of Costs for Implementing New BLM Fracking Rules for Drilli...Economic Analysis of Costs for Implementing New BLM Fracking Rules for Drilli...
Economic Analysis of Costs for Implementing New BLM Fracking Rules for Drilli...
 
Recommended Best Management Practices for Marcellus Shale Gas Development in ...
Recommended Best Management Practices for Marcellus Shale Gas Development in ...Recommended Best Management Practices for Marcellus Shale Gas Development in ...
Recommended Best Management Practices for Marcellus Shale Gas Development in ...
 
Marcellus and Utica Shale Databook 2013 – Sample Pages for Vol. 1
 Marcellus and Utica Shale Databook 2013 – Sample Pages for Vol. 1 Marcellus and Utica Shale Databook 2013 – Sample Pages for Vol. 1
Marcellus and Utica Shale Databook 2013 – Sample Pages for Vol. 1
 
CRS: U.S. Crude Oil and Natural Gas Production in Federal and Non-Federal Areas
CRS: U.S. Crude Oil and Natural Gas Production in Federal and Non-Federal AreasCRS: U.S. Crude Oil and Natural Gas Production in Federal and Non-Federal Areas
CRS: U.S. Crude Oil and Natural Gas Production in Federal and Non-Federal Areas
 
Pro-Drilling Rally to Welcome President Obama to Binghamton
Pro-Drilling Rally to Welcome President Obama to BinghamtonPro-Drilling Rally to Welcome President Obama to Binghamton
Pro-Drilling Rally to Welcome President Obama to Binghamton
 
Ohio ODNR Forced Pooling ("Unitization") Guidelines
Ohio ODNR Forced Pooling ("Unitization") GuidelinesOhio ODNR Forced Pooling ("Unitization") Guidelines
Ohio ODNR Forced Pooling ("Unitization") Guidelines
 

Similar a Report: Benefits of Natural Gas Production & Exports for US Small Businesses

Fuel Cell Paper 3.18.05DW
Fuel Cell Paper 3.18.05DWFuel Cell Paper 3.18.05DW
Fuel Cell Paper 3.18.05DWDaniel Winton
 
Oil shale history, incentives, and policy
Oil shale  history, incentives, and policyOil shale  history, incentives, and policy
Oil shale history, incentives, and policysugeladi
 
2015 Energy Industry Outlook - The American Petroleum Institute
2015 Energy Industry Outlook - The American Petroleum Institute2015 Energy Industry Outlook - The American Petroleum Institute
2015 Energy Industry Outlook - The American Petroleum InstituteAndrew Gelston
 
API: The State of American Energy Report 2015
API: The State of American Energy Report 2015API: The State of American Energy Report 2015
API: The State of American Energy Report 2015Marcellus Drilling News
 
RL33359 Oil Shale History
RL33359 Oil Shale HistoryRL33359 Oil Shale History
RL33359 Oil Shale HistoryAnthony Andrews
 
Study: A Pipeline for Growth - Regional Energy Hub in Philadelphia
Study: A Pipeline for Growth - Regional Energy Hub in PhiladelphiaStudy: A Pipeline for Growth - Regional Energy Hub in Philadelphia
Study: A Pipeline for Growth - Regional Energy Hub in PhiladelphiaMarcellus Drilling News
 
Petroleum Refining Economic Performance.pdf
Petroleum Refining Economic Performance.pdfPetroleum Refining Economic Performance.pdf
Petroleum Refining Economic Performance.pdfMohamed Elba
 
US Congres Notes on Mexico Energy Reform
US Congres Notes on Mexico Energy ReformUS Congres Notes on Mexico Energy Reform
US Congres Notes on Mexico Energy ReformEnergy for One World
 
DOE Order Granting Elba Island LNG Right to Export to Non-FTA Countries
DOE Order Granting Elba Island LNG Right to Export to Non-FTA CountriesDOE Order Granting Elba Island LNG Right to Export to Non-FTA Countries
DOE Order Granting Elba Island LNG Right to Export to Non-FTA CountriesMarcellus Drilling News
 
ACC Study - Shale Gas, Competitiveness, and New US Chemical Industry Investment
ACC Study - Shale Gas, Competitiveness, and New US Chemical Industry InvestmentACC Study - Shale Gas, Competitiveness, and New US Chemical Industry Investment
ACC Study - Shale Gas, Competitiveness, and New US Chemical Industry InvestmentMarcellus Drilling News
 
Beyond Shale and the Coming Labor Shortage
Beyond Shale and the Coming Labor ShortageBeyond Shale and the Coming Labor Shortage
Beyond Shale and the Coming Labor ShortageSimutech Multimedia Inc.
 
R43682 Smal Refineries and Oilfield Processors
R43682 Smal Refineries and Oilfield ProcessorsR43682 Smal Refineries and Oilfield Processors
R43682 Smal Refineries and Oilfield ProcessorsAnthony Andrews
 
Sham Report on Fracking "Failures" in the Pennsylvania Marcellus Shale
Sham Report on Fracking "Failures" in the Pennsylvania Marcellus ShaleSham Report on Fracking "Failures" in the Pennsylvania Marcellus Shale
Sham Report on Fracking "Failures" in the Pennsylvania Marcellus ShaleMarcellus Drilling News
 
Oil Security 2025: U.S. National Security Policy in an Era of Domestic Oil Ab...
Oil Security 2025: U.S. National Security Policy in an Era of Domestic Oil Ab...Oil Security 2025: U.S. National Security Policy in an Era of Domestic Oil Ab...
Oil Security 2025: U.S. National Security Policy in an Era of Domestic Oil Ab...IR Smartt Inc.
 
Effect of Increased Natural Gas Exports on Domestic Energy Markets
Effect of Increased Natural Gas Exports on Domestic Energy MarketsEffect of Increased Natural Gas Exports on Domestic Energy Markets
Effect of Increased Natural Gas Exports on Domestic Energy MarketsMarcellus Drilling News
 
Study Showing U.S. Shale Drilling will Create 1.6M Jobs & $245B in 10 Years
Study Showing U.S. Shale Drilling will Create 1.6M Jobs & $245B in 10 YearsStudy Showing U.S. Shale Drilling will Create 1.6M Jobs & $245B in 10 Years
Study Showing U.S. Shale Drilling will Create 1.6M Jobs & $245B in 10 YearsMarcellus Drilling News
 
Eagle ford Presentation
Eagle ford PresentationEagle ford Presentation
Eagle ford PresentationRons Dixon
 
Oil & Natural Gas Industry- Emissions challenges from Compressors
Oil & Natural Gas Industry- Emissions challenges from CompressorsOil & Natural Gas Industry- Emissions challenges from Compressors
Oil & Natural Gas Industry- Emissions challenges from CompressorsDr Dev Kambhampati
 

Similar a Report: Benefits of Natural Gas Production & Exports for US Small Businesses (20)

Fuel Cell Paper 3.18.05DW
Fuel Cell Paper 3.18.05DWFuel Cell Paper 3.18.05DW
Fuel Cell Paper 3.18.05DW
 
Senior Honors Thesis (final)
Senior Honors Thesis (final)Senior Honors Thesis (final)
Senior Honors Thesis (final)
 
Oil shale history, incentives, and policy
Oil shale  history, incentives, and policyOil shale  history, incentives, and policy
Oil shale history, incentives, and policy
 
2015 Energy Industry Outlook - The American Petroleum Institute
2015 Energy Industry Outlook - The American Petroleum Institute2015 Energy Industry Outlook - The American Petroleum Institute
2015 Energy Industry Outlook - The American Petroleum Institute
 
API: The State of American Energy Report 2015
API: The State of American Energy Report 2015API: The State of American Energy Report 2015
API: The State of American Energy Report 2015
 
RL33359 Oil Shale History
RL33359 Oil Shale HistoryRL33359 Oil Shale History
RL33359 Oil Shale History
 
Study: A Pipeline for Growth - Regional Energy Hub in Philadelphia
Study: A Pipeline for Growth - Regional Energy Hub in PhiladelphiaStudy: A Pipeline for Growth - Regional Energy Hub in Philadelphia
Study: A Pipeline for Growth - Regional Energy Hub in Philadelphia
 
Petroleum Refining Economic Performance.pdf
Petroleum Refining Economic Performance.pdfPetroleum Refining Economic Performance.pdf
Petroleum Refining Economic Performance.pdf
 
US Congres Notes on Mexico Energy Reform
US Congres Notes on Mexico Energy ReformUS Congres Notes on Mexico Energy Reform
US Congres Notes on Mexico Energy Reform
 
DOE Order Granting Elba Island LNG Right to Export to Non-FTA Countries
DOE Order Granting Elba Island LNG Right to Export to Non-FTA CountriesDOE Order Granting Elba Island LNG Right to Export to Non-FTA Countries
DOE Order Granting Elba Island LNG Right to Export to Non-FTA Countries
 
ACC Study - Shale Gas, Competitiveness, and New US Chemical Industry Investment
ACC Study - Shale Gas, Competitiveness, and New US Chemical Industry InvestmentACC Study - Shale Gas, Competitiveness, and New US Chemical Industry Investment
ACC Study - Shale Gas, Competitiveness, and New US Chemical Industry Investment
 
Oilsand
OilsandOilsand
Oilsand
 
Beyond Shale and the Coming Labor Shortage
Beyond Shale and the Coming Labor ShortageBeyond Shale and the Coming Labor Shortage
Beyond Shale and the Coming Labor Shortage
 
R43682 Smal Refineries and Oilfield Processors
R43682 Smal Refineries and Oilfield ProcessorsR43682 Smal Refineries and Oilfield Processors
R43682 Smal Refineries and Oilfield Processors
 
Sham Report on Fracking "Failures" in the Pennsylvania Marcellus Shale
Sham Report on Fracking "Failures" in the Pennsylvania Marcellus ShaleSham Report on Fracking "Failures" in the Pennsylvania Marcellus Shale
Sham Report on Fracking "Failures" in the Pennsylvania Marcellus Shale
 
Oil Security 2025: U.S. National Security Policy in an Era of Domestic Oil Ab...
Oil Security 2025: U.S. National Security Policy in an Era of Domestic Oil Ab...Oil Security 2025: U.S. National Security Policy in an Era of Domestic Oil Ab...
Oil Security 2025: U.S. National Security Policy in an Era of Domestic Oil Ab...
 
Effect of Increased Natural Gas Exports on Domestic Energy Markets
Effect of Increased Natural Gas Exports on Domestic Energy MarketsEffect of Increased Natural Gas Exports on Domestic Energy Markets
Effect of Increased Natural Gas Exports on Domestic Energy Markets
 
Study Showing U.S. Shale Drilling will Create 1.6M Jobs & $245B in 10 Years
Study Showing U.S. Shale Drilling will Create 1.6M Jobs & $245B in 10 YearsStudy Showing U.S. Shale Drilling will Create 1.6M Jobs & $245B in 10 Years
Study Showing U.S. Shale Drilling will Create 1.6M Jobs & $245B in 10 Years
 
Eagle ford Presentation
Eagle ford PresentationEagle ford Presentation
Eagle ford Presentation
 
Oil & Natural Gas Industry- Emissions challenges from Compressors
Oil & Natural Gas Industry- Emissions challenges from CompressorsOil & Natural Gas Industry- Emissions challenges from Compressors
Oil & Natural Gas Industry- Emissions challenges from Compressors
 

Más de Marcellus Drilling News

Five facts about shale: it’s coming back, and coming back strong
Five facts about shale: it’s coming back, and coming back strongFive facts about shale: it’s coming back, and coming back strong
Five facts about shale: it’s coming back, and coming back strongMarcellus Drilling News
 
Quarterly legislative action update: Marcellus and Utica shale region (4Q16)
Quarterly legislative action update: Marcellus and Utica shale region (4Q16)Quarterly legislative action update: Marcellus and Utica shale region (4Q16)
Quarterly legislative action update: Marcellus and Utica shale region (4Q16)Marcellus Drilling News
 
Access Northeast Pipeline Project - Dec 2016 Update
Access Northeast Pipeline Project - Dec 2016 UpdateAccess Northeast Pipeline Project - Dec 2016 Update
Access Northeast Pipeline Project - Dec 2016 UpdateMarcellus Drilling News
 
Rover Pipeline Letter to FERC Requesting Final Certificate
Rover Pipeline Letter to FERC Requesting Final CertificateRover Pipeline Letter to FERC Requesting Final Certificate
Rover Pipeline Letter to FERC Requesting Final CertificateMarcellus Drilling News
 
LSE Study: Fracking is Revitalizing U.S. Manufacturing
LSE Study: Fracking is Revitalizing U.S. ManufacturingLSE Study: Fracking is Revitalizing U.S. Manufacturing
LSE Study: Fracking is Revitalizing U.S. ManufacturingMarcellus Drilling News
 
Letter From 24 States Asking Trump & Congress to Withdraw the Unlawful Clean ...
Letter From 24 States Asking Trump & Congress to Withdraw the Unlawful Clean ...Letter From 24 States Asking Trump & Congress to Withdraw the Unlawful Clean ...
Letter From 24 States Asking Trump & Congress to Withdraw the Unlawful Clean ...Marcellus Drilling News
 
Report: New U.S. Power Costs: by County, with Environmental Externalities
Report: New U.S. Power Costs: by County, with Environmental ExternalitiesReport: New U.S. Power Costs: by County, with Environmental Externalities
Report: New U.S. Power Costs: by County, with Environmental ExternalitiesMarcellus Drilling News
 
U.S. Crude Oil and Natural Gas Proved Reserves, Year-end 2015
U.S. Crude Oil and Natural Gas Proved Reserves, Year-end 2015U.S. Crude Oil and Natural Gas Proved Reserves, Year-end 2015
U.S. Crude Oil and Natural Gas Proved Reserves, Year-end 2015Marcellus Drilling News
 
U.S. EIA's Drilling Productivity Report - December 2015
U.S. EIA's Drilling Productivity Report - December 2015U.S. EIA's Drilling Productivity Report - December 2015
U.S. EIA's Drilling Productivity Report - December 2015Marcellus Drilling News
 
Velocys Plan to "Build the Business" - Gas-to-Liquids Plants
Velocys Plan to "Build the Business" - Gas-to-Liquids PlantsVelocys Plan to "Build the Business" - Gas-to-Liquids Plants
Velocys Plan to "Build the Business" - Gas-to-Liquids PlantsMarcellus Drilling News
 
PA DEP Revised Permit for Natural Gas Compression Stations, Processing Plants...
PA DEP Revised Permit for Natural Gas Compression Stations, Processing Plants...PA DEP Revised Permit for Natural Gas Compression Stations, Processing Plants...
PA DEP Revised Permit for Natural Gas Compression Stations, Processing Plants...Marcellus Drilling News
 
PA DEP Permit for Unconventional NatGas Well Site Operations and Remote Piggi...
PA DEP Permit for Unconventional NatGas Well Site Operations and Remote Piggi...PA DEP Permit for Unconventional NatGas Well Site Operations and Remote Piggi...
PA DEP Permit for Unconventional NatGas Well Site Operations and Remote Piggi...Marcellus Drilling News
 
PA DEP: Methane Reduction Strategies for Natural Gas Operations
PA DEP: Methane Reduction Strategies for Natural Gas OperationsPA DEP: Methane Reduction Strategies for Natural Gas Operations
PA DEP: Methane Reduction Strategies for Natural Gas OperationsMarcellus Drilling News
 
US EIA's December 2016 Short-Term Energy Outlook
US EIA's December 2016 Short-Term Energy OutlookUS EIA's December 2016 Short-Term Energy Outlook
US EIA's December 2016 Short-Term Energy OutlookMarcellus Drilling News
 
Northeast Gas Association's 2016 Statistical Guide
Northeast Gas Association's 2016 Statistical GuideNortheast Gas Association's 2016 Statistical Guide
Northeast Gas Association's 2016 Statistical GuideMarcellus Drilling News
 
PA PUC Responses to Auditor General's Act 13 Impact Fee Audit
PA PUC Responses to Auditor General's Act 13 Impact Fee AuditPA PUC Responses to Auditor General's Act 13 Impact Fee Audit
PA PUC Responses to Auditor General's Act 13 Impact Fee AuditMarcellus Drilling News
 
Pennsylvania Public Utility Commission Act 13/Impact Fees Audit by PA Auditor...
Pennsylvania Public Utility Commission Act 13/Impact Fees Audit by PA Auditor...Pennsylvania Public Utility Commission Act 13/Impact Fees Audit by PA Auditor...
Pennsylvania Public Utility Commission Act 13/Impact Fees Audit by PA Auditor...Marcellus Drilling News
 
Clyde Mine Discharge/Tenmile Creek Water Quality Final Report
Clyde Mine Discharge/Tenmile Creek Water Quality Final ReportClyde Mine Discharge/Tenmile Creek Water Quality Final Report
Clyde Mine Discharge/Tenmile Creek Water Quality Final ReportMarcellus Drilling News
 
FERC Order Denying Stay of Kinder Morgan's Broad Run Expansion Project
FERC Order Denying Stay of Kinder Morgan's Broad Run Expansion ProjectFERC Order Denying Stay of Kinder Morgan's Broad Run Expansion Project
FERC Order Denying Stay of Kinder Morgan's Broad Run Expansion ProjectMarcellus Drilling News
 
Sixth Circuit Court of Appeals Decision in Harper v Muskingum Watershed Conse...
Sixth Circuit Court of Appeals Decision in Harper v Muskingum Watershed Conse...Sixth Circuit Court of Appeals Decision in Harper v Muskingum Watershed Conse...
Sixth Circuit Court of Appeals Decision in Harper v Muskingum Watershed Conse...Marcellus Drilling News
 

Más de Marcellus Drilling News (20)

Five facts about shale: it’s coming back, and coming back strong
Five facts about shale: it’s coming back, and coming back strongFive facts about shale: it’s coming back, and coming back strong
Five facts about shale: it’s coming back, and coming back strong
 
Quarterly legislative action update: Marcellus and Utica shale region (4Q16)
Quarterly legislative action update: Marcellus and Utica shale region (4Q16)Quarterly legislative action update: Marcellus and Utica shale region (4Q16)
Quarterly legislative action update: Marcellus and Utica shale region (4Q16)
 
Access Northeast Pipeline Project - Dec 2016 Update
Access Northeast Pipeline Project - Dec 2016 UpdateAccess Northeast Pipeline Project - Dec 2016 Update
Access Northeast Pipeline Project - Dec 2016 Update
 
Rover Pipeline Letter to FERC Requesting Final Certificate
Rover Pipeline Letter to FERC Requesting Final CertificateRover Pipeline Letter to FERC Requesting Final Certificate
Rover Pipeline Letter to FERC Requesting Final Certificate
 
LSE Study: Fracking is Revitalizing U.S. Manufacturing
LSE Study: Fracking is Revitalizing U.S. ManufacturingLSE Study: Fracking is Revitalizing U.S. Manufacturing
LSE Study: Fracking is Revitalizing U.S. Manufacturing
 
Letter From 24 States Asking Trump & Congress to Withdraw the Unlawful Clean ...
Letter From 24 States Asking Trump & Congress to Withdraw the Unlawful Clean ...Letter From 24 States Asking Trump & Congress to Withdraw the Unlawful Clean ...
Letter From 24 States Asking Trump & Congress to Withdraw the Unlawful Clean ...
 
Report: New U.S. Power Costs: by County, with Environmental Externalities
Report: New U.S. Power Costs: by County, with Environmental ExternalitiesReport: New U.S. Power Costs: by County, with Environmental Externalities
Report: New U.S. Power Costs: by County, with Environmental Externalities
 
U.S. Crude Oil and Natural Gas Proved Reserves, Year-end 2015
U.S. Crude Oil and Natural Gas Proved Reserves, Year-end 2015U.S. Crude Oil and Natural Gas Proved Reserves, Year-end 2015
U.S. Crude Oil and Natural Gas Proved Reserves, Year-end 2015
 
U.S. EIA's Drilling Productivity Report - December 2015
U.S. EIA's Drilling Productivity Report - December 2015U.S. EIA's Drilling Productivity Report - December 2015
U.S. EIA's Drilling Productivity Report - December 2015
 
Velocys Plan to "Build the Business" - Gas-to-Liquids Plants
Velocys Plan to "Build the Business" - Gas-to-Liquids PlantsVelocys Plan to "Build the Business" - Gas-to-Liquids Plants
Velocys Plan to "Build the Business" - Gas-to-Liquids Plants
 
PA DEP Revised Permit for Natural Gas Compression Stations, Processing Plants...
PA DEP Revised Permit for Natural Gas Compression Stations, Processing Plants...PA DEP Revised Permit for Natural Gas Compression Stations, Processing Plants...
PA DEP Revised Permit for Natural Gas Compression Stations, Processing Plants...
 
PA DEP Permit for Unconventional NatGas Well Site Operations and Remote Piggi...
PA DEP Permit for Unconventional NatGas Well Site Operations and Remote Piggi...PA DEP Permit for Unconventional NatGas Well Site Operations and Remote Piggi...
PA DEP Permit for Unconventional NatGas Well Site Operations and Remote Piggi...
 
PA DEP: Methane Reduction Strategies for Natural Gas Operations
PA DEP: Methane Reduction Strategies for Natural Gas OperationsPA DEP: Methane Reduction Strategies for Natural Gas Operations
PA DEP: Methane Reduction Strategies for Natural Gas Operations
 
US EIA's December 2016 Short-Term Energy Outlook
US EIA's December 2016 Short-Term Energy OutlookUS EIA's December 2016 Short-Term Energy Outlook
US EIA's December 2016 Short-Term Energy Outlook
 
Northeast Gas Association's 2016 Statistical Guide
Northeast Gas Association's 2016 Statistical GuideNortheast Gas Association's 2016 Statistical Guide
Northeast Gas Association's 2016 Statistical Guide
 
PA PUC Responses to Auditor General's Act 13 Impact Fee Audit
PA PUC Responses to Auditor General's Act 13 Impact Fee AuditPA PUC Responses to Auditor General's Act 13 Impact Fee Audit
PA PUC Responses to Auditor General's Act 13 Impact Fee Audit
 
Pennsylvania Public Utility Commission Act 13/Impact Fees Audit by PA Auditor...
Pennsylvania Public Utility Commission Act 13/Impact Fees Audit by PA Auditor...Pennsylvania Public Utility Commission Act 13/Impact Fees Audit by PA Auditor...
Pennsylvania Public Utility Commission Act 13/Impact Fees Audit by PA Auditor...
 
Clyde Mine Discharge/Tenmile Creek Water Quality Final Report
Clyde Mine Discharge/Tenmile Creek Water Quality Final ReportClyde Mine Discharge/Tenmile Creek Water Quality Final Report
Clyde Mine Discharge/Tenmile Creek Water Quality Final Report
 
FERC Order Denying Stay of Kinder Morgan's Broad Run Expansion Project
FERC Order Denying Stay of Kinder Morgan's Broad Run Expansion ProjectFERC Order Denying Stay of Kinder Morgan's Broad Run Expansion Project
FERC Order Denying Stay of Kinder Morgan's Broad Run Expansion Project
 
Sixth Circuit Court of Appeals Decision in Harper v Muskingum Watershed Conse...
Sixth Circuit Court of Appeals Decision in Harper v Muskingum Watershed Conse...Sixth Circuit Court of Appeals Decision in Harper v Muskingum Watershed Conse...
Sixth Circuit Court of Appeals Decision in Harper v Muskingum Watershed Conse...
 

Último

The political system of the united kingdom
The political system of the united kingdomThe political system of the united kingdom
The political system of the united kingdomlunadelior
 
declarationleaders_sd_re_greens_theleft_5.pdf
declarationleaders_sd_re_greens_theleft_5.pdfdeclarationleaders_sd_re_greens_theleft_5.pdf
declarationleaders_sd_re_greens_theleft_5.pdfssuser5750e1
 
THE OBSTACLES THAT IMPEDE THE DEVELOPMENT OF BRAZIL IN THE CONTEMPORARY ERA A...
THE OBSTACLES THAT IMPEDE THE DEVELOPMENT OF BRAZIL IN THE CONTEMPORARY ERA A...THE OBSTACLES THAT IMPEDE THE DEVELOPMENT OF BRAZIL IN THE CONTEMPORARY ERA A...
THE OBSTACLES THAT IMPEDE THE DEVELOPMENT OF BRAZIL IN THE CONTEMPORARY ERA A...Faga1939
 
04052024_First India Newspaper Jaipur.pdf
04052024_First India Newspaper Jaipur.pdf04052024_First India Newspaper Jaipur.pdf
04052024_First India Newspaper Jaipur.pdfFIRST INDIA
 
Embed-2 (1).pdfb[k[k[[k[kkkpkdpokkdpkopko
Embed-2 (1).pdfb[k[k[[k[kkkpkdpokkdpkopkoEmbed-2 (1).pdfb[k[k[[k[kkkpkdpokkdpkopko
Embed-2 (1).pdfb[k[k[[k[kkkpkdpokkdpkopkobhavenpr
 
*Navigating Electoral Terrain: TDP's Performance under N Chandrababu Naidu's ...
*Navigating Electoral Terrain: TDP's Performance under N Chandrababu Naidu's ...*Navigating Electoral Terrain: TDP's Performance under N Chandrababu Naidu's ...
*Navigating Electoral Terrain: TDP's Performance under N Chandrababu Naidu's ...anjanibaddipudi1
 
Embed-4.pdf lkdiinlajeklhndklheduhuekjdh
Embed-4.pdf lkdiinlajeklhndklheduhuekjdhEmbed-4.pdf lkdiinlajeklhndklheduhuekjdh
Embed-4.pdf lkdiinlajeklhndklheduhuekjdhbhavenpr
 
KING VISHNU BHAGWANON KA BHAGWAN PARAMATMONKA PARATOMIC PARAMANU KASARVAMANVA...
KING VISHNU BHAGWANON KA BHAGWAN PARAMATMONKA PARATOMIC PARAMANU KASARVAMANVA...KING VISHNU BHAGWANON KA BHAGWAN PARAMATMONKA PARATOMIC PARAMANU KASARVAMANVA...
KING VISHNU BHAGWANON KA BHAGWAN PARAMATMONKA PARATOMIC PARAMANU KASARVAMANVA...IT Industry
 
422524114-Patriarchy-Kamla-Bhasin gg.pdf
422524114-Patriarchy-Kamla-Bhasin gg.pdf422524114-Patriarchy-Kamla-Bhasin gg.pdf
422524114-Patriarchy-Kamla-Bhasin gg.pdflambardar420420
 
China's soft power in 21st century .pptx
China's soft power in 21st century   .pptxChina's soft power in 21st century   .pptx
China's soft power in 21st century .pptxYasinAhmad20
 
Politician uddhav thackeray biography- Full Details
Politician uddhav thackeray biography- Full DetailsPolitician uddhav thackeray biography- Full Details
Politician uddhav thackeray biography- Full DetailsVoterMood
 
Group_5_US-China Trade War to understand the trade
Group_5_US-China Trade War to understand the tradeGroup_5_US-China Trade War to understand the trade
Group_5_US-China Trade War to understand the tradeRahatulAshafeen
 
Job-Oriеntеd Courses That Will Boost Your Career in 2024
Job-Oriеntеd Courses That Will Boost Your Career in 2024Job-Oriеntеd Courses That Will Boost Your Career in 2024
Job-Oriеntеd Courses That Will Boost Your Career in 2024Insiger
 
06052024_First India Newspaper Jaipur.pdf
06052024_First India Newspaper Jaipur.pdf06052024_First India Newspaper Jaipur.pdf
06052024_First India Newspaper Jaipur.pdfFIRST INDIA
 
Transformative Leadership: N Chandrababu Naidu and TDP's Vision for Innovatio...
Transformative Leadership: N Chandrababu Naidu and TDP's Vision for Innovatio...Transformative Leadership: N Chandrababu Naidu and TDP's Vision for Innovatio...
Transformative Leadership: N Chandrababu Naidu and TDP's Vision for Innovatio...srinuseo15
 
Gujarat-SEBCs.pdf pfpkoopapriorjfperjreie
Gujarat-SEBCs.pdf pfpkoopapriorjfperjreieGujarat-SEBCs.pdf pfpkoopapriorjfperjreie
Gujarat-SEBCs.pdf pfpkoopapriorjfperjreiebhavenpr
 
America Is the Target; Israel Is the Front Line _ Andy Blumenthal _ The Blogs...
America Is the Target; Israel Is the Front Line _ Andy Blumenthal _ The Blogs...America Is the Target; Israel Is the Front Line _ Andy Blumenthal _ The Blogs...
America Is the Target; Israel Is the Front Line _ Andy Blumenthal _ The Blogs...Andy (Avraham) Blumenthal
 
05052024_First India Newspaper Jaipur.pdf
05052024_First India Newspaper Jaipur.pdf05052024_First India Newspaper Jaipur.pdf
05052024_First India Newspaper Jaipur.pdfFIRST INDIA
 
{Qatar{^🚀^(+971558539980**}})Abortion Pills for Sale in Dubai. .abu dhabi, sh...
{Qatar{^🚀^(+971558539980**}})Abortion Pills for Sale in Dubai. .abu dhabi, sh...{Qatar{^🚀^(+971558539980**}})Abortion Pills for Sale in Dubai. .abu dhabi, sh...
{Qatar{^🚀^(+971558539980**}})Abortion Pills for Sale in Dubai. .abu dhabi, sh...hyt3577
 

Último (20)

The political system of the united kingdom
The political system of the united kingdomThe political system of the united kingdom
The political system of the united kingdom
 
declarationleaders_sd_re_greens_theleft_5.pdf
declarationleaders_sd_re_greens_theleft_5.pdfdeclarationleaders_sd_re_greens_theleft_5.pdf
declarationleaders_sd_re_greens_theleft_5.pdf
 
THE OBSTACLES THAT IMPEDE THE DEVELOPMENT OF BRAZIL IN THE CONTEMPORARY ERA A...
THE OBSTACLES THAT IMPEDE THE DEVELOPMENT OF BRAZIL IN THE CONTEMPORARY ERA A...THE OBSTACLES THAT IMPEDE THE DEVELOPMENT OF BRAZIL IN THE CONTEMPORARY ERA A...
THE OBSTACLES THAT IMPEDE THE DEVELOPMENT OF BRAZIL IN THE CONTEMPORARY ERA A...
 
9953056974 Call Girls In Pratap Nagar, Escorts (Delhi) NCR
9953056974 Call Girls In Pratap Nagar, Escorts (Delhi) NCR9953056974 Call Girls In Pratap Nagar, Escorts (Delhi) NCR
9953056974 Call Girls In Pratap Nagar, Escorts (Delhi) NCR
 
04052024_First India Newspaper Jaipur.pdf
04052024_First India Newspaper Jaipur.pdf04052024_First India Newspaper Jaipur.pdf
04052024_First India Newspaper Jaipur.pdf
 
Embed-2 (1).pdfb[k[k[[k[kkkpkdpokkdpkopko
Embed-2 (1).pdfb[k[k[[k[kkkpkdpokkdpkopkoEmbed-2 (1).pdfb[k[k[[k[kkkpkdpokkdpkopko
Embed-2 (1).pdfb[k[k[[k[kkkpkdpokkdpkopko
 
*Navigating Electoral Terrain: TDP's Performance under N Chandrababu Naidu's ...
*Navigating Electoral Terrain: TDP's Performance under N Chandrababu Naidu's ...*Navigating Electoral Terrain: TDP's Performance under N Chandrababu Naidu's ...
*Navigating Electoral Terrain: TDP's Performance under N Chandrababu Naidu's ...
 
Embed-4.pdf lkdiinlajeklhndklheduhuekjdh
Embed-4.pdf lkdiinlajeklhndklheduhuekjdhEmbed-4.pdf lkdiinlajeklhndklheduhuekjdh
Embed-4.pdf lkdiinlajeklhndklheduhuekjdh
 
KING VISHNU BHAGWANON KA BHAGWAN PARAMATMONKA PARATOMIC PARAMANU KASARVAMANVA...
KING VISHNU BHAGWANON KA BHAGWAN PARAMATMONKA PARATOMIC PARAMANU KASARVAMANVA...KING VISHNU BHAGWANON KA BHAGWAN PARAMATMONKA PARATOMIC PARAMANU KASARVAMANVA...
KING VISHNU BHAGWANON KA BHAGWAN PARAMATMONKA PARATOMIC PARAMANU KASARVAMANVA...
 
422524114-Patriarchy-Kamla-Bhasin gg.pdf
422524114-Patriarchy-Kamla-Bhasin gg.pdf422524114-Patriarchy-Kamla-Bhasin gg.pdf
422524114-Patriarchy-Kamla-Bhasin gg.pdf
 
China's soft power in 21st century .pptx
China's soft power in 21st century   .pptxChina's soft power in 21st century   .pptx
China's soft power in 21st century .pptx
 
Politician uddhav thackeray biography- Full Details
Politician uddhav thackeray biography- Full DetailsPolitician uddhav thackeray biography- Full Details
Politician uddhav thackeray biography- Full Details
 
Group_5_US-China Trade War to understand the trade
Group_5_US-China Trade War to understand the tradeGroup_5_US-China Trade War to understand the trade
Group_5_US-China Trade War to understand the trade
 
Job-Oriеntеd Courses That Will Boost Your Career in 2024
Job-Oriеntеd Courses That Will Boost Your Career in 2024Job-Oriеntеd Courses That Will Boost Your Career in 2024
Job-Oriеntеd Courses That Will Boost Your Career in 2024
 
06052024_First India Newspaper Jaipur.pdf
06052024_First India Newspaper Jaipur.pdf06052024_First India Newspaper Jaipur.pdf
06052024_First India Newspaper Jaipur.pdf
 
Transformative Leadership: N Chandrababu Naidu and TDP's Vision for Innovatio...
Transformative Leadership: N Chandrababu Naidu and TDP's Vision for Innovatio...Transformative Leadership: N Chandrababu Naidu and TDP's Vision for Innovatio...
Transformative Leadership: N Chandrababu Naidu and TDP's Vision for Innovatio...
 
Gujarat-SEBCs.pdf pfpkoopapriorjfperjreie
Gujarat-SEBCs.pdf pfpkoopapriorjfperjreieGujarat-SEBCs.pdf pfpkoopapriorjfperjreie
Gujarat-SEBCs.pdf pfpkoopapriorjfperjreie
 
America Is the Target; Israel Is the Front Line _ Andy Blumenthal _ The Blogs...
America Is the Target; Israel Is the Front Line _ Andy Blumenthal _ The Blogs...America Is the Target; Israel Is the Front Line _ Andy Blumenthal _ The Blogs...
America Is the Target; Israel Is the Front Line _ Andy Blumenthal _ The Blogs...
 
05052024_First India Newspaper Jaipur.pdf
05052024_First India Newspaper Jaipur.pdf05052024_First India Newspaper Jaipur.pdf
05052024_First India Newspaper Jaipur.pdf
 
{Qatar{^🚀^(+971558539980**}})Abortion Pills for Sale in Dubai. .abu dhabi, sh...
{Qatar{^🚀^(+971558539980**}})Abortion Pills for Sale in Dubai. .abu dhabi, sh...{Qatar{^🚀^(+971558539980**}})Abortion Pills for Sale in Dubai. .abu dhabi, sh...
{Qatar{^🚀^(+971558539980**}})Abortion Pills for Sale in Dubai. .abu dhabi, sh...
 

Report: Benefits of Natural Gas Production & Exports for US Small Businesses

  • 1. The Benefits of Natural Gas Production and Exports for U.S. Small Businesses Raymond J. Keating Chief Economist Small Business & Entrepreneurship Council May 2013 www.sbecouncil.org
  • 2. Contents Executive Summary . . . . . . . . . . . . . . . . . . . . . . . . . . . . . . . . . . . . . . . . . . . 3 Introduction . . . . . . . . . . . . . . . . . . . . . . . . . . . . . . . . . . . . . . . . . . . . . . . . . 5 I. United States . . . . . . . . . . . . . . . . . . . . . . . . . . . . . . . . . . . . . . . . . . . . . . . . 6 II. Arkansas . . . . . . . . . . . . . . . . . . . . . . . . . . . . . . . . . . . . . . . . . . . . . . . . . . . 11 III. Colorado . . . . . . . . . . . . . . . . . . . . . . . . . . . . . . . . . . . . . . . . . . . . . . . . . . 14 IV. Louisiana . . . . . . . . . . . . . . . . . . . . . . . . . . . . . . . . . . . . . . . . . . . . . . . . . . 17 V. North Dakota . . . . . . . . . . . . . . . . . . . . . . . . . . . . . . . . . . . . . . . . . . . . . . . 20 VI. Ohio . . . . . . . . . . . . . . . . . . . . . . . . . . . . . . . . . . . . . . . . . . . . . . . . . . . . . . 23 VII. Oklahoma . . . . . . . . . . . . . . . . . . . . . . . . . . . . . . . . . . . . . . . . . . . . . . . . . 26 VIII. Pennsylvania . . . . . . . . . . . . . . . . . . . . . . . . . . . . . . . . . . . . . . . . . . . . . . . 29 IX. Texas . . . . . . . . . . . . . . . . . . . . . . . . . . . . . . . . . . . . . . . . . . . . . . . . . . . . . 32 X. Utah . . . . . . . . . . . . . . . . . . . . . . . . . . . . . . . . . . . . . . . . . . . . . . . . . . . . . . 35 XI. West Virginia . . . . . . . . . . . . . . . . . . . . . . . . . . . . . . . . . . . . . . . . . . . . . . . 38 XII. Wyoming . . . . . . . . . . . . . . . . . . . . . . . . . . . . . . . . . . . . . . . . . . . . . . . . . . 41 XIII. LNG Exports: Expand or Limit Opportunities? . . . . . . . . . . . . . . . . . . . . . 44 About the Author . . . . . . . . . . . . . . . . . . . . . . . . . . . . . . . . . . . . . . . . . . . 47 Endnotes . . . . . . . . . . . . . . . . . . . . . . . . . . . . . . . . . . . . . . . . . . . . . . . . . . 48 www.sbecouncil.org
  • 3. The Benefits of Natural Gas Production and Exports for U.S. Small Businesses | 3 Executive Summary The U.S. natural gas market has changed dramatically in recent years, as evidenced by a 55 percent decline in the annual average price of natural gas occurring between 2005 and 2011. While assorted market factors come into play, this reduction in natural gas prices has been a direct result of expanded natural gas pro- duction in the U.S. Increased production has been a boon for the energy sector, including for employment and business growth, especially in those states where natural gas production has expanded, with indirect benefits across the nation. increased by 947 percent, due to a combination of hori- zontal drilling and hydraulic fracturing. Jobs Growth. For the U.S. overall, while total employment declined by 3.7 percent from 2005 to 2010, jobs grew by 27.6 percent in the oil and gas extraction sector; by 15.1 percent in the drilling oil and gas wells sector; by 38.5 per- cent in the support sector for oil and gas operations; by 47 percent in the oil and gas pipeline and related structures construction sector; and by 62 percent in the oil and gas field machinery and equipment manufacturing sector. Small Business Growth. Meanwhile, the same contrast held in terms of changes in the number of businesses, including small business. For all of the U.S., total employer firms declined by 4.2 percent from 2005 to 2010, including a 3.7 percent decline in firms with less than 20 workers, and a 4.2 percent fall in firms with less than 500 workers. But within the energy sector, business growth in key industries has been striking: • The number of oil and gas extraction employer firms grew by 3.1 percent, including growth of 2.5 percent among firms with less than 20 workers and 3 percent among firms with less than 500 workers. Export Opportunities. Looking ahead, the opportunity exists for exporting liquefied natural gas (LNG), given the large differential in natural gas prices in the U.S. versus else- where in the world, and rising global demand. Unfortu- nately, though, there is a movement afoot to have government limit LNG exports, based on the unfounded fear that LNG exports will dramatically drive up domestic natural gas prices. But the economy is not a zero-sum game. Expanded demand for U.S. natural gas internation- ally will be a net positive, resulting in greater U.S. natural gas production, increased investment, enhanced GDP growth, rising incomes, and more jobs. Several studies have validated the abundance of domestic natural gas for international export. The International Energy Administration recently projected that “the United States becomes a net exporter of natural gas by 2020 and is almost self-sufficient in energy, in net terms, by 2035.” In addition, a recent study for the Brookings Institution noted, “In their analyses, both Deloitte and EIA found that the majority – 63 percent, according to both studies – of the exported natural gas will come from new production as opposed to displaced consumption from other sectors.” This report looks at some of the tremendous benefits that have emerged for the U.S. economy due to a vast expan- sion in natural gas production in less than a decade. In par- ticular, this report focuses on the growth in jobs and the number of small and midsize businesses in key energy sec- tors, including in states where natural gas production has increased and where such production is expected to expand. It follows that the U.S. becoming a leader in meet- ing global natural gas demand would be a clear benefit to the overall U.S. economy, and again, particularly in those states leading the way in natural gas production. Rising Production. Natural gas production increased by 27 percent from 2005 to 2011. This increase in natural gas has come from high production levels from shale gas, which Expanded demand for U.S. natural gas internationally will be a net positive, resulting in greater U.S. natural gas production, increased investment, enhanced GDP growth, rising incomes, and more jobs.
  • 4. 4 | The Benefits of Natural Gas Production and Exports for U.S. Small Businesses • The number of drilling oil and gas wells employer firms grew by 7.2 percent, including 4.7 percent among firms with less than 20 workers and 7.3 percent among firms with less than 500. • The number of oil and gas operations employer firms grew by 24.5 percent, including 24.5 percent among firms with less than 20 workers and 24.6 percent among firms with less than 500. • The number of oil and gas pipeline and related structures construction employer firms grew by 5.1 percent, includ- ing growth of 3.5 percent among firms with less than 500 workers. • The number of oil and gas field machinery and equip- ment manufacturing employer firms grew by 61.0 per- cent, including growth of 59.0 percent among firms with less than 20 workers and 62.7 percent among firms with less than 500 workers. Small Business Population. At the same time, small and midsize firms overwhelmingly populate each of the energy sectors considered. Businesses with less than 20 workers came in at • 91.3 percent of oil and gas extraction employer firms; • 80.4 percent of drilling oil and gas wells employer firms; • 84.7 percent of oil and gas operations employer firms; • 63 percent of oil and gas pipeline and related structures construction employer firms; and • 60.3 percent of oil and gas field machinery and equip- ment manufacturing employer firms. It follows that the U.S. becoming a leader in meeting global natural gas demand would be a clear benefit to the overall U.S. economy, and again, particularly in those states leading the way in natural gas production. In the 11 states examined in this report, the dominance of small and midsize firms populating energy industries held as well. Interestingly, the contrast between a national decline in overall jobs and businesses, and growth in key energy sectors often was even far more striking than the national differences. The general case of energy industries adding jobs and small businesses, as opposed to national declines, held in the 10 states – that is, in Arkansas, Col- orado, Louisiana, North Dakota, Oklahoma, Pennsylvania, Texas, Utah, West Virginia, and Wyoming – where natural gas production was up markedly. (A Summary Sheet for each state is available.) Opportunities Ahead. The expectation that nearly two- thirds of LNG exports would be met via new production speaks to further strong growth for small and midsize busi- nesses, and for employment. At the same time, the minimal price impact that expanded exports might have on domes- tic prices would have small effects on domestic consumers of natural gas, especially given the enormous declines we’ve already experienced in natural gas prices. And even those small, potential price increases must be further offset against the effect of the overall positive for economic growth coming via expanded natural gas production. Clearly, LNG exports guided by market forces mean further expanding opportunity for small and midsize businesses to be created, to grow, and to create jobs.
  • 5. The Benefits of Natural Gas Production and Exports for U.S. Small Businesses | 5 While assorted market factors come into play, lower natu- ral gas prices have resulted directly from expanded U.S. natural gas production. That increased production has been good news for the energy sector, including for employment and business growth, especially in those states where nat- ural gas production has expanded, with indirect benefits spreading across the nation. Looking ahead, the opportunity exists for exporting lique- fied natural gas (LNG)1 , given the large differential in nat- ural gas prices in the U.S. versus elsewhere in the world, and rising global demand. For example, in November 2012, the International Energy Administration reported: “The WEO finds that the extraordinary growth in oil and natural gas output in the United States will mean a sea- change in global energy flows. In the New Policies Sce- nario, the WEO’s central scenario, the United States becomes a net exporter of natural gas by 2020 and is almost self-sufficient in energy, in net terms, by 2035… While the regional picture for natural gas varies, the global outlook over the coming decades looks to be bright, as demand increases by 50% to 5 trillion cubic metres in 2035. Nearly half of the increase in production to 2035 is from unconventional gas, with most of this coming from the United States, Australia and China.”2 The U.S. becoming a leader in meeting global natural gas demand would be a clear benefit to the overall U.S. econ- omy, and particularly in states leading the way in natural gas production. It’s important to consider the benefits that accrue to work- ers, small businesses, individual states, and the U.S. econ- omy when domestic energy production, such as in natural gas, expands. Let’s review key points. Introduction The U.S. natural gas market has changed dramatically in recent years. Consider the drop in natural gas prices. For example, the annual average price of natural gas (dollars/mil. BTUs) went from $9.014 in 2005 to $4.026 in 2011. That 55 percent decline generated considerable savings for U.S. households and businesses via electricity prices – given that 25 percent of electric power is generated via natural gas – as well as for a wide array of industries that use natural gas in their production processes. Looking ahead, the opportunity exists for exporting liquefied natural gas (LNG), given the large differential in natural gas prices in the U.S. versus elsewhere in the world, and rising global demand.
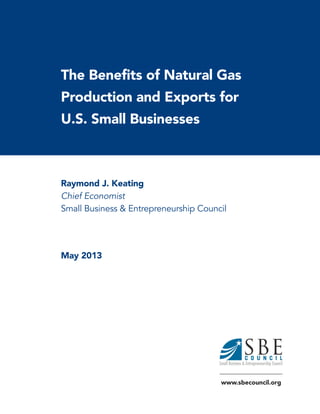
  • 6. 6 | The Benefits of Natural Gas Production and Exports for U.S. Small Businesses I. United States After small increases throughout the 1990s, for example, natural gas production in the U.S. hit a high of 19.62 tril- lion cubic feet in 2001, and then declined for the following four years. In 2005, U.S. natural gas marketed production registered 18.05 trillion cubic feet, which was roughly the same level as in 1993. However, growth resumed, and nat- ural gas production in the U.S. hit 23 trillion cubic feet in 2011, which was a 27 percent increase over 2005. All of the increase in natural gas production basically has come from shale gas, which increased by 947 percent from 2005 to 2011. What’s behind this vast expansion in recent produc- tion, not to mention an expanded view of resources into the future? The EIA explained, “Over the past decade, the combina- tion of horizontal drilling and hydraulic fracturing has allowed access to large volumes of shale gas that were pre- viously uneconomical to produce. The production of natu- ral gas from shale formations has rejuvenated the natural gas industry in the United States.”3 Looking into the future, the EIA “projects U.S. natural gas production to increase from 23.0 trillion cubic feet in 2011 to 33.1 trillion cubic feet in 2040, a 44% increase. Almost all of this increase in domestic natural gas production is due to projected growth in shale gas production, which grows from 7.8 trillion cubic feet in 2011 to 16.7 trillion cubic feet in 2040. Although the prospects for shale gas production are promising, there remains considerable uncertainty regarding 2011 Projections Shale Gas Nonassociated Offshore Nonassociated Onshore Coalbed Methane TightGas Associated with Oil Alaska History 35 30 25 20 15 10 5 0 1990 2000 2010 2020 2030 2040 Figure 3: U.S. Dry Natural Gas Production by Source, 1990-2040 Source: This figure is from the AEO2013 Early Release Overview, U.S. Energy Information Administration, December 5, 2012
  • 7. The Benefits of Natural Gas Production and Exports for U.S. Small Businesses | 7 That expansion in production has led to growth in employment in the energy sector, while the overall economy experienced a decline in jobs. the size and economics of this resource… An analysis in the Annual Energy Outlook 2012 (released June 2012) indicates that the uncertainty in the size and economics of the domes- tic shale gas resources could have a considerable impact on future domestic natural gas production and that 2035 shale gas production could be between 9.7 trillion cubic feet and 20.5 trillion cubic feet. U.S. total natural gas production is projected to range between 26.1 trillion cubic feet and 34.1 trillion cubic feet.”4 For good measure, proved reserves of U.S. dry natural gas went from 192.5 trillion cubic feet in 2004 to 304.6 trillion cubic feet in 2010 – a 58 percent expansion. This revolution in natural gas production – coupled with an increase in U.S. oil production (also due to the extraction tech- nologies of hydraulic fracturing and horizontal drilling being applied, especially in Texas and North Dakota) – has provided considerable growth in the energy sector of our economy in recent years, while the overall economy has badly faltered. It is important to keep in mind when looking ahead that projected resources and production in the areas of oil and natural gas usually turn out to be grossly under-estimated given innovations and improvements that occur in explo- ration and production technologies – as has been so glar- ingly the case with increases in both oil and natural gas production in recent years that were not expected a rela- tively short time ago. As already noted (and see Table 1), U.S. natural gas marketed production grew by 27 percent between 2005 and 2011. Table 1: U.S. Natural Gas Marketed Production 2005: 18,927.1 billion cubic feet 2011: 24,036.4 billion cubic feet Impact on Jobs That expansion in production has led to growth in employ- ment in the energy sector, while the overall economy expe- rienced a decline in jobs. Table 2 compares employment growth (all employment and business data from Census Bureau “County Business Pat- terns” unless otherwise noted) among employer firms in the overall economy, and in various energy industry sectors. The difference in the employment story between the energy sector and the overall economy could not be starker. While overall employment fell between 2005 and 2010, jobs grew markedly in the energy sector given the striking expansion in domestic natural gas and oil production. While U.S. total employment declined by 3.7 percent from 2005 to 2010, jobs grew by the following: • 27.6 percent in the oil and gas extraction sector;5 • 15.1 percent in the drilling oil and gas wells sector;6 • 38.5 percent in the support sector for oil and gas opera- tions;7 • 47 percent in the oil and gas pipeline and related struc- tures construction sector;8 and • 62 percent in the oil and gas field machinery and equip- ment manufacturing sector.9 While U.S. employers overall shed 4.3 million jobs over this period, employers in the five energy industries included here directly added 146,000 jobs.
  • 8. 8 | The Benefits of Natural Gas Production and Exports for U.S. Small Businesses Impact on Small Business At the same time, and not surprisingly, while the number of businesses (in this case, employer firms) in the nation declined, business growth was strong among the energy sector. And it is critical to note the role and growth of smaller businesses. Table 3 makes clear that expanded production in the energy sector has been a boon for small and midsize enter- prises. Or, to look at it from a different angle, expanded energy production has been driven by small and midsize businesses. For all of the U.S., total employer firms declined by 4.2 per- cent from 2005 to 2010, including a 3.7 percent decline in firms with less than 20 workers, and a 4.2 percent fall in firms with less than 500 workers. Again, compare those declines to the growth in energy industries over the same period: • Among oil and gas extraction businesses, the number of employer firms grew by 3.1 percent, including growth of 2.5 percent among firms with less than 20 workers and 3.0 percent among firms with less than 500 workers. • Among drilling oil and gas wells businesses, the number of employer firms grew by 7.2 percent, including growth of 4.7 percent among firms with less than 20 workers and 7.3 percent among firms with less than 500 workers. • Among oil and gas operations businesses, the number of employer firms grew by 24.5 percent, including growth Percent Sector 2005 2010 Change Total 116,317,003 111,970,095 -3.7% Oil/Gas Extraction 85,562 109,199 27.6% Drilling Oil and Gas Wells 66,084 76,072 15.1% Support for Oil and Gas Operations 136,038 188,468 38.5% Oil and Gas Pipeline and Related Structures Construction 86,321 126,856 47.0% Oil and Gas Field Machinery and Equipment Manufacturing 30,580 49,542 62.0% Table 2: Employment Growth Among Employer Firms, 2005-2010 of 24.5 percent among firms with less than 20 workers and 24.6 percent among firms with less than 500 workers. • Among oil and gas pipeline and related structures con- struction businesses, the number of employer firms grew by 5.1 percent, including growth of 3.5 percent among firms with less than 500 workers. • Among oil and gas field machinery and equipment man- ufacturing businesses, the number of employer firms grew by 61.0 percent, including growth of 59.0 percent among firms with less than 20 workers and 62.7 percent among firms with less than 500 workers. The growth in both jobs and small-midsize employer firms in the energy sector has been striking in recent years, once again especially given the abysmal performance of the overall economy. Finally, it must be noted that the energy sector in fact is not all about huge enterprises. As noted in Table 3, each energy sector looked at here is overwhelmingly populated by small and midsize firms. • Among oil and gas extraction businesses, 91.3 percent of employer firms in 2010 had less than 20 workers, and 98.6 percent had fewer than 500 employees. • Among drilling oil and gas wells businesses, 80.4 percent of employer firms in 2010 had less than 20 workers, and 97.8 percent had fewer than 500 employees. • Among oil and gas operations businesses, 84.7 percent
  • 9. The Benefits of Natural Gas Production and Exports for U.S. Small Businesses | 9 U.S. Total Employer Firms Number of Employees As Percent of Total Firms Total Less 20 Less 500 Less 20 Less 500 2005 5,983,546 5,357,887 5,966,069 89.5% 99.7% 2010 5,734,538 5,160,404 5,717,302 90.0% 99.7% Chg 05-10 -4.2% -3.7% -4.2% Oil/Gas Extraction Employer Firms Number of Employees As Percent of Total Firms Total Less 20 Less 500 Less 20 Less 500 2005 6,317 5,800 6,230 91.8% 98.6% 2010 6,513 5,947 6,420 91.3% 98.6% Chg 05-10 3.1% 2.5% 3.0% Drilling Oil and Gas Wells Firms Number of Employees As Percent of Total Firms Total Less 20 Less 500 Less 20 Less 500 2005 1,833 1,509 1,791 82.3% 97.7% 2010 1,965 1,580 1,921 80.4% 97.8% Chg 05-10 7.2% 4.7% 7.3% Support for Oil and Gas Operations Number of Employees As Percent of Total Firms Total Less 20 Less 500 Less 20 Less 500 2005 6,183 5,238 6,101 84.7% 98.7% 2010 7,696 6,522 7,601 84.7% 98.8% Chg 05-10 24.5% 24.5% 24.6% Oil and Gas Pipeline and Related Structures Construction Number of Employees As Percent of Total Firms Total Less 20 Less 500 Less 20 Less 500 2005 1,612 1,075 1,561 66.7% 96.8% 2010 1,695 1,068 1,616 63.0% 95.3% Chg 05-10 5.1% -0.7% 3.5% Oil and Gas Field Machinery and Equipment Manufacturing Number of Employees As Percent of Total Firms Total Less 20 Less 500 Less 20 Less 500 2005 480 293 442 61.0% 92.1% 2010 773 466 719 60.3% 93.0% Chg 05-10 61.0% 59.0% 62.7% Table 3: Employer Firms – U.S. Total and Energy Industries, 2005-2010
  • 10. 10 | The Benefits of Natural Gas Production and Exports for U.S. Small Businesses of employer firms in 2010 had less than 20 workers, and 98.8 percent had fewer than 500 employees. • Among oil and gas pipeline and related structures con- struction businesses, 63.0 percent of employer firms in 2010 had less than 20 workers, and 95.3 percent had fewer than 500 employees. • Among oil and gas field machinery and equipment man- ufacturing businesses, 60.3 percent of employer firms in 2010 had less than 20 workers, and 93.0 percent had fewer than 500 employees. Finally, in looking at the full picture of the impact uncon- ventional oil and natural gas production – that is, “uncon- ventional natural gas extracted from shale formations and from tight sands and unconventional oil extracted from shale and other dense rocks” – on the U.S. economy, IHS found:10 • “In 2012, capital expenditures will surpass $87 billion. These expenditures supporting the growth of unconven- tional oil and gas activity will reach $172.5 billion in 2020 and more than $353 billion in 2035.” • “Over 1.7 million jobs are attributable to unconventional oil and gas development today. These employment con- tributions are expected to rise to 3 million by the end of the decade and to 3.5 million jobs by 2035.” • “In 2012, unconventional oil and gas will contribute almost $238 billion in value added to the US economy. This contribution to gross domestic product (GDP) will increase more than 75% by 2020 to over $416 billion. By the final year of the forecast period, 2035, this will increase to nearly $475 billion.” Now let’s consider the developments in key states experiencing expanded opportunities on the natural gas production front.
  • 11. The Benefits of Natural Gas Production and Exports for U.S. Small Businesses | 11 II. Arkansas The increase in natural gas production has been dramatic in Arkansas via the Fayetteville Shale area. The state’s natural gas production, as highlighted in Table 4, expanded by 462.7 percent from 2005 to 2011. Impact on Jobs Table 5 compares employment growth (again, all employ- ment and business data from Census Bureau “County Busi- ness Patterns” unless otherwise noted) among employer establishments in the overall state, and in various energy industry sectors. The difference in the employment story between the energy sector and the overall economy is striking. While overall employment fell between 2005 and 2010, jobs grew markedly in the energy sector given the expan- sion in energy production. Arkansas total employment declined by 5.1 percent from 2005 to 2010, but jobs grew by the following: Table 4: Arkansas Natural Gas Marketed Production 2005: 190.5 billion cubic feet 2011: 1,072.2 billion cubic feet • 161.5 percent in the oil and gas extraction sector; • 254.9 percent in the drilling oil and gas wells sector; • 259.4 percent in the support sector for oil and gas oper- ations; and • 126.9 percent in the oil and gas pipeline and related structures construction sector. While Arkansas employers overall shed 51,950 jobs over this period, employers in the four energy industries (where data was available) included here added more than 5,600 jobs. Percent Sector 2005 2010 Change Total 1,017,424 965,474 -5.1% Oil/Gas Extraction 637 1,666 161.5% Drilling Oil and Gas Wells 692 2,456 254.9% Support for Oil and Gas Operations 817 2,936 259.4% Oil and Gas Pipeline and Related Structures Construction 588 1,334 126.9% Oil and Gas Field Machinery and Equipment Manufacturing NA NA NA Table 5: Arkansas Employment Growth Among Employer Establishments, 2005-2010
  • 12. Impact on Small Business At the same time, while the number of businesses (in this case, establishments) declined in the nation and in Arkansas (though at a slower pace of decline in Arkansas compared to the U.S.), the number of establishments grew strongly among Arkansas’ energy sector. And it is critical to note the role and growth of smaller businesses. Table 6 makes clear that expanded production in the energy sector has been a boon for small and midsize enter- prises in the state. Or, to look at it from a different angle, expanded energy production has been driven by small and midsize businesses. For all of the U.S., total employer establishments declined by 1.4 percent from 2005 to 2010, including a 3.5 percent decline in establishments with less than 20 workers, and a 3.1 percent fall in establishments with less than 500 workers. In Arkansas, total establishments declined by 1.3 percent, including a 1.5 percent fall among establishments with less than 20 workers, and a 1.3 percent decline among those with less than 500 workers. But compare those declines to the growth in these energy industries in Arkansas: • Among oil and gas extraction businesses, the number of employer establishments grew by 14.6 percent, includ- ing growth of 13.1 percent among those with less than 20 workers and 14.6 percent among establishments with less than 500 workers. • Among drilling oil and gas wells businesses, the number of employer establishments grew by 56.3 percent, includ- ing growth of 40.0 percent among establishments with less than 20 workers and 56.3 percent among establish- ments with less than 500 workers. • Among oil and gas operations businesses, the number of employer establishments grew by 77 percent, includ- ing growth of 51.8 percent among establishments with less than 20 workers and 77 percent among establish- ments with less than 500 workers. 12 | The Benefits of Natural Gas Production and Exports for U.S. Small Businesses The growth in both jobs and small-midsize employer estab- lishments in the energy sector has been striking in recent years, especially given the abysmal performance of the overall economy. Finally, it must be noted that the Arkansas energy sector is not all about big energy businesses. As noted in Table 6, each energy sector looked at is overwhelmingly populated by small and midsize establishments. • Among oil and gas extraction businesses, 93.1 percent of employer establishments in 2010 had less than 20 workers, and 100 percent had fewer than 500 employees. • Among drilling oil and gas wells businesses, 70 percent of employer establishments in 2010 had less than 20 workers, and 100 percent had fewer than 500 employees. • Among oil and gas operations businesses, 81.8 percent of employer establishments in 2010 had less than 20 workers, and 98.8 percent had fewer than 500 employees. • Among oil and gas pipeline and related structures con- struction businesses, 48.3 percent of employer estab- lishments in 2010 had less than 20 workers, and 95.3 percent had fewer than 500 employees.
  • 13. The Benefits of Natural Gas Production and Exports for U.S. Small Businesses | 13 Arkansas Total Establishments Number of Employees As Percent of Total Firms Total Less 20 Less 500 Less 20 Less 500 2005 66,039 57,236 65,844 86.7% 99.7% 2010 65,158 56,394 65,018 86.5% 99.8% AR 05-10 -1.3% -1.5% -1.3% US 05-10 -1.4% -3.5% -3.1% Arkansas Oil/Gas Extraction Employer Establishments Number of Employees As Percent of Total Firms Total Less 20 Less 500 Less 20 Less 500 2005 89 84 89 94.4% 100% 2010 102 95 102 93.1% 100% Chg 05-10 14.6% 13.1% 14.6% Arkansas Drilling Oil and Gas Wells Establishments Number of Employees As Percent of Total Firms Total Less 20 Less 500 Less 20 Less 500 2005 32 25 32 78.1% 100% 2010 50 35 50 70.0% 100% Chg 05-10 56.3% 40.0% 56.3% Arkansas Support for Oil and Gas Operations Establishments Number of Employees As Percent of Total Firms Total Less 20 Less 500 Less 20 Less 500 2005 87 83 87 95.4% 100% 2010 154 126 154 81.8% 100% Chg 05-10 77.0% 51.8% 77.0% Arkansas Oil and Gas Pipeline and Related Structures Construction Establishments Number of Employees As Percent of Total Firms Total Less 20 Less 500 Less 20 Less 500 2005 30 20 30 66.7% 100% 2010 29 14 29 48.3% 100% Chg 05-10 -3.3% -30.0% -3.3% Arkansas Oil and Gas Field Machinery and Equipment Manufacturing Establishments Number of Employees As Percent of Total Firms Total Less 20 Less 500 Less 20 Less 500 2005 1 0 1 0% 100% 2010 2 1 2 50% 100% Chg 05-10 100% - 100% Table 6: Establishments – Arkansas Total and Energy Industries, 2005-2010
  • 14. 14 | The Benefits of Natural Gas Production and Exports for U.S. Small Businesses III. Colorado The increase in natural gas production has been notable in Colorado. The state’s natural gas production, as highlighted in Table 7, expanded by 44.5 percent from 2005 to 2011. Impact on Jobs Table 8 compares employment growth (again, all employ- ment and business data from Census Bureau “County Busi- ness Patterns” unless otherwise noted) among employer establishments in the overall state, and in various energy industry sectors. The difference in the employment story between the energy sector and the overall economy is impressive. While overall employment grew between 2005 and 2010 in Colorado – compared to a decline in the U.S. overall – jobs grew markedly in the energy sector given the expan- sion in energy production. While U.S. total employment declined, Colorado total Table 7: Colorado Natural Gas Marketed Production 2005: 1,133.1 billion cubic feet 2011: 1,637.6 billion cubic feet employment grew by 1.0 percent from 2005 to 2010. On the energy front, jobs grew by the following: • 58.5 percent in the oil and gas extraction sector; • 34.9 percent in the drilling oil and gas wells sector; and • 74.6 percent in the support sector for oil and gas opera- tions. While Colorado employers overall added 19,072 jobs over this period, employers in the four energy industries (where data was available) included here added more than 6,363 jobs. That’s one in three jobs added coming from these energy industries. Percent Sector 2005 2010 Change Total 1,936,264 1,955,336 1.0% Oil/Gas Extraction 4,060 6,447 58.8% Drilling Oil and Gas Wells 2,678 3,612 34.9% Support for Oil and Gas Operations 4,381 7,648 74.6% Oil and Gas Pipeline and Related Structures Construction 1,473 1,248 -15.3% Oil and Gas Field Machinery and Equipment Manufacturing NA NA NA Table 8: Colorado Employment Growth Among Employer Establishments, 2005-2010
  • 15. The Benefits of Natural Gas Production and Exports for U.S. Small Businesses | 15 Impact on Small Business At the same time, while the number of businesses (in this case, establishments) in the nation declined, in Colorado, the number of establishments grew, and they expanded robustly in the state’s energy sector. And it is critical to note the role and growth of smaller businesses. Table 9 makes clear that expanded production in the energy sector has been a boon for small and midsize enter- prises in the state. Or, to look at it from a different angle, expanded energy production has been driven by small and midsize businesses. For all of the U.S., total employer establishments declined by 1.4 percent from 2005 to 2010, including a 3.5 percent decline in establishments with less than 20 workers, and a 3.1 percent fall in establishments with less than 500 work- ers. In Colorado, total establishments increased by 0.6 percent, including a 1.2 percent increase among establishments with less than 20 workers, and a 0.6 percent rise among those with less than 500 workers. Again, compare the U.S. decline to the growth in these energy industries in Colorado: • Among oil and gas extraction businesses, the number of employer establishments grew by 7.6 percent, including growth of 6.8 percent among establishments with less than 20 workers and 7.0 percent among establishments with less than 500 workers. • Among drilling oil and gas wells businesses, the number of employer establishments grew by 12.8 percent, includ- ing growth of 12.7 percent among establishments with less than 20 workers and 14.1 percent among establish- ments with less than 500 workers. • Among oil and gas operations businesses, the number of employer establishments grew by 61.4 percent, includ- ing growth of 58 percent among establishments with less than 20 workers and 61 percent among establishments with less than 500 workers. • Among oil and gas pipeline and related structures con- struction businesses, the number of employer establish- ments grew by 2 percent, including growth of 14.3 percent among establishments with less than 20 workers and 2 percent among those with less than 500 workers. The growth in both jobs and small-midsize employer estab- lishments in the energy sector has been noteworthy, again especially given the abysmal performance of the overall economy. Finally, it must be noted that the Colorado energy sector in fact is not all about huge enterprises. As noted in Table 9, each energy sector looked at is overwhelmingly populated by small and midsize establishments. • Among oil and gas extraction businesses, 87.4 percent of employer establishments in 2010 had less than 20 workers, and 99.5 percent had fewer than 500 employees. • Among drilling oil and gas wells businesses, 73.2 percent of employer establishments in 2010 had less than 20 workers, and 100 percent had fewer than 500 employees. • Among oil and gas operations businesses, 87.4 percent of employer establishments in 2010 had less than 20 workers, and 99.5 percent had fewer than 500 employees. • Among oil and gas pipeline and related structures con- struction businesses, 78.4 percent of employer estab- lishments in 2010 had less than 20 workers, and 100 percent had fewer than 500 employees. • Among oil and gas field machinery and equipment man- ufacturing businesses, 75 percent of employer establish- ments in 2010 had less than 20 workers, and 100 percent had fewer than 500 employees.
  • 16. 16 | The Benefits of Natural Gas Production and Exports for U.S. Small Businesses Colorado Total Establishments Number of Employees As Percent of Total Firms Total Less 20 Less 500 Less 20 Less 500 2005 151,070 133,125 150,799 88.1% 99.8% 2010 151,973 134,726 151,695 88.7% 99.8% CO 05-10 0.6% 1.2% 0.6% US 05-10 -1.4% -3.5% -3.1% Oil/Gas Extraction Employer Establishments Number of Employees As Percent of Total Firms Total Less 20 Less 500 Less 20 Less 500 2005 369 325 369 88.1% 100% 2010 397 347 395 87.4% 99.5% Chg 05-10 7.6% 6.8% 7.0% Drilling Oil and Gas Wells Establishments Number of Employees As Percent of Total Firms Total Less 20 Less 500 Less 20 Less 500 2005 86 63 85 73.3% 98.8% 2010 97 71 97 73.2% 100% Chg 05-10 12.8% 12.7% 14.1% Support for Oil and Gas Operations Establishments Number of Employees As Percent of Total Firms Total Less 20 Less 500 Less 20 Less 500 2005 355 317 354 89.3% 99.7% 2010 573 501 570 87.4% 99.5% Chg 05-10 61.4% 58.0% 61.0% Oil and Gas Pipeline and Related Structures Construction Establishments Number of Employees As Percent of Total Firms Total Less 20 Less 500 Less 20 Less 500 2005 50 35 50 70.0% 100% 2010 51 40 51 78.4% 100% Chg 05-10 2.0% 14.3% 2.0% Oil and Gas Field Machinery and Equipment Manufacturing Establishments Number of Employees As Percent of Total Firms Total Less 20 Less 500 Less 20 Less 500 2005 5 3 5 60% 100% 2010 4 3 4 75% 100% Chg 05-10 -20% 0% -20% Table 9: Establishments – Colorado Total and Energy Industries, 2005-2010
  • 17. The Benefits of Natural Gas Production and Exports for U.S. Small Businesses | 17 IV. Louisiana The increase in natural gas production has been sizeable in Louisiana, to say the least. The state’s natural gas production, as highlighted in Table 10, expanded by 133.7 percent from 2005 to 2011. Impact on Jobs Table 11 compares employment growth (again, all employ- ment and business data from Census Bureau “County Busi- ness Patterns” unless otherwise noted) among employer establishments in the overall state, and in various energy industry sectors. The difference in the employment story between the energy sector and the overall economy is notable, even with the decline in the oil and gas extraction sector. While overall employment declined between 2005 and 2010 in Louisiana – though at a much slower rate than the decline in the U.S. overall – jobs grew markedly in the energy sector given the expansion in energy production. Table 10: Louisiana Natural Gas Marketed Production 2005: 1,296.0 billion cubic feet 2011: 3,029.2 billion cubic feet Percent Sector 2005 2010 Change Total 1,617,507 1,599,551 -1.1% Oil/Gas Extraction 10,280 8,565 -16.7% Drilling Oil and Gas Wells 6,524 6,765 3.7% Support for Oil and Gas Operations 26,069 32,247 23.7% Oil and Gas Pipeline and Related Structures Construction 14,452 28,897 100% Oil and Gas Field Machinery and Equipment Manufacturing NA 3,575 NA Table 11: Louisiana Employment Growth Among Employer Establishments, 2005-2010 While Louisiana and U.S. total employmentdeclined, Louisiana employment grew in three of the four energy sectors for which data was available, expanding by the following: • 3.7 percent in the drilling oil and gas wells sector; • 23.7 percent in the support sector for oil and gas opera- tions; and • 100 percent in the oil and gas pipeline and related struc- tures construction industry. While Louisiana employers overall shed 17,956 jobs over this period, employers in the four energy industries (where data was available) included here added 19,149 jobs. That’s an incredible contrast.
  • 18. 18 | The Benefits of Natural Gas Production and Exports for U.S. Small Businesses Impact on Small Businesses At the same time, while the number of businesses (in this case, establishments) in the nation declined, in Louisiana, the number of establishments grew, and they expanded strongly in the state’s energy sector. It is critical to note the role and growth of smaller businesses as well. Table 12 makes clear that expanded production in the energy sector has been a boon for small and midsize enter- prises in the state. Or, to look at it from a different angle, expanded energy production has been driven by small and midsize businesses. For all of the U.S., total employer establishments declined by 1.4 percent from 2005 to 2010, including a 3.5 percent decline in firms with less than 20 workers, and a 3.1 per- cent fall in firms with less than 500 workers. In Louisiana, total establishments increased by 0.6 percent, including a 0.5 percent increase among establishments with less than 20 workers, and a 0.6 percent rise among those with less than 500 workers. Again, compare the U.S. decline to the growth in these energy industries in Louisiana: • Among oil and gas extraction businesses, the number of employer establishments grew by 6.0 percent, including growth of 8.8 percent among establishments with less than 20 workers and 6.6 percent among establishments with less than 500 workers. • Among oil and gas operations businesses, the number of employer establishments grew by 24.1 percent, includ- ing growth of 27.7 percent among establishments with less than 20 workers and 24.6 percent among establish- ments with less than 500 workers. • Among oil and gas pipeline and related structures con- struction businesses, the number of employer establish- ments grew by 25.7 percent, including growth of 24.3 percent among establishments with less than 500 workers. • Among field machinery and equipment manufacturing businesses, the number of employer establishments grew by 35.6 percent, including growth of 63 percent among establishments with less than 20 workers and 35.6 per- cent among establishments with less than 500 workers. The growth in both jobs and small-midsize employer estab- lishments in the energy sector has been noteworthy in recent years, again especially given the abysmal perform- ance of the overall economy. Finally, it must be noted that the Louisiana energy sector in fact is not all about huge enterprises. As noted in Table 12, each energy sector looked at is overwhelmingly popu- lated by small and midsize establishments. • Among oil and gas extraction businesses, 79.6 percent of employer establishments in 2010 had less than 20 workers, and 99.5 percent had fewer than 500 employees. • Among drilling oil and gas wells businesses, 69.5 percent of employer establishments in 2010 had less than 20 workers, and 99.4 percent had fewer than 500 employees. • Among oil and gas operations businesses, 74 percent of employer establishments in 2010 had less than 20 work- ers, and 98.9 percent had fewer than 500 employees. • Among oil and gas pipeline and related structures con- struction businesses, 43.9 percent of employer estab- lishments in 2010 had less than 20 workers, and 97 percent had fewer than 500 employees. • Among oil and gas field machinery and equipment man- ufacturing businesses, 55 percent of employer establish- ments in 2010 had less than 20 workers, and 100 percent had fewer than 500 employees.
  • 19. The Benefits of Natural Gas Production and Exports for U.S. Small Businesses | 19 Louisiana Total Establishments Number of Employees As Percent of Total Firms Total Less 20 Less 500 Less 20 Less 500 2005 102,790 87,638 102,526 85.3% 99.7% 2010 103,365 88,081 103,130 85.2% 99.8% LA 05-10 0.6% 0.5% 0.6% US 05-10 -1.4% -3.5% -3.1% Oil/Gas Extraction Employer Establishments Number of Employees As Percent of Total Firms Total Less 20 Less 500 Less 20 Less 500 2005 397 308 393 77.6% 99.0% 2010 421 335 419 79.6% 99.5% Chg 05-10 6.0% 8.8% 6.6% Drilling Oil and Gas Wells Establishments Number of Employees As Percent of Total Firms Total Less 20 Less 500 Less 20 Less 500 2005 179 127 177 70.9% 98.9% 2010 177 123 176 69.5% 99.4% Chg 05-10 -1.1% -3.1% -0.6% Support for Oil and Gas Operations Establishments Number of Employees As Percent of Total Firms Total Less 20 Less 500 Less 20 Less 500 2005 738 531 727 72.0% 98.5% 2010 916 678 906 74.0% 98.9% Chg 05-10 24.1% 27.7% 24.6% Oil and Gas Pipeline and Related Structures Construction Establishments Number of Employees As Percent of Total Firms Total Less 20 Less 500 Less 20 Less 500 2005 105 58 103 55.2% 98.1% 2010 132 58 128 43.9% 97.0% Chg 05-10 25.7% 0% 24.3% Oil and Gas Field Machinery and Equipment Manufacturing Establishments Number of Employees As Percent of Total Firms Total Less 20 Less 500 Less 20 Less 500 2005 59 27 59 45.8% 100% 2010 80 44 80 55.0% 100% Chg 05-10 35.6% 63.0% 35.6% Table 12: Establishments – Louisiana Total and Energy Industries, 2005-2010
  • 20. 20 | The Benefits of Natural Gas Production and Exports for U.S. Small Businesses V. North Dakota The big energy story in North Dakota in recent years has been the increase in oil production, pushing the state to ranking second among the states in oil output. At the same time,though,the increase in natural gas production has been sizeable as well. The state’s natural gas production,as highlighted in Table 13,expanded by 84.8 percent from 2005 to 2011. Table 13: North Dakota Natural Gas Marketed Production 2005: 52.557 billion cubic feet 2011: 97.102 billion cubic feet Percent Sector 2005 2010 Change Total 270,479 294,907 9.0% Oil/Gas Extraction 1,130 1,607 42.2% Drilling Oil and Gas Wells 554 1,442 160.3% Support for Oil and Gas Operations 1,036 3,604 247.9% Oil and Gas Pipeline and Related Structures Construction NA 75 NA Oil and Gas Field Machinery and Equipment Manufacturing NA NA NA Table 14: North Dakota Employment Growth Among Employer Establishments, 2005-2010 Impact on Jobs Table 14 compares employment growth (again, all employ- ment and business data from Census Bureau “County Busi- ness Patterns” unless otherwise noted) among employer establishments in the overall state, and in various energy industry sectors. The difference in the employment story between North Dakota, including its energy sector, and the overall U.S. economy is striking. While overall employment increased between 2005 and 2010 in North Dakota, jobs grew even faster in the energy sector given the expansion in energy production. While U.S. total employment declined, North Dakota employment grew overall, including in each energy sector for which data was available, expanding by the following: • 42.2 percent in the oil and gas extraction sector; • 160.3 percent in the drilling oil and gas wells sector; and • 247.9 percent in the support sector for oil and gas oper- ations. North Dakota employers overall added 24,428 jobs over this period, with employers in the three energy industries (where data was available) included here adding 3,933.
  • 21. The Benefits of Natural Gas Production and Exports for U.S. Small Businesses | 21 Impact on Small Businesses At the same time, while the number of businesses (in this case, establishments) in the nation declined, in North Dakota, the number of establishments grew, and they expanded strongly in the state’s energy sector. It is critical to note the role and growth of smaller businesses as well. Table 15 makes clear that expanded production in the energy sector has been a boon for small and midsize enter- prises in the state. Or, to look at it from a different angle, expanded energy production has been driven by small and midsize businesses. For all of the U.S., total employer establishments declined by 1.4 percent from 2005 to 2010, including a 3.5 percent decline in establishments with less than 20 workers, and a 3.1 percent fall in establishments with less than 500 workers. In North Dakota, total establishments increased by 3.7 per- cent, including a 1.0 percent increase among establish- ments with less than 20 workers, and a 2.5 percent rise among those with less than 500 workers. Again, compare the U.S. decline to the growth in these energy industries in North Dakota: • Among oil and gas extraction businesses, the number of employer establishments grew by 28.1 percent, includ- ing growth of 44 percent among establishments with less than 20 workers and 32.3 percent among establishments with less than 500 workers. • Among drilling oil and gas wells businesses, the number of employer establishments grew by 20 percent, includ- ing growth of 18.2 percent among establishments with less than 20 workers and 20 percent among establish- ments with less than 500 workers. • Among oil and gas operations businesses, the number of employer establishments grew by 74.5 percent, includ- ing growth of 46.1 percent among establishments with less than 20 workers and 74.5 percent among establish- ments with less than 500 workers. The growth in both jobs and small-midsize employer estab- lishments in the energy sector has been noteworthy in recent years, especially given the abysmal performance of the overall economy. Finally, it must be noted that the North Dakota energy sec- tor in fact is not all about huge enterprises. As noted in Table 15, each energy sector looked at is overwhelmingly populated by small and midsize establishments. • Among oil and gas extraction businesses, 87.8 percent of employer establishments in 2010 had less than 20 workers, and 100 percent had fewer than 500 employees. • Among drilling oil and gas wells businesses, 54.2 percent of employer establishments in 2010 had less than 20 workers, and 100 percent had fewer than 500 employees. • Among oil and gas operations businesses, 73 percent of employer establishments in 2010 had less than 20 workers, and 100 percent had fewer than 500 employees. • Among oil and gas pipeline and related structures con- struction businesses, 85.7 percent of employer estab- lishments in 2010 had less than 20 workers, and 100 percent had fewer than 500 employees. • Among oil and gas field machinery and equipment man- ufacturing businesses, 33 percent of employer establish- ments in 2010 had less than 20 workers, and 100 percent had fewer than 500 employees.
  • 22. 22 | The Benefits of Natural Gas Production and Exports for U.S. Small Businesses North Dakota Total Establishments Number of Employees As Percent of Total Firms Total Less 20 Less 500 Less 20 Less 500 2005 21,061 15,268 18,768 72.5% 89.1% 2010 21,832 15,427 19,236 70.7% 88.1% ND 05-10 3.7% 1.0% 2.5% US 05-10 -1.4% -3.5% -3.1% Oil/Gas Extraction Employer Establishments Number of Employees As Percent of Total Firms Total Less 20 Less 500 Less 20 Less 500 2005 32 25 31 78.1% 96.9% 2010 41 36 41 87.8% 100% Chg 05-10 28.1% 44.0% 32.3% Drilling Oil and Gas Wells Establishments Number of Employees As Percent of Total Firms Total Less 20 Less 500 Less 20 Less 500 2005 20 11 20 55.0% 100% 2010 24 13 24 54.2% 100% Chg 05-10 20.0% 18.2% 20.0% Support for Oil and Gas Operations Establishments Number of Employees As Percent of Total Firms Total Less 20 Less 500 Less 20 Less 500 2005 102 89 102 87.3% 100% 2010 178 130 178 73.0% 100% Chg 05-10 74.5% 46.1% 74.5% Oil and Gas Pipeline and Related Structures Construction Establishments Number of Employees As Percent of Total Firms Total Less 20 Less 500 Less 20 Less 500 2005 7 6 7 85.7% 100% 2010 7 6 7 85.7% 100% Chg 05-10 0% 0% 0% Oil and Gas Field Machinery and Equipment Manufacturing Establishments Number of Employees As Percent of Total Firms Total Less 20 Less 500 Less 20 Less 500 2005 2 2 2 100% 100% 2010 3 1 3 33.0% 100% Chg 05-10 50.0% -50.0% 50.0% Table 15: Establishments – North Dakota Total and Energy Industries, 2005-2010
  • 23. The Benefits of Natural Gas Production and Exports for U.S. Small Businesses | 23 VI. Ohio The opportunity for increased shale natural gas production exists in Ohio, but is only beginning to move forward. The state’s natural gas production, as noted in Table 16, actually contracted between 2005 and 2011, falling by 7.8 percent. Again,though,theopportunitiesforexpandedproductioncertainlyexistwithboththeUticaandMarcellusShale plays reaching into the state. In fact, it is worth noting that a December 2012 IHS study projected that jobs tied to unconventionaloilandgasproductioninOhiocouldrisefrom38,830in2012to143,595in2020and266,624in2035.11 Table 16: Ohio Natural Gas Marketed Production 2005: 85.523 billion cubic feet 2011: 78.858 billion cubic feet Percent Sector 2005 2010 Change Total 4,762,618 4,352,481 -8.6% Oil/Gas Extraction 1,355 1,340 -1.1% Drilling Oil and Gas Wells 515 542 5.7% Support for Oil and Gas Operations 1,206 1,023 -15.2% Oil and Gas Pipeline and Related Structures Construction 2,281 2,411 5.7% Oil and Gas Field Machinery and Equipment Manufacturing NA NA NA Table 17: Ohio Employment Growth Among Employer Establishments, 2005-2010 For good measure, a recent New York Times story noted how investment in the state is stepping up.12 It was noted in the report that “natural gas buried in shale thousands of feet below the surface is attracting more than $1 billion in private investment and rapidly reviving the area as an energy pro- ducer. To prepare, market and transport the natural gas, companies are building an expansive network of regional field offices, processing plants and other infrastructure… In public statements, though, energy industry executives have said drilling and production are being impeded by a short- age of processing plants and pipelines. Chesapeake and other leading production and processing companies are attacking that problem with an infrastructure development program never seen here, said Thomas E. Stewart, executive vice president of the Ohio Oil and Gas Association… With all this energy-related construction, industry executives believe that Ohio will produce two billion to three billion cubic feet of processed gas daily within the decade.” Impact on Jobs Table 17 compares employment growth (again, all employ-
  • 24. 24 | The Benefits of Natural Gas Production and Exports for U.S. Small Businesses ment and business data from Census Bureau “County Busi- ness Patterns” unless otherwise noted) among employer establishments in the overall state, and in various energy industry sectors. Unfortunately, given the limited activity on the energy front, Ohio has suffered along with the rest of the nation during these tough economic times. While U.S. total employment declined from 2005 to 2010, it fell even more in Ohio. And the jobs story in the energy sector was mixed, with employment: • declining by 1.1 percent in the oil and gas extraction sector; • increasing by 5.7 percent in the drilling oil and gas wells sector; • declining by 15.2 percent in the support sector for oil and gas operations; and • increasing by 5.7 percent in the oil and gas pipeline and related structures construction. Impact on Small Businesses And while the number of businesses (in this case, estab- lishments) in the nation declined, in Ohio, the decline was even larger. As noted in Table 18, for all of the U.S., total employer estab- lishments declined by 1.4 percent from 2005 to 2010, includ- ing a 3.5 percent decline in firms with less than 20 workers, and a 3.1 percent fall in firms with less than 500 workers. In Ohio, total establishments decreased by 6.4 percent, including a 9.5 percent drop among establishments with less than 20 workers, and a 8.6 percent fall off among those with less than 500 workers. Again, compared with the U.S. in general and other states that have moved ahead aggressively on energy production, Ohio’s numbers in the energy sector regarding establish- ment growth have been very mixed: • Among oil and gas extraction businesses, the number of employer establishments fell by 5.7 percent, including a fall of 6.2 percent among establishments with less than 20 workers and 5.7 percent among establishments with less than 500 workers. • Among drilling oil and gas wells businesses, the number of employer establishments declined by 1.4 percent, including growth of 5 percent among establishments with less than 20 workers and a decline of 1.4 percent among establishments with less than 500 workers. • Among oil and gas operations businesses, the number of employer establishments actually grew by 9.4 percent, including growth of 9.4 percent among establishments with less than 20 workers and 9.4 percent among estab- lishments with less than 500 workers. • Among oil and gas pipeline and related structures con- struction businesses, the number of employer establish- ments grew by 16.9 percent, including growth of 13.2 percent among establishments with less than 20 workers and 19 percent among those with less than 500. • Among oil and gas field machinery and equipment manu- facturing businesses, the number of employer establish- ments fell by 33.3 percent, including a decline of 50 percent among establishments with less than 20 workers and 33.3 percent among establishments with less than 500 workers. Nonetheless, it must be noted that the Ohio energy sector still in fact is not about huge enterprises. As noted in Table 18, each energy sector looked at is overwhelmingly popu- lated by small and midsize establishments. • Among oil and gas extraction businesses, 92.9 percent of employer establishments in 2010 had less than 20 work- ers, and 100 percent had fewer than 500 employees. • Among drilling oil and gas wells businesses, 91.3 percent of employer establishments in 2010 had less than 20 workers, and 100 percent had fewer than 500 employees. • Among oil and gas operations businesses, 92.1 percent of employer establishments in 2010 had less than 20 workers, and 100 percent had fewer than 500 employees. • Among oil and gas pipeline and related structures con- struction businesses, 62.3 percent of employer estab- lishments in 2010 had less than 20 workers, and 100 percent had fewer than 500 employees. • Among oil and gas field machinery and equipment man- ufacturing businesses, 66.7 percent of employer estab- lishments in 2010 had less than 20 workers, and 100 percent had fewer than 500 employees. In the end, the change in Ohio employment and small busi- ness growth will increase like other states with significant shale-based energy resources once the state starts moving ahead aggressively with production. And that will only be fed further via LNG exports.
  • 25. The Benefits of Natural Gas Production and Exports for U.S. Small Businesses | 25 Ohio Total Establishments Number of Employees As Percent of Total Firms Total Less 20 Less 500 Less 20 Less 500 2005 270,968 181,984 223,825 67.2% 82.6% 2010 253,491 164,646 204,503 65.0% 80.7% OH 05-10 -6.4% -9.5% -8.6% US 05-10 -1.4% -3.5% -3.1% Oil/Gas Extraction Employer Establishments Number of Employees As Percent of Total Firms Total Less 20 Less 500 Less 20 Less 500 2005 209 195 209 93.3% 100% 2010 197 183 197 92.9% 100% Chg 05-10 -5.7% -6.2% -5.7% Drilling Oil and Gas Wells Establishments Number of Employees As Percent of Total Firms Total Less 20 Less 500 Less 20 Less 500 2005 70 60 70 85.7% 100% 2010 69 63 69 91.3% 100% Chg 05-10 -1.4% 5.0% -1.4% Support for Oil and Gas Operations Establishments Number of Employees As Percent of Total Firms Total Less 20 Less 500 Less 20 Less 500 2005 138 127 138 92.0% 100% 2010 151 139 151 92.1% 100% Chg 05-10 9.4% 9.4% 9.4% Oil and Gas Pipeline and Related Structures Construction Establishments Number of Employees As Percent of Total Firms Total Less 20 Less 500 Less 20 Less 500 2005 59 38 58 64.4% 98.3% 2010 69 43 69 62.3% 100% Chg 05-10 16.9% 13.2% 19.0% Oil and Gas Field Machinery and Equipment Manufacturing Establishments Number of Employees As Percent of Total Firms Total Less 20 Less 500 Less 20 Less 500 2005 9 8 9 88.9% 100% 2010 6 4 6 66.7% 100% Chg 05-10 -33.3% -50.0% -33.3% Table 18: Establishments – Ohio Total and Energy Industries, 2005-2010
  • 26. 26 | The Benefits of Natural Gas Production and Exports for U.S. Small Businesses Impact on Jobs Table 20 compares employment growth (again, all employ- ment and business data from Census Bureau “County Busi- ness Patterns” unless otherwise noted) among employer establishments in the overall state, and in various energy industry sectors. The difference in the employment story between Oklahoma, including its energy sector, and the overall U.S. economy is striking. While overall employment increased between 2005 and 2010 in Oklahoma, jobs grew robustly in the energy sector given the expansion in energy production. While U.S. total employment declined, Oklahoma employ- ment grew overall, including in the energy sector, expand- ing by the following: VII. Oklahoma Natural gas production in Oklahoma,as highlighted in Table 19,expanded by 15.2 percent from 2005 to 2011. Table 19: Oklahoma Natural Gas Marketed Production 2005: 1,639.3 billion cubic feet 2011: 1,888.9 billion cubic feet Percent Sector 2005 2010 Change Total 1,220,285 1,241,168 1.7% Oil/Gas Extraction 9,878 14,685 48.7% Drilling Oil and Gas Wells 6,460 7,317 13.3% Support for Oil and Gas Operations 12,705 16,520 30.0% Oil and Gas Pipeline and Related Structures Construction 2,956 3,825 29.4% Oil and Gas Field Machinery and Equipment Manufacturing 3,746 3,744 -0.05% Table 20: Oklahoma Employment Growth Among Employer Establishments, 2005-2010 • 48.7 percent in the oil and gas extraction sector; • 13.3 percent in the drilling oil and gas wells sector; • 30 percent in the support sector for oil and gas opera- tions; and • 29.4 percent in the oil and gas pipeline and related struc- tures construction sector. Oklahoma employers overall added 20,833 jobs over this period, with employers in the energy industries included here adding 10,346, or half the jobs added.
  • 27. The Benefits of Natural Gas Production and Exports for U.S. Small Businesses | 27 Impact on Small Businesses At the same time, while the number of businesses (in this case, establishments) in the nation declined, in Oklahoma, the number of establishments grew, and they expanded strongly in the state’s energy sector. It is critical to note the role and growth of smaller businesses as well. Table 21 makes clear that expanded production in the energy sector has been a boon for small and midsize enter- prises in the state. Or, to look at it from a different angle, expanded energy production has been driven by small and midsize businesses. For all of the U.S., total employer establishments declined by 1.4 percent from 2005 to 2010, including a 3.5 percent decline in firms with less than 20 workers, and a 3.1 per- cent fall in firms with less than 500 workers. In Oklahoma, total establishments increased by 1.7 percent, including a 1.4 percent increase among establishments with less than 20 workers, and a 1.7 percent rise among those with less than 500 workers. Again, compare the U.S. decline to the growth in these energy industries in Oklahoma: • Among oil and gas extraction businesses, the number of employer establishments grew by 11.8 percent, includ- ing growth of 10.2 percent among establishments with less than 20 workers and 11.8 percent among establish- ments with less than 500 workers. • Among oil and gas operations businesses, the number of employer establishments grew by 37.3 percent, includ- ing growth of 35.7 percent among establishments with less than 20 workers and 37.3 percent among establish- ments with less than 500 workers. • Among oil and gas pipeline and related structures con- struction businesses, the number of employer establish- ments grew by 14.3 percent, including growth of 9.0 percent among those with less than 20 workers and 13.3 percent among establishments with less than 500 work- ers. • Among oil and gas field machinery and equipment man- ufacturing businesses, the number of employer estab- lishments grew by 28.4 percent, including growth of 36.1 percent among those with less than 20 workers and 28.8 percent among those with less than 500 workers. The growth in both jobs and small-midsize employer estab- lishments in Oklahoma’s energy sector has been strong in recent years, again especially given the abysmal perform- ance of the overall U.S. economy. Finally, it must be noted that the Oklahoma energy sector in fact is not the domain of huge enterprises. As noted in Table 21, each energy sector looked at is overwhelmingly populated by small and midsize establishments. • Among oil and gas extraction businesses, 90.6 percent of employer establishments in 2010 had less than 20 workers, and 99.9 percent had fewer than 500 employees. • Among drilling oil and gas wells businesses, 79.7 percent of employer establishments in 2010 had less than 20 workers, and 98.3 percent had fewer than 500 employees. • Among oil and gas operations businesses, 86.9 percent of employer establishments in 2010 had less than 20 workers, and 99.8 percent had fewer than 500 employees. • Among oil and gas pipeline and related structures con- struction businesses, 64.3 percent of employer estab- lishments in 2010 had less than 20 workers, and 99.1 percent had fewer than 500 employees. • Among oil and gas field machinery and equipment man- ufacturing businesses, 57 percent of employer establish- ments in 2010 had less than 20 workers, and 98.8 percent had fewer than 500 employees.
  • 28. 28 | The Benefits of Natural Gas Production and Exports for U.S. Small Businesses Oklahoma Total Establishments Number of Employees As Percent of Total Firms Total Less 20 Less 500 Less 20 Less 500 2005 88,548 76,986 88,369 86.9% 99.8% 2010 90,050 78,044 89,885 86.7% 99.8% OK 05-10 1.7% 1.4% 1.7% US 05-10 -1.4% -3.5% -3.1% Oil/Gas Extraction Employer Establishments Number of Employees As Percent of Total Firms Total Less 20 Less 500 Less 20 Less 500 2005 1,076 989 1,075 91.9% 99.9% 2010 1,203 1,090 1,202 90.6% 99.9% Chg 05-10 11.8% 10.2% 11.8% Drilling Oil and Gas Wells Establishments Number of Employees As Percent of Total Firms Total Less 20 Less 500 Less 20 Less 500 2005 235 195 233 83.0% 99.1% 2010 237 189 233 79.7% 98.3% Chg 05-10 0.9% -3.0% 0% Support for Oil and Gas Operations Establishments Number of Employees As Percent of Total Firms Total Less 20 Less 500 Less 20 Less 500 2005 914 804 912 88.0% 99.8% 2010 1,255 1,091 1,252 86.9% 99.8% Chg 05-10 37.3% 35.7% 37.3% Oil and Gas Pipeline and Related Structures Construction Establishments Number of Employees As Percent of Total Firms Total Less 20 Less 500 Less 20 Less 500 2005 98 66 98 67.3% 100% 2010 112 72 111 64.3% 99.1% Chg 05-10 14.3% 9.0% 13.3% Oil and Gas Field Machinery and Equipment Manufacturing Establishments Number of Employees As Percent of Total Firms Total Less 20 Less 500 Less 20 Less 500 2005 67 36 66 53.7% 98.5% 2010 86 49 85 57.0% 98.8% Chg 05-10 28.4% 36.1% 28.8% Table 21: Establishments – Oklahoma Total and Energy Industries, 2005-2010
  • 29. The Benefits of Natural Gas Production and Exports for U.S. Small Businesses | 29 Impact on Jobs Table 23 compares employment growth (again, all employ- ment and business data from Census Bureau “County Busi- ness Patterns” unless otherwise noted) among employer establishments in the overall state, and in various energy indus- try sectors. The difference in the employment story between the energy sector and the overall economy is striking. While overall employment fell between 2005 and 2010, jobs grew markedly in the energy sector given the expan- sion in energy production. While both U.S. and Pennsylvania total employment declined from 2005 to 2010, Pennsylvania jobs grew by the following: • 80.8 percent in the oil and gas extraction sector; • 218.7 percent in the drilling oil and gas wells sector; • 120.7 percent in the support sector for oil and gas oper- ations; and • 150.3 percent in the oil and gas pipeline and related structures construction sector. While Pennsylvania employers overall shed 106,437 jobs over this period, employers in the four energy industries (where data was available) included here added more than 5,823 jobs. VIII. Pennsylvania The increase in natural gas production has been dramatic in Pennsylvania via the Marcellus Shale area. The state’s natural gas production, as highlighted in Table 22, expanded by 677.8 percent from 2005 to 2011. Table 22: Pennsylvania Natural Gas Marketed Production 2005: 168.5 billion cubic feet 2011: 1,310.6 billion cubic feet Percent Sector 2005 2010 Change Total 5,082,630 4,976,193 -2.1% Oil/Gas Extraction 1,809 3,270 80.8% Drilling Oil and Gas Wells 846 2,696 218.7% Support for Oil and Gas Operations 1,640 3,620 120.7% Oil and Gas Pipeline and Related Structures Construction 1,025 2,566 150.3% Oil and Gas Field Machinery and Equipment Manufacturing 347 301 -13.3% Table 23: Pennsylvania Employment Growth Among Employer Establishments, 2005-2010
  • 30. 30 | The Benefits of Natural Gas Production and Exports for U.S. Small Businesses Impact on Small Businesses At the same time, while the number of businesses (in this case, establishments) declined in the nation and in Penn- sylvania, the number of establishments grew strongly among Pennsylvania’s energy sector. And it is critical to note the role and growth of smaller businesses. Table 24 makes clear that expanded production in the energy sector has been a boon for small and midsize enter- prises in the state. Or, to look at it from a different angle, expanded energy production has been driven by small and midsize businesses. For all of the U.S., total employer establishments declined by 1.4 percent from 2005 to 2010, including a 3.5 percent decline in firms with less than 20 workers, and a 3.1 per- cent fall in firms with less than 500 workers. In Pennsylvania, total establishments declined by 2.1 per- cent, including a 2.2 percent fall among establishments with less than 20 workers, and a 2.1 percent decline among those with less than 500 workers. Compare those declines to the growth in these energy industries in Pennsylvania: • Among oil and gas extraction businesses, the number of employer establishments grew by 40.7 percent, includ- ing growth of 36.3 percent among establishments with less than 20 workers and 40.7 percent among establish- ments with less than 500 workers. • Among drilling oil and gas wells businesses, the number of employer establishments grew by 104.2 percent, including growth of 121.6 percent among establishments with less than 20 workers and 102.1 percent among establishments with less than 500 workers. • Among supporting oil and gas operations businesses, the number of employer establishments grew by 119.5 per- cent, including growth of 111.7 percent among those with less than 20 workers and 119.5 percent among establishments with less than 500 workers. • Among oil and gas pipeline and related structures con- struction businesses, the number of employer establish- ments grew by 14.8 percent, including growth of 13 percent among establishments with less than 500 workers. The growth in both jobs and small-midsize employer estab- lishments in the energy sector has been striking in recent years, especially given the abysmal performance of the overall economy. Finally, it must be noted that the Pennsylvania energy sec- tor is not all about huge enterprises. As noted in Table 24, each energy sector looked at is overwhelmingly populated by small and midsize establishments. • Among oil and gas extraction businesses, 80.1 percent of employer establishments in 2010 had less than 20 workers, and 100 percent had fewer than 500 employees. • Among drilling oil and gas wells businesses, 83.7 percent of employer establishments in 2010 had less than 20 workers, and 99 percent had fewer than 500 employees. • Among oil and gas operations businesses, 75.1 percent of employer establishments in 2010 had less than 20 workers, and 100 percent had fewer than 500 employees. • Among oil and gas pipeline and related structures con- struction businesses, 74.2 percent of employer estab- lishments in 2010 had less than 20 workers, and 98.4 percent had fewer than 500 employees. • Among oil and gas field machinery and equipment man- ufacturing establishments, 50 percent of employer estab- lishments in 2010 had less than 20 workers, and 100 percent had fewer than 500 employees.
  • 31. The Benefits of Natural Gas Production and Exports for U.S. Small Businesses | 31 Pennsylvania Total Establishments Number of Employees As Percent of Total Firms Total Less 20 Less 500 Less 20 Less 500 2005 303,333 258,823 302,449 85.3% 99.7% 2010 297,023 253,251 296,208 85.3% 99.7% PA 05-10 -2.1% -2.2% -2.1% US 05-10 -1.4% -3.5% -3.1% Oil/Gas Extraction Employer Establishments Number of Employees As Percent of Total Firms Total Less 20 Less 500 Less 20 Less 500 2005 150 124 150 82.7% 100% 2010 211 169 211 80.1% 100% Chg 05-10 40.7% 36.3% 40.7% Drilling Oil and Gas Wells Establishments Number of Employees As Percent of Total Firms Total Less 20 Less 500 Less 20 Less 500 2005 48 37 48 77.1% 100% 2010 98 82 97 83.7% 99.0% Chg 05-10 104.2% 121.6% 102.1% Support for Oil and Gas Operations Establishments Number of Employees As Percent of Total Firms Total Less 20 Less 500 Less 20 Less 500 2005 77 60 77 77.9% 100% 2010 169 127 169 75.1% 100% Chg 05-10 119.5% 111.7% 119.5% Oil and Gas Pipeline and Related Structures Construction Establishments Number of Employees As Percent of Total Firms Total Less 20 Less 500 Less 20 Less 500 2005 54 46 54 85.2% 100% 2010 62 46 61 74.2% 98.4% Chg 05-10 14.8% 0% 13.0% Oil and Gas Field Machinery and Equipment Manufacturing Establishments Number of Employees As Percent of Total Firms Total Less 20 Less 500 Less 20 Less 500 2005 11 5 11 45.5% 100% 2010 10 5 10 50.0% 100% Chg 05-10 -9.1% 0% -9.1% Table 24: Establishments – Pennsylvania Total and Energy Industries, 2005-2010
  • 32. 32 | The Benefits of Natural Gas Production and Exports for U.S. Small Businesses Impact on Jobs Table 26 compares employment growth (all employment and business data from Census Bureau “County Business Patterns” unless otherwise noted) among employer estab- lishments in the overall state, and in various energy indus- try sectors. The difference in the employment story in Texas versus the U.S. at large is breathtaking, including the growth in the Texas energy sector. While Texas total employment increased by 5.8% percent from 2005 to 2010, jobs grew by the following: • 25.7 percent in the oil and gas extraction sector; • 3.8 percent in the drilling oil and gas wells sector; • 47.9 percent in the support sector for oil and gas opera- tions; • 42.3 percent in the oil and gas pipeline and related struc- tures construction sector; and • 28.8 percent in the oil and gas field machinery and equip- ment manufacturing sector. Texas employers overall added 480,136 jobs over this period, including employers in the energy industries included here adding 53,692 jobs. IX. Texas The increase in natural gas production has been considerable in Texas. The state’s natural gas production, as highlighted in Table 25, expanded by 34.8 percent from 2005 to 2011. Table 25: Texas Natural Gas Marketed Production 2005: 5,276.4 billion cubic feet 2011: 7,112.9 billion cubic feet Percent Sector 2005 2010 Change Total 8,305,102 8,785,238 5.8% Oil/Gas Extraction 34,124 42,889 25.7% Drilling Oil and Gas Wells 31,310 32,485 3.8% Support for Oil and Gas Operations 53,064 78,505 47.9% Oil and Gas Pipeline and Related Structures Construction 29,299 41,699 42.3% Oil and Gas Field Machinery and Equipment Manufacturing 20,544 26,455 28.8% Table 26: Texas Employment Growth Among Employer Establishments, 2005-2010
  • 33. The Benefits of Natural Gas Production and Exports for U.S. Small Businesses | 33 Impact on Small Businesses At the same time, while the number of businesses (in this case, establishments) declined in the nation, the number of establishments grew strongly in Texas, including in the energy sector. And it is critical to note the role and growth of smaller businesses. Table 27 makes clear that expanded production in the energy sector has been a boon for small and midsize enter- prises in the state. Or, to look at it from a different angle, expanded energy production has been driven by small and midsize businesses. For all of the U.S., total employer establishments declined by 1.4 percent from 2005 to 2010, including a 3.5 percent decline in firms with less than 20 workers, and a 3.1 per- cent fall in firms with less than 500 workers. In Texas, total establishments increased by 4.9 percent, including a 4.7 percent increase among establishments with less than 20 workers, and a 4.9 percent increase among those with less than 500 workers. The growth in energy industries in Texas were: • Among oil and gas extraction businesses, the number of employer establishments grew by 9 percent, including growth of 6.7 percent among establishments with less than 20 workers and 9.1 percent among establishments with less than 500 workers. • Among drilling oil and gas wells businesses, the number of employer establishments grew by 19.1 percent, includ- ing growth of 12 percent among establishments with less than 20 workers and 20.7 percent among establishments with less than 500 workers. • Among supporting oil and gas operations businesses, the number of employer establishments grew by 34.2 per- cent, including growth of 29.4 percent among establish- ments with less than 20 workers and 34.4 percent among establishments with less than 500 workers. • Among oil and gas pipeline and related structures con- struction businesses, the number of employer establish- ments grew by 37.8 percent, including growth of 36 percent among establishments with less than 20 workers and 38.2 percent among establishments with less than 500 workers. • Among oil and gas field machinery and equipment man- ufacturing businesses, the number of employer estab- lishments grew by 11.4 percent, including growth of 14.8 percent among establishments with less than 20 workers and 11.4 percent among those with less than 500. The growth in both jobs and small-midsize employer estab- lishments in the energy sector has been striking in recent years, especially given the abysmal performance of the overall economy. Finally, it must be noted that the Texas energy sector in fact is not all about so-called “Big Oil.” As noted in Table 27, each energy sector looked at is overwhelmingly populated by small and midsize establishments. • Among oil and gas extraction businesses, 88.7 percent of employer establishments in 2010 had less than 20 workers, and 99.9 percent had fewer than 500 employees. • Among drilling oil and gas wells businesses, 72 percent of employer establishments in 2010 had less than 20 workers, and 98.6 percent had fewer than 500 employees. • Among oil and gas operations businesses, 78.3 percent of employer establishments in 2010 had less than 20 workers, and 99.6 percent had fewer than 500 employees. • Among oil and gas pipeline and related structures con- struction businesses, 53.3 percent of employer estab- lishments in 2010 had less than 20 workers, and 97 percent had fewer than 500 employees. • Among oil and gas field machinery and equipment man- ufacturing establishments, 54.4 percent of employer establishments in 2010 had less than 20 workers, and 96.8 percent had fewer than 500 employees.
  • 34. 34 | The Benefits of Natural Gas Production and Exports for U.S. Small Businesses Texas Total Establishments Number of Employees As Percent of Total Firms Total Less 20 Less 500 Less 20 Less 500 2005 497,758 423,838 496,364 85.1% 99.7% 2010 522,146 443,599 520,718 85.0% 99.7% TX 05-10 4.9% 4.7% 4.9% US 05-10 -1.4% -3.5% -3.1% Oil/Gas Extraction Employer Establishments Number of Employees As Percent of Total Firms Total Less 20 Less 500 Less 20 Less 500 2005 2,958 2,681 2,952 90.6% 99.8% 2010 3,225 2,860 3,222 88.7% 99.9% Chg 05-10 9.0% 6.7% 9.1% Drilling Oil and Gas Wells Establishments Number of Employees As Percent of Total Firms Total Less 20 Less 500 Less 20 Less 500 2005 587 449 571 76.5% 97.3% 2010 699 503 689 72.0% 98.6% Chg 05-10 19.1% 12.0% 20.7% Support for Oil and Gas Operations Establishments Number of Employees As Percent of Total Firms Total Less 20 Less 500 Less 20 Less 500 2005 2,377 1,930 2,365 81.2% 99.5% 2010 3,191 2,497 3,179 78.3% 99.6% Chg 05-10 34.2% 29.4% 34.4% Oil and Gas Pipeline and Related Structures Construction Establishments Number of Employees As Percent of Total Firms Total Less 20 Less 500 Less 20 Less 500 2005 365 197 353 54.0% 96.7% 2010 503 268 488 53.3% 97.0% Chg 05-10 37.8% 36.0% 38.2% Oil and Gas Field Machinery and Equipment Manufacturing Establishments Number of Employees As Percent of Total Firms Total Less 20 Less 500 Less 20 Less 500 2005 307 162 297 52.8% 96.7% 2010 342 186 331 54.4% 96.8% Chg 05-10 11.4% 14.8% 11.4% Table 27: Establishments – Texas Total and Energy Industries, 2005-2010
  • 35. The Benefits of Natural Gas Production and Exports for U.S. Small Businesses | 35 Impact on Jobs Table 29 compares employment growth (again, all employ- ment and business data from Census Bureau “County Busi- ness Patterns” unless otherwise noted) among employer establishments in the overall state, and in various energy industry sectors. The difference in the employment story in Utah versus the U.S. at large is striking, including the growth in the Utah energy sector. While Utah total employment increased by 4.8% percent from 2005 to 2010, jobs grew by the following: • 22.9 percent in the oil and gas extraction sector; • 17.4 percent in the drilling oil and gas wells sector; and • 50.1 percent in the support sector for oil and gas opera- tions. Utah employers overall added 46,457 jobs over this period, including employers in the energy industries included here adding 1,038 jobs. X. Utah The increase in natural gas production has been sizeable in Utah. The state’s natural gas production, as highlighted in Table 28, expanded by 51.9 percent from 2005 to 2011. Table 28: Utah Natural Gas Marketed Production 2005: 301.2 billion cubic feet 2011: 457.5 billion cubic feet Percent Sector 2005 2010 Change Total 974,686 1,021,143 4.8% Oil/Gas Extraction 1,027 1,262 22.9% Drilling Oil and Gas Wells 610 716 17.4% Support for Oil and Gas Operations 1,582 2,374 50.1% Oil and Gas Pipeline and Related Structures Construction 547 452 -17.4% Oil and Gas Field Machinery and Equipment Manufacturing NA NA NA Table 29: Utah Employment Growth Among Employer Establishments, 2005-2010
  • 36. 36 | The Benefits of Natural Gas Production and Exports for U.S. Small Businesses Impact on Small Businesses At the same time, while the number of businesses (in this case, establishments) declined in the nation, the number of establishments grew strongly in Utah, including in the energy sector. And it is critical to note the role and growth of smaller businesses. Table 30 makes clear that expanded production in the energy sector has been a boon for small and midsize enter- prises in the state. Or, to look at it from a different angle, expanded energy production has been driven by small and midsize businesses. For all of the U.S., total employer establishments declined by 1.4 percent from 2005 to 2010, including a 3.5 percent decline in firms with less than 20 workers, and a 3.1 per- cent fall in firms with less than 500 workers. In Utah, though, total establishments increased by 5.0 per- cent, including a 5.3 percent rise among establishments with less than 20 workers, and a 5.0 percent increase among those with less than 500 workers. The growth in energy industries in Utah were: • Among oil and gas extraction businesses, the number of employer establishments grew by 3.6 percent, including growth of 10 percent among establishments with less than 20 workers and 3.6 percent among establishments with less than 500 workers. • Among drilling oil and gas wells businesses, the number of employer establishments grew by 56.8 percent, includ- ing growth of 33.3 percent among establishments with less than 20 workers and 56.8 percent among establish- ments with less than 500 workers. • Among supporting oil and gas operations businesses, the number of employer establishments grew by 41.2 per- cent, including growth of 39.9 percent among establish- ments with less than 20 workers and 41.2 percent among establishments with less than 500 workers. • Among oil and gas pipeline and related structures con- struction businesses, the number of employer establish- ments grew by 4.2 percent, including growth of 4.2 percent among establishments with less than 500 workers. • Among oil and gas field machinery and equipment manu- facturing businesses, the number of employer establish- ments grew by 33.3 percent, including growth of 33.3 percent among establishments with less than 500 workers. The growth in both jobs and small-midsize employer estab- lishments in the energy sector has been striking in recent years, especially given the abysmal performance of the overall economy. Finally, it must be noted that the Utah energy sector in fact is not all about large companies. As noted in Table 30, each energy sector looked at is overwhelmingly populated by small and midsize establishments. • Among oil and gas extraction businesses, 75.9 percent of employer establishments in 2010 had less than 20 workers, and 100 percent had fewer than 500 employees. • Among drilling oil and gas wells businesses, 75.9 percent of employer establishments in 2010 had less than 20 workers, and 100 percent had fewer than 500 employees. • Among oil and gas operations businesses, 89.2 percent of employer establishments in 2010 had less than 20 workers, and 100 percent had fewer than 500 employees. • Among oil and gas pipeline and related structures con- struction businesses, 64 percent of employer establish- ments in 2010 had less than 20 workers, and 100 percent had fewer than 500 employees. • Among oil and gas field machinery and equipment man- ufacturing establishments, 75 percent of employer estab- lishments in 2010 had less than 20 workers, and 100 percent had fewer than 500 employees.
  • 37. The Benefits of Natural Gas Production and Exports for U.S. Small Businesses | 37 Utah Total Establishments Number of Employees As Percent of Total Firms Total Less 20 Less 500 Less 20 Less 500 2005 65,549 57,040 65,399 87.0% 99.8% 2010 68,820 60,074 68,656 87.3% 99.8% UT 05-10 5.0% 5.3% 5.0% US 05-10 -1.4% -3.5% -3.1% Oil/Gas Extraction Employer Establishments Number of Employees As Percent of Total Firms Total Less 20 Less 500 Less 20 Less 500 2005 56 40 56 71.4% 100% 2010 58 44 58 75.9% 100% Chg 05-10 3.6% 10.0% 3.6% Drilling Oil and Gas Wells Establishments Number of Employees As Percent of Total Firms Total Less 20 Less 500 Less 20 Less 500 2005 37 33 37 89.2% 100% 2010 58 44 58 75.9% 100% Chg 05-10 56.8% 33.3% 56.8% Support for Oil and Gas Operations Establishments Number of Employees As Percent of Total Firms Total Less 20 Less 500 Less 20 Less 500 2005 170 153 170 90.0% 100% 2010 240 214 240 89.2% 100% Chg 05-10 41.2% 39.9% 41.2% Oil and Gas Pipeline and Related Structures Construction Establishments Number of Employees As Percent of Total Firms Total Less 20 Less 500 Less 20 Less 500 2005 24 18 24 75.0% 100% 2010 25 16 25 64.0% 100% Chg 05-10 4.2% -11.1% 4.2% Oil and Gas Field Machinery and Equipment Manufacturing Establishments Number of Employees As Percent of Total Firms Total Less 20 Less 500 Less 20 Less 500 2005 3 3 3 100% 100% 2010 4 3 4 75% 100% Chg 05-10 33.3% 0% 33.3% Table 30: Establishments – Utah Total and Energy Industries, 2005-2010
  • 38. 38 | The Benefits of Natural Gas Production and Exports for U.S. Small Businesses Impact on Jobs Table 32 compares employment growth (all employment and business data from Census Bureau “County Business Patterns” unless otherwise noted) among employer estab- lishments in the overall state, and in various energy indus- try sectors. The key point in the employment story in West Virginia has to do with the energy sector. While West Virginia total employment decreased by 0.9% percent from 2005 to 2010, jobs grew by the following: • 44.2 percent in the oil and gas extraction sector; • 9.4 percent in the drilling oil and gas wells sector; and • 99 percent in the support sector for oil and gas opera- tions. West Virginia employers overall shed 5,049 jobs over this period, yet employers in the energy industries included here (three for which there are data) added 2,028 jobs. XI. West Virginia The increase in natural gas production has been sizeable in West Virginia.The state’s natural gas production, as highlighted in Table 31, expanded by 78.2 percent from 2005 to 2011. Table 31: West Virginia Natural Gas Marketed Production 2005: 221.1 billion cubic feet 2011: 394.1 billion cubic feet Percent Sector 2005 2010 Change Total 565,499 560,450 -0.9% Oil/Gas Extraction 1,806 2,605 44.2% Drilling Oil and Gas Wells 929 1,016 9.4% Support for Oil and Gas Operations 1,154 2,296 99.0% Oil and Gas Pipeline and Related Structures Construction 868 1,000-2,499 NA Oil and Gas Field Machinery and Equipment Manufacturing NA NA NA Table 32: West Virginia Employment Growth Among Employer Establishments, 2005-2010
  • 39. The Benefits of Natural Gas Production and Exports for U.S. Small Businesses | 39 Impact on Small Businesses At the same time, while the number of businesses (in this case, establishments) declined in the nation and in West Virginia overall, the number of establishments grew strongly in West Virginia’s energy sector. And it is critical to note the role and growth of smaller businesses. Table 33 makes clear that expanded production in the energy sector has been a boon for small and midsize enter- prises in the state. Or, to look at it from a different angle, expanded energy production has been driven by small and midsize businesses. For all of the U.S., total employer establishments declined by 1.4 percent from 2005 to 2010, including a 3.5 percent decline in firms with less than 20 workers, and a 3.1 per- cent fall in firms with less than 500 workers. In West Virginia, total establishments declined by 5.0 per- cent, including a 5.5 percent fall among establishments with less than 20 workers, and a 5.0 percent decline among those with less than 500 workers. However, the growth in energy industries in West Virginia were: • Among oil and gas extraction businesses, the number of employer establishments grew by 9.6 percent, including growth of 5.3 percent among establishments with less than 20 workers and 9.6 percent among establishments with less than 500 workers. • Among drilling oil and gas wells businesses, the number of employer establishments grew by 12.5 percent, includ- ing growth of 36.6 percent among establishments with less than 20 workers and 12.5 percent among establish- ments with less than 500 workers. • Among supporting oil and gas operations businesses, the number of employer establishments grew by 48.3 per- cent, including growth of 45.2 percent among establish- ments with less than 20 workers and 48.3 percent among establishments with less than 500 workers. • Among oil and gas pipeline and related structures con- struction businesses, the number of employer establish- ments grew by 14.3 percent, including growth of 30.2 percent among establishments with less than 20 workers, and 14.3 percent among establishments with less than 500 workers. The growth in both jobs and small-midsize employer estab- lishments in the energy sector has been striking in recent years, especially given the abysmal performance of the overall economy. Finally, it must be noted that the West Virginia energy sec- tor in fact is not all about huge enterprises. As noted in Table 33, each energy sector looked at is overwhelmingly populated by small and midsize establishments. • Among oil and gas extraction businesses, 86.9 percent of employer establishments in 2010 had less than 20 workers, and 100 percent had fewer than 500 employees. • Among drilling oil and gas wells businesses, 77.8 percent of employer establishments in 2010 had less than 20 workers, and 100 percent had fewer than 500 employees. • Among oil and gas operations businesses, 82.2 percent of employer establishments in 2010 had less than 20 workers, and 100 percent had fewer than 500 employees. • Among oil and gas pipeline and related structures con- struction businesses, 75 percent of employer establish- ments in 2010 had less than 20 workers, and 100 percent had fewer than 500 employees. • Among oil and gas field machinery and equipment man- ufacturing establishments, 50 percent of employer estab- lishments in 2010 had less than 20 workers, and 100 percent had fewer than 500 employees.
  • 40. 40 | The Benefits of Natural Gas Production and Exports for U.S. Small Businesses West Virginia Total Establishments Number of Employees As Percent of Total Firms Total Less 20 Less 500 Less 20 Less 500 2005 40,735 35,419 40,656 86.9% 99.8% 2010 38,676 33,463 38,604 86.5% 99.8% WV 05-10 -5.0% -5.5% -5.0% US 05-10 -1.4% -3.5% -3.1% Oil/Gas Extraction Employer Establishments Number of Employees As Percent of Total Firms Total Less 20 Less 500 Less 20 Less 500 2005 188 170 188 90.4% 100% 2010 206 179 206 86.9% 100% Chg 05-10 9.6% 5.3% 9.6% Drilling Oil and Gas Wells Establishments Number of Employees As Percent of Total Firms Total Less 20 Less 500 Less 20 Less 500 2005 40 26 40 65.0% 100% 2010 45 35 45 77.8% 100% Chg 05-10 12.5% 36.6% 12.5% Support for Oil and Gas Operations Establishments Number of Employees As Percent of Total Firms Total Less 20 Less 500 Less 20 Less 500 2005 87 73 87 83.9% 100% 2010 129 106 129 82.2% 100% Chg 05-10 48.3% 45.2% 48.3% Oil and Gas Pipeline and Related Structures Construction Establishments Number of Employees As Percent of Total Firms Total Less 20 Less 500 Less 20 Less 500 2005 35 23 35 65.7% 100% 2010 40 30 40 75.0% 100% Chg 05-10 14.3% 30.4% 14.3% Oil and Gas Field Machinery and Equipment Manufacturing Establishments Number of Employees As Percent of Total Firms Total Less 20 Less 500 Less 20 Less 500 2005 4 2 4 50.0% 100% 2010 2 1 2 50.0% 100% Chg 05-10 -50.0% -50.0% -50.0% Table 33: Establishments – West Virginia Total and Energy Industries, 2005-2010
  • 41. The Benefits of Natural Gas Production and Exports for U.S. Small Businesses | 41 Impact on Jobs Table 35 compares employment growth (again, all employ- ment and business data from Census Bureau “County Busi- ness Patterns” unless otherwise noted) among employer establishments in the overall state, and in various energy industry sectors. Employment growth in Wyoming was positive over the period of 2005 to 2010, compared to a decline nationally, with Wyoming’s energy sector showing particularly solid expansion. While Wyoming total employment increased by 6.8% percent from 2005 to 2010, jobs grew by the following: • 34.9 percent in the oil and gas extraction sector; • 35.3 percent in the drilling oil and gas wells sector; • 2.2 percent in the support sector for oil and gas opera- tions; and • 234.9 percent in the oil and gas pipeline and related structures construction sector. Wyoming employers overall added 13,112 jobs over this period, yet employers in the energy industries included here (four for which there are data) added 3,751 jobs. XII. Wyoming The increase in natural gas production has been notable in Wyoming. The state’s natural gas production,as highlighted in Table 34, expanded by 31.7 percent from 2005 to 2011. Table 34: Wyoming Natural Gas Marketed Production 2005: 1,639.3 billion cubic feet 2011: 2,159.4 billion cubic feet Percent Sector 2005 2010 Change Total 191,934 205,046 6.8% Oil/Gas Extraction 2,663 3,592 34.9% Drilling Oil and Gas Wells 3,041 3,604 35.3% Support for Oil and Gas Operations 7,342 7,506 2.2% Oil and Gas Pipeline and Related Structures Construction 892 2,987 234.9% Oil and Gas Field Machinery and Equipment Manufacturing NA 364 NA Table 35: Wyoming Employment Growth Among Employer Establishments, 2005-2010
  • 42. 42 | The Benefits of Natural Gas Production and Exports for U.S. Small Businesses Impact on Small Businesses At the same time, while the number of businesses (in this case, establishments) declined in the nation, the number of establishments grew in Wyoming, including in the energy sector. And it is critical to note the role and growth of smaller businesses. Table 36 makes clear that expanded production in the energy sector has been a boon for small and midsize enter- prises in the state. Or, to look at it from a different angle, expanded energy production has been driven by small and midsize businesses. For all of the U.S., total employer establishments declined by 1.4 percent from 2005 to 2010, including a 3.5 percent decline in firms with less than 20 workers, and a 3.1 per- cent fall in firms with less than 500 workers. In Wyoming, total establishments increased by 2.5 percent, including a 2.6 percent rose among establishments with less than 20 workers, and a 2.5 percent increased among those with less than 500 workers. The growth in energy industries in Wyoming was: • Among drilling oil and gas wells businesses, the number of employer establishments grew by 20.6 percent, includ- ing growth of 19.6 percent among establishments with less than 20 workers and 20.6 percent among establish- ments with less than 500 workers. • Among supporting oil and gas operations businesses, the number of employer establishments grew by 13.6 per- cent, including growth of 13.3 percent among establish- ments with less than 20 workers and 13.9 percent among establishments with less than 500 workers. • Among oil and gas pipeline and related structures con- struction businesses, the number of employer establish- ments grew by 40.7 percent, including growth of 51.3 percent among establishments with less than 20 workers, and 38.9 percent among establishments with less than 500 workers. The growth in both jobs and small-midsize employer estab- lishments in the energy sector has been striking in recent years, especially given the abysmal performance of the overall economy. Finally, it must be noted that the Wyoming energy sector in fact is not all about big businesses. As noted in Table 36, each energy sector looked at is overwhelmingly populated by small and midsize firms. • Among oil and gas extraction businesses, 75.6 percent of employer establishments in 2010 had less than 20 workers, and 100 percent had fewer than 500 employees. • Among drilling oil and gas wells businesses, 75.8 percent of employer establishments in 2010 had less than 20 workers, and 100 percent had fewer than 500 employees. • Among oil and gas operations businesses, 83.5 percent of employer establishments in 2010 had less than 20 workers, and 99.6 percent had fewer than 500 employees. • Among oil and gas pipeline and related structures con- struction businesses, 73.7 percent of employer estab- lishments in 2010 had less than 20 workers, and 98.7 percent had fewer than 500 employees. • Among oil and gas field machinery and equipment man- ufacturing establishments, 45.5 percent of employer establishments in 2010 had less than 20 workers, and 100 percent had fewer than 500 employees.
  • 43. The Benefits of Natural Gas Production and Exports for U.S. Small Businesses | 43 Wyoming Virginia Total Establishments Number of Employees As Percent of Total Firms Total Less 20 Less 500 Less 20 Less 500 2005 19,736 17,804 19,715 90.2% 99.9% 2010 20,231 18,270 20,213 90.3% 99.9% WY 05-10 2.5% 2.6% 2.5% US 05-10 -1.4% -3.5% -3.1% Oil/Gas Extraction Employer Establishments Number of Employees As Percent of Total Firms Total Less 20 Less 500 Less 20 Less 500 2005 205 159 205 77.6% 100% 2010 180 136 180 75.6% 100% Chg 05-10 -12.2% -14.5% -12.2% Drilling Oil and Gas Wells Establishments Number of Employees As Percent of Total Firms Total Less 20 Less 500 Less 20 Less 500 2005 98 81 98 82.7% 100% 2010 128 97 128 75.8% 100% Chg 05-10 20.6% 19.6% 20.6% Support for Oil and Gas Operations Establishments Number of Employees As Percent of Total Firms Total Less 20 Less 500 Less 20 Less 500 2005 412 345 409 83.7% 99.3% 2010 468 391 466 83.5% 99.6% Chg 05-10 13.6% 13.3% 13.9% Oil and Gas Pipeline and Related Structures Construction Establishments Number of Employees As Percent of Total Firms Total Less 20 Less 500 Less 20 Less 500 2005 54 37 54 68.5% 100% 2010 76 56 75 73.7% 98.7% Chg 05-10 40.7% 51.3% 38.9% Oil and Gas Field Machinery and Equipment Manufacturing Establishments Number of Employees As Percent of Total Firms Total Less 20 Less 500 Less 20 Less 500 2005 11 8 11 72.7 100% 2010 11 5 11 45.5% 100% Chg 05-10 0% -37.5% 0% Table 36: Establishments – Wyoming Total and Energy Industries, 2005-2010