SlideShare una empresa de Scribd logo
1 de 1
An Integrated Approach for Subsidence Monitoring and Sinkhole
Formation in the Karst Terrain of Dougherty County, Georgia
Matthew Cahalan1 and Adam Milewski1
1 Department of Geology, University of Georgia, Athens, GA, 30602, USA
Abstract:
The Upper Floridan Aquifer (UFA) is an important water source for agricultural and municipal
purposes in Dougherty County. However, prolonged water demand, dissolution of the carbonate
aquifer (Ocala Limestone), and short and long-term fluctuations in precipitation, surface water
discharge, and groundwater levels have placed many areas at risk for sinkhole formation and
broader scale land deformation (i.e., subsidence) in the covered karst terrain. Evaluating the
causes of sinkhole formation and subsidence is essential for reducing risk within karst settings.
In this study, we evaluate the controlling factors on subsidence feature formation within a 71 mi2
area of southern Dougherty County, Georgia, by applying a sinkhole delineation and regression
analysis procedure. ArcGIS 10.1 software was used to process digital elevation models (DEMs)
from 1999 (10m) and 2011 (1m and resampled 10m) to locate subsidence features that formed
between 1999 and 2011. Different types of subsidence features were delineated based on area
values from the high spatial resolution LiDAR DEM (1m). Results show that small-scale
subsidence features (i.e., cover collapse sinkholes less than 100 m2) form close to streams in
areas with relatively thin overburden thickness. This is most likely due to flooding and
subsequent liquefaction processes transporting overburden material into subsurface voids.
Our conceptual model of subsidence feature controlling factors, or independent variables,
included geologic, topographic, hydrologic, anthropogenic, and hydrogeologic variables.
Regression analysis allows you to examine the influences of various factors driving observed
spatial patterns. Ordinary least squares (OLS) and geographically weighted regression (GWR)
statistical models were applied to the recently formed subsidence features between 1999 and
2011 to determine the factors that are most influential in subsidence feature development.
The OLS global regression tool was applied to examine if we had a properly specified model
with limited biases. OLS results showed that distance to lineaments, elevation, aspect, distance
to roads, and overburden thickness were statistically significant (p-value < 0.05), or the most
influential controlling factors in subsidence feature density. The 11 included independent
variables did not show any redundancy (Variance Inflation Factors < 7.5). Overall, the OLS
model explained 42% of the spatial variation of subsidence feature density (R2 = 0.42).
GWR models, a local form of regression that illustrates how relationships vary across space by
calculating a regression equation for each feature in the study area, were applied. GWR analysis
resulted in a R2 value of 0.70 when 9 of the independent variables were included in the model
(slope, aspect, land use, overburden thickness, distance to lineaments, distance to roads, distance
to surface water features, distance to rivers, and distance to wetlands).
.
Subsidence Feature Delineation and Regression
Procedure
OLS Regression Results
Area of InvestigationObjectives:
1. Apply statistical regression models
(OLS and GWR) to evaluate the
influences of topographic,
hydrologic, geologic,
hydrogeologic, and anthropogenic
variables on subsidence feature
formation.
2. Locate recently formed (1999 –
2011) subsidence features using a
semi-automated mapping procedure.
Acknowledgements
• Randy Weathersby – Albany GIS
• UGA Provost Fund for financial support of the project
Subsidence Feature Density Maps
Fig. 1 – Outlined study area location in
southern Dougherty County, GA (71 mi2).
Fig. 4 – 1999 (10m). Fig. 5 – 2011 (10m).
Fig. 6 – Subsidence features that formed between 1999 and 2011.
Subsidence Feature Types
Fig. 3 - Processing procedure for the 1999 and 2011 digital elevation models (DEMs),
which were used to locate subsidence features and analyze the factors controlling their
development in the covered karst setting of southern Dougherty County, Georgia.
Fig. 9 – Lidar-derived map of subsidence features within study area. Cover subsidence
features are > 100 m2, and cover collapse features are < 100 m2.
Conclusions
The proposed processing procedure was successful at delineating sinkholes temporally and
attributing their formation to various factors spatially. Regression results showed that the
increase in subsidence features between 1999 and 2011 was primarily influenced by geologic
(i.e., distance to lineaments and overburden thickness), topographic (i.e., elevation and
aspect), and anthropogenic (i.e., distance to roads) factors. The cover-collapse features’
distributions along streams is evidence of liquefaction processes occurring in areas with
shallow overburden thickness being a primary control on their formation, while cover
subsidence features form in areas with greater overburden thickness at higher elevations.
Data acquisition
Digital elevation
model
Fill in sinks to spill
level
Digital elevation models,
geology, land use/land cover,
soils, hydrography, fractures,
overburden thickness
Climatic, stream
discharge, well
levels, roads, urban
structures, aerial
imagery
Generate a “fill-
difference” raster
Validate with aerial imagery
and previous subsidence
feature maps
Attribute all variables to subsidence
feature points
Perform ordinary least squares and
geographically weighted regression
analysis
Begin regression procedure on
mapped subsidence features
Create layers for each independent
variable
1. Land use/land cover
2. Overburden thickness
3. Upper Floridan Aquifer
fluctuations
4. Distance to fractures
5. Distance to streams
6. Distance to roads
7. Distance to lakes and
ponds
8. Distance to wetlands
9. Elevation
10. Slope
11. Aspect
Apply threshold filters based
on depth, geometry, area,
and intersection with human
structures
Convert to polygon layer
Calculate subsidence feature point
density (dependent variable)
Subsidence Feature Development
Fig. 2 – Subsidence features can be triggered by flooding events (i.e., liquefaction) and
drought or groundwater withdrawal (i.e., loss of hydrostatic support).
Dobecki and Upchurch, 2006
Category Description Source Method OLS p-value
Elevation NED 10m DEM Raster to polygon 0.016007*
Topography Aspect NED 10m DEM ArcMap Aspect tool 0.049568*
Slope NED 10m DEM ArcMap Slope tool 0.287726
Distance to ponds Georgia GIS Clearinghouse
ArcMap Generate Near Table
tool
0.560277
Hydrology Distance to streams
National Hydrography
Dataset
ArcMap Generate Near Table
tool
0.153236
Distance to wetlands National Wetland Inventory
ArcMap Generate Near Table
tool
0.235599
Distance to lineaments Brook and Allison (1986)
ArcMap Generate Near Table
tool
0.000403*
Overburden thickness
Borehole data and USGS
cross-sections (48 wells)
Empirical Bayesian Kriging
interpolation (RMS = 2.42)
0.000000*
Hydrogeology
Upper Floridan Aquifer
fluctuations
USGS well data (12 wells)
Kriging interpolation (RMS =
3.22)
0.211642
Land use National Land Cover Dataset Raster to polygon 0.339056
Distance to roads Georgia GIS Clearinghouse
ArcMap Generate Near Table
tool
0.001548*
Fig. 8 – Independent variable descriptions. Statistically significant variables (p-values < 0.05)
are in bold.
Independent Variables
Fig. 7 – Maps of independent variables used in the ordinary least squares and
geographically weighted regression models.
Geology
Anthropogenic
G
e
o
l
o
g
y
H
y
d
r
o
l
o
g
y
A
n
t
h
r
o
H
y
d
r
o
g
e
o
l
o
g
y
Density (features/km2)

Más contenido relacionado

La actualidad más candente

20160602 Non-Invasive Geophysical Techniques
20160602 Non-Invasive Geophysical Techniques20160602 Non-Invasive Geophysical Techniques
20160602 Non-Invasive Geophysical Techniques
Sam Setchell
 
2D MASW ANALYSIS FOR GEOTECHNICAL ENGINEERING
2D MASW ANALYSIS FOR GEOTECHNICAL ENGINEERING2D MASW ANALYSIS FOR GEOTECHNICAL ENGINEERING
2D MASW ANALYSIS FOR GEOTECHNICAL ENGINEERING
Ali Osman Öncel
 
ESTIMATION OF SOIL ERODIBILITY AND RAINFALL EROSIVITY FOR THE BIEMSO BASIN, G...
ESTIMATION OF SOIL ERODIBILITY AND RAINFALL EROSIVITY FOR THE BIEMSO BASIN, G...ESTIMATION OF SOIL ERODIBILITY AND RAINFALL EROSIVITY FOR THE BIEMSO BASIN, G...
ESTIMATION OF SOIL ERODIBILITY AND RAINFALL EROSIVITY FOR THE BIEMSO BASIN, G...
Eric Takyi Atakora , Ph.D (candidate)
 

La actualidad más candente (19)

Limitations of simplified methods for estimating seismic settlements 12d
Limitations of simplified methods for estimating seismic settlements 12dLimitations of simplified methods for estimating seismic settlements 12d
Limitations of simplified methods for estimating seismic settlements 12d
 
S24 naldi
S24 naldiS24 naldi
S24 naldi
 
3 d seismic method for reservoir geothermal exploration n assessment
3 d seismic method for reservoir geothermal exploration n assessment3 d seismic method for reservoir geothermal exploration n assessment
3 d seismic method for reservoir geothermal exploration n assessment
 
gis in natural disaster management geo hazards
gis in natural disaster management  geo hazardsgis in natural disaster management  geo hazards
gis in natural disaster management geo hazards
 
Limitations of vs30 etc.
Limitations of vs30 etc. Limitations of vs30 etc.
Limitations of vs30 etc.
 
WCEE2012_1941
WCEE2012_1941WCEE2012_1941
WCEE2012_1941
 
Geophysical survey for the risk management
Geophysical survey for the risk managementGeophysical survey for the risk management
Geophysical survey for the risk management
 
20160602 Non-Invasive Geophysical Techniques
20160602 Non-Invasive Geophysical Techniques20160602 Non-Invasive Geophysical Techniques
20160602 Non-Invasive Geophysical Techniques
 
Limitations of vs30 etc.
Limitations of vs30 etc. Limitations of vs30 etc.
Limitations of vs30 etc.
 
Improved analysis of potential lateral spreading displacements
Improved analysis of potential lateral spreading displacementsImproved analysis of potential lateral spreading displacements
Improved analysis of potential lateral spreading displacements
 
Pyke paper for asce lifelines conference 2021 22
Pyke paper for asce lifelines conference 2021 22Pyke paper for asce lifelines conference 2021 22
Pyke paper for asce lifelines conference 2021 22
 
Shoemaker impact structure
Shoemaker impact structureShoemaker impact structure
Shoemaker impact structure
 
E05833135
E05833135E05833135
E05833135
 
2D MASW ANALYSIS FOR GEOTECHNICAL ENGINEERING
2D MASW ANALYSIS FOR GEOTECHNICAL ENGINEERING2D MASW ANALYSIS FOR GEOTECHNICAL ENGINEERING
2D MASW ANALYSIS FOR GEOTECHNICAL ENGINEERING
 
ESTIMATION OF SOIL ERODIBILITY AND RAINFALL EROSIVITY FOR THE BIEMSO BASIN, G...
ESTIMATION OF SOIL ERODIBILITY AND RAINFALL EROSIVITY FOR THE BIEMSO BASIN, G...ESTIMATION OF SOIL ERODIBILITY AND RAINFALL EROSIVITY FOR THE BIEMSO BASIN, G...
ESTIMATION OF SOIL ERODIBILITY AND RAINFALL EROSIVITY FOR THE BIEMSO BASIN, G...
 
Geological Subsurface Maps
Geological Subsurface MapsGeological Subsurface Maps
Geological Subsurface Maps
 
Romero ruiz-et-al
Romero ruiz-et-alRomero ruiz-et-al
Romero ruiz-et-al
 
Dynamic behaviour of double and triple adjacent 2D hills using boundary eleme...
Dynamic behaviour of double and triple adjacent 2D hills using boundary eleme...Dynamic behaviour of double and triple adjacent 2D hills using boundary eleme...
Dynamic behaviour of double and triple adjacent 2D hills using boundary eleme...
 
M6.0 2004 Parkfield Earthquake : Seismic Attenuation
M6.0 2004 Parkfield Earthquake : Seismic AttenuationM6.0 2004 Parkfield Earthquake : Seismic Attenuation
M6.0 2004 Parkfield Earthquake : Seismic Attenuation
 

Destacado (13)

Expert Report on Geologic Hazards in the Karst Regions of Virginia and West V...
Expert Report on Geologic Hazards in the Karst Regions of Virginia and West V...Expert Report on Geologic Hazards in the Karst Regions of Virginia and West V...
Expert Report on Geologic Hazards in the Karst Regions of Virginia and West V...
 
Sinkholes pics
Sinkholes picsSinkholes pics
Sinkholes pics
 
The National Corvette Museum Sinkhole Coverup
The National Corvette Museum Sinkhole CoverupThe National Corvette Museum Sinkhole Coverup
The National Corvette Museum Sinkhole Coverup
 
Matu 11 limestone features 1
Matu 11 limestone features 1Matu 11 limestone features 1
Matu 11 limestone features 1
 
Using LiDAR to Map Sinkholes (EPAN09)
Using LiDAR to Map Sinkholes (EPAN09)Using LiDAR to Map Sinkholes (EPAN09)
Using LiDAR to Map Sinkholes (EPAN09)
 
Weathering and Erosion for Class
Weathering and Erosion for ClassWeathering and Erosion for Class
Weathering and Erosion for Class
 
16
1616
16
 
Karst
KarstKarst
Karst
 
Karst
KarstKarst
Karst
 
Underground Limestone Features
Underground Limestone FeaturesUnderground Limestone Features
Underground Limestone Features
 
Limestone Landscapes
Limestone LandscapesLimestone Landscapes
Limestone Landscapes
 
Karst Topography
Karst TopographyKarst Topography
Karst Topography
 
Karst topography
Karst topographyKarst topography
Karst topography
 

Similar a Matthew Cahalan Georgia Water Resources Conference Presentation

Geohydrological study of weathered basement aquifers in Oban Massif and envir...
Geohydrological study of weathered basement aquifers in Oban Massif and envir...Geohydrological study of weathered basement aquifers in Oban Massif and envir...
Geohydrological study of weathered basement aquifers in Oban Massif and envir...
iosrjce
 
Evaluation of morphometric parameters derived from Cartosat-1 DEM using remot...
Evaluation of morphometric parameters derived from Cartosat-1 DEM using remot...Evaluation of morphometric parameters derived from Cartosat-1 DEM using remot...
Evaluation of morphometric parameters derived from Cartosat-1 DEM using remot...
Dr Ramesh Dikpal
 
2. VULNERABILITY ASSESSMENT OF SOIL EROSION USING GEOSPATIAL TECHNIQUES
2. VULNERABILITY ASSESSMENT OF SOIL EROSION USING GEOSPATIAL TECHNIQUES2. VULNERABILITY ASSESSMENT OF SOIL EROSION USING GEOSPATIAL TECHNIQUES
2. VULNERABILITY ASSESSMENT OF SOIL EROSION USING GEOSPATIAL TECHNIQUES
Dr. Ravinder Jangra
 
Heritage hetherington lidar_pdf[1]
Heritage hetherington lidar_pdf[1]Heritage hetherington lidar_pdf[1]
Heritage hetherington lidar_pdf[1]
llica
 
Birr - Identifying Critical Portions of the Landscape
Birr - Identifying Critical Portions of the LandscapeBirr - Identifying Critical Portions of the Landscape
Birr - Identifying Critical Portions of the Landscape
Jose A. Hernandez
 

Similar a Matthew Cahalan Georgia Water Resources Conference Presentation (20)

soil erosion modelling by RUSLE
soil erosion modelling by RUSLEsoil erosion modelling by RUSLE
soil erosion modelling by RUSLE
 
Geohydrological study of weathered basement aquifers in Oban Massif and envir...
Geohydrological study of weathered basement aquifers in Oban Massif and envir...Geohydrological study of weathered basement aquifers in Oban Massif and envir...
Geohydrological study of weathered basement aquifers in Oban Massif and envir...
 
Evaluation of morphometric parameters derived from Cartosat-1 DEM using remot...
Evaluation of morphometric parameters derived from Cartosat-1 DEM using remot...Evaluation of morphometric parameters derived from Cartosat-1 DEM using remot...
Evaluation of morphometric parameters derived from Cartosat-1 DEM using remot...
 
Newman_GIS poster
Newman_GIS posterNewman_GIS poster
Newman_GIS poster
 
2. VULNERABILITY ASSESSMENT OF SOIL EROSION USING GEOSPATIAL TECHNIQUES
2. VULNERABILITY ASSESSMENT OF SOIL EROSION USING GEOSPATIAL TECHNIQUES2. VULNERABILITY ASSESSMENT OF SOIL EROSION USING GEOSPATIAL TECHNIQUES
2. VULNERABILITY ASSESSMENT OF SOIL EROSION USING GEOSPATIAL TECHNIQUES
 
StreamFlow Variability of 21 Watersheds, Oregon
StreamFlow Variability of 21 Watersheds, OregonStreamFlow Variability of 21 Watersheds, Oregon
StreamFlow Variability of 21 Watersheds, Oregon
 
Heritage hetherington lidar_pdf[1]
Heritage hetherington lidar_pdf[1]Heritage hetherington lidar_pdf[1]
Heritage hetherington lidar_pdf[1]
 
identification of ground water potential zones using gis and remote sensing
identification of ground water potential zones using gis and remote sensingidentification of ground water potential zones using gis and remote sensing
identification of ground water potential zones using gis and remote sensing
 
Rs and gis
Rs and gisRs and gis
Rs and gis
 
Birr - Identifying Critical Portions of the Landscape
Birr - Identifying Critical Portions of the LandscapeBirr - Identifying Critical Portions of the Landscape
Birr - Identifying Critical Portions of the Landscape
 
Hazard Mapping of Landslide Vulnerable Zones in a Rainfed Region of Southern ...
Hazard Mapping of Landslide Vulnerable Zones in a Rainfed Region of Southern ...Hazard Mapping of Landslide Vulnerable Zones in a Rainfed Region of Southern ...
Hazard Mapping of Landslide Vulnerable Zones in a Rainfed Region of Southern ...
 
Goiul.ppt
Goiul.pptGoiul.ppt
Goiul.ppt
 
GEOtop Sisef presentation
GEOtop Sisef presentationGEOtop Sisef presentation
GEOtop Sisef presentation
 
Application of GIS in Mine Contamination and Associated Environmental Impacts
Application of GIS in Mine Contamination and Associated Environmental ImpactsApplication of GIS in Mine Contamination and Associated Environmental Impacts
Application of GIS in Mine Contamination and Associated Environmental Impacts
 
Models erosion as methodical basis combating its manifestations in Ukraine
Models erosion as methodical basis combating its manifestations in UkraineModels erosion as methodical basis combating its manifestations in Ukraine
Models erosion as methodical basis combating its manifestations in Ukraine
 
Spatial variation in surface runoff at catchment scale, the case study of adi...
Spatial variation in surface runoff at catchment scale, the case study of adi...Spatial variation in surface runoff at catchment scale, the case study of adi...
Spatial variation in surface runoff at catchment scale, the case study of adi...
 
IRJET- Predicting Piping Erosion Susceptibility by Statistical and Artificial...
IRJET- Predicting Piping Erosion Susceptibility by Statistical and Artificial...IRJET- Predicting Piping Erosion Susceptibility by Statistical and Artificial...
IRJET- Predicting Piping Erosion Susceptibility by Statistical and Artificial...
 
Topographic attributes control groundwater flow and groundwater
Topographic attributes control groundwater flow and groundwaterTopographic attributes control groundwater flow and groundwater
Topographic attributes control groundwater flow and groundwater
 
Geomatics Based Landslide Vulnerability Zonation Mapping - Parts Of Nilgiri D...
Geomatics Based Landslide Vulnerability Zonation Mapping - Parts Of Nilgiri D...Geomatics Based Landslide Vulnerability Zonation Mapping - Parts Of Nilgiri D...
Geomatics Based Landslide Vulnerability Zonation Mapping - Parts Of Nilgiri D...
 
Modelling soil processes
Modelling soil processesModelling soil processes
Modelling soil processes
 

Último

Introduction,importance and scope of horticulture.pptx
Introduction,importance and scope of horticulture.pptxIntroduction,importance and scope of horticulture.pptx
Introduction,importance and scope of horticulture.pptx
Bhagirath Gogikar
 
SCIENCE-4-QUARTER4-WEEK-4-PPT-1 (1).pptx
SCIENCE-4-QUARTER4-WEEK-4-PPT-1 (1).pptxSCIENCE-4-QUARTER4-WEEK-4-PPT-1 (1).pptx
SCIENCE-4-QUARTER4-WEEK-4-PPT-1 (1).pptx
RizalinePalanog2
 
Chemical Tests; flame test, positive and negative ions test Edexcel Internati...
Chemical Tests; flame test, positive and negative ions test Edexcel Internati...Chemical Tests; flame test, positive and negative ions test Edexcel Internati...
Chemical Tests; flame test, positive and negative ions test Edexcel Internati...
ssuser79fe74
 
Pests of cotton_Sucking_Pests_Dr.UPR.pdf
Pests of cotton_Sucking_Pests_Dr.UPR.pdfPests of cotton_Sucking_Pests_Dr.UPR.pdf
Pests of cotton_Sucking_Pests_Dr.UPR.pdf
PirithiRaju
 
Pests of mustard_Identification_Management_Dr.UPR.pdf
Pests of mustard_Identification_Management_Dr.UPR.pdfPests of mustard_Identification_Management_Dr.UPR.pdf
Pests of mustard_Identification_Management_Dr.UPR.pdf
PirithiRaju
 
Seismic Method Estimate velocity from seismic data.pptx
Seismic Method Estimate velocity from seismic  data.pptxSeismic Method Estimate velocity from seismic  data.pptx
Seismic Method Estimate velocity from seismic data.pptx
AlMamun560346
 

Último (20)

Zoology 5th semester notes( Sumit_yadav).pdf
Zoology 5th semester notes( Sumit_yadav).pdfZoology 5th semester notes( Sumit_yadav).pdf
Zoology 5th semester notes( Sumit_yadav).pdf
 
Introduction,importance and scope of horticulture.pptx
Introduction,importance and scope of horticulture.pptxIntroduction,importance and scope of horticulture.pptx
Introduction,importance and scope of horticulture.pptx
 
IDENTIFICATION OF THE LIVING- forensic medicine
IDENTIFICATION OF THE LIVING- forensic medicineIDENTIFICATION OF THE LIVING- forensic medicine
IDENTIFICATION OF THE LIVING- forensic medicine
 
STS-UNIT 4 CLIMATE CHANGE POWERPOINT PRESENTATION
STS-UNIT 4 CLIMATE CHANGE POWERPOINT PRESENTATIONSTS-UNIT 4 CLIMATE CHANGE POWERPOINT PRESENTATION
STS-UNIT 4 CLIMATE CHANGE POWERPOINT PRESENTATION
 
SCIENCE-4-QUARTER4-WEEK-4-PPT-1 (1).pptx
SCIENCE-4-QUARTER4-WEEK-4-PPT-1 (1).pptxSCIENCE-4-QUARTER4-WEEK-4-PPT-1 (1).pptx
SCIENCE-4-QUARTER4-WEEK-4-PPT-1 (1).pptx
 
Chemical Tests; flame test, positive and negative ions test Edexcel Internati...
Chemical Tests; flame test, positive and negative ions test Edexcel Internati...Chemical Tests; flame test, positive and negative ions test Edexcel Internati...
Chemical Tests; flame test, positive and negative ions test Edexcel Internati...
 
9999266834 Call Girls In Noida Sector 22 (Delhi) Call Girl Service
9999266834 Call Girls In Noida Sector 22 (Delhi) Call Girl Service9999266834 Call Girls In Noida Sector 22 (Delhi) Call Girl Service
9999266834 Call Girls In Noida Sector 22 (Delhi) Call Girl Service
 
COST ESTIMATION FOR A RESEARCH PROJECT.pptx
COST ESTIMATION FOR A RESEARCH PROJECT.pptxCOST ESTIMATION FOR A RESEARCH PROJECT.pptx
COST ESTIMATION FOR A RESEARCH PROJECT.pptx
 
Kochi ❤CALL GIRL 84099*07087 ❤CALL GIRLS IN Kochi ESCORT SERVICE❤CALL GIRL
Kochi ❤CALL GIRL 84099*07087 ❤CALL GIRLS IN Kochi ESCORT SERVICE❤CALL GIRLKochi ❤CALL GIRL 84099*07087 ❤CALL GIRLS IN Kochi ESCORT SERVICE❤CALL GIRL
Kochi ❤CALL GIRL 84099*07087 ❤CALL GIRLS IN Kochi ESCORT SERVICE❤CALL GIRL
 
SAMASTIPUR CALL GIRL 7857803690 LOW PRICE ESCORT SERVICE
SAMASTIPUR CALL GIRL 7857803690  LOW PRICE  ESCORT SERVICESAMASTIPUR CALL GIRL 7857803690  LOW PRICE  ESCORT SERVICE
SAMASTIPUR CALL GIRL 7857803690 LOW PRICE ESCORT SERVICE
 
Pests of cotton_Sucking_Pests_Dr.UPR.pdf
Pests of cotton_Sucking_Pests_Dr.UPR.pdfPests of cotton_Sucking_Pests_Dr.UPR.pdf
Pests of cotton_Sucking_Pests_Dr.UPR.pdf
 
Pests of mustard_Identification_Management_Dr.UPR.pdf
Pests of mustard_Identification_Management_Dr.UPR.pdfPests of mustard_Identification_Management_Dr.UPR.pdf
Pests of mustard_Identification_Management_Dr.UPR.pdf
 
Proteomics: types, protein profiling steps etc.
Proteomics: types, protein profiling steps etc.Proteomics: types, protein profiling steps etc.
Proteomics: types, protein profiling steps etc.
 
9654467111 Call Girls In Raj Nagar Delhi Short 1500 Night 6000
9654467111 Call Girls In Raj Nagar Delhi Short 1500 Night 60009654467111 Call Girls In Raj Nagar Delhi Short 1500 Night 6000
9654467111 Call Girls In Raj Nagar Delhi Short 1500 Night 6000
 
GBSN - Biochemistry (Unit 1)
GBSN - Biochemistry (Unit 1)GBSN - Biochemistry (Unit 1)
GBSN - Biochemistry (Unit 1)
 
Unit5-Cloud.pptx for lpu course cse121 o
Unit5-Cloud.pptx for lpu course cse121 oUnit5-Cloud.pptx for lpu course cse121 o
Unit5-Cloud.pptx for lpu course cse121 o
 
CELL -Structural and Functional unit of life.pdf
CELL -Structural and Functional unit of life.pdfCELL -Structural and Functional unit of life.pdf
CELL -Structural and Functional unit of life.pdf
 
Seismic Method Estimate velocity from seismic data.pptx
Seismic Method Estimate velocity from seismic  data.pptxSeismic Method Estimate velocity from seismic  data.pptx
Seismic Method Estimate velocity from seismic data.pptx
 
High Class Escorts in Hyderabad ₹7.5k Pick Up & Drop With Cash Payment 969456...
High Class Escorts in Hyderabad ₹7.5k Pick Up & Drop With Cash Payment 969456...High Class Escorts in Hyderabad ₹7.5k Pick Up & Drop With Cash Payment 969456...
High Class Escorts in Hyderabad ₹7.5k Pick Up & Drop With Cash Payment 969456...
 
❤Jammu Kashmir Call Girls 8617697112 Personal Whatsapp Number 💦✅.
❤Jammu Kashmir Call Girls 8617697112 Personal Whatsapp Number 💦✅.❤Jammu Kashmir Call Girls 8617697112 Personal Whatsapp Number 💦✅.
❤Jammu Kashmir Call Girls 8617697112 Personal Whatsapp Number 💦✅.
 

Matthew Cahalan Georgia Water Resources Conference Presentation

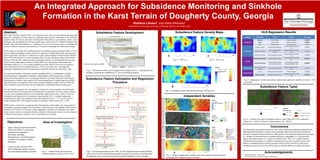
  • 1. An Integrated Approach for Subsidence Monitoring and Sinkhole Formation in the Karst Terrain of Dougherty County, Georgia Matthew Cahalan1 and Adam Milewski1 1 Department of Geology, University of Georgia, Athens, GA, 30602, USA Abstract: The Upper Floridan Aquifer (UFA) is an important water source for agricultural and municipal purposes in Dougherty County. However, prolonged water demand, dissolution of the carbonate aquifer (Ocala Limestone), and short and long-term fluctuations in precipitation, surface water discharge, and groundwater levels have placed many areas at risk for sinkhole formation and broader scale land deformation (i.e., subsidence) in the covered karst terrain. Evaluating the causes of sinkhole formation and subsidence is essential for reducing risk within karst settings. In this study, we evaluate the controlling factors on subsidence feature formation within a 71 mi2 area of southern Dougherty County, Georgia, by applying a sinkhole delineation and regression analysis procedure. ArcGIS 10.1 software was used to process digital elevation models (DEMs) from 1999 (10m) and 2011 (1m and resampled 10m) to locate subsidence features that formed between 1999 and 2011. Different types of subsidence features were delineated based on area values from the high spatial resolution LiDAR DEM (1m). Results show that small-scale subsidence features (i.e., cover collapse sinkholes less than 100 m2) form close to streams in areas with relatively thin overburden thickness. This is most likely due to flooding and subsequent liquefaction processes transporting overburden material into subsurface voids. Our conceptual model of subsidence feature controlling factors, or independent variables, included geologic, topographic, hydrologic, anthropogenic, and hydrogeologic variables. Regression analysis allows you to examine the influences of various factors driving observed spatial patterns. Ordinary least squares (OLS) and geographically weighted regression (GWR) statistical models were applied to the recently formed subsidence features between 1999 and 2011 to determine the factors that are most influential in subsidence feature development. The OLS global regression tool was applied to examine if we had a properly specified model with limited biases. OLS results showed that distance to lineaments, elevation, aspect, distance to roads, and overburden thickness were statistically significant (p-value < 0.05), or the most influential controlling factors in subsidence feature density. The 11 included independent variables did not show any redundancy (Variance Inflation Factors < 7.5). Overall, the OLS model explained 42% of the spatial variation of subsidence feature density (R2 = 0.42). GWR models, a local form of regression that illustrates how relationships vary across space by calculating a regression equation for each feature in the study area, were applied. GWR analysis resulted in a R2 value of 0.70 when 9 of the independent variables were included in the model (slope, aspect, land use, overburden thickness, distance to lineaments, distance to roads, distance to surface water features, distance to rivers, and distance to wetlands). . Subsidence Feature Delineation and Regression Procedure OLS Regression Results Area of InvestigationObjectives: 1. Apply statistical regression models (OLS and GWR) to evaluate the influences of topographic, hydrologic, geologic, hydrogeologic, and anthropogenic variables on subsidence feature formation. 2. Locate recently formed (1999 – 2011) subsidence features using a semi-automated mapping procedure. Acknowledgements • Randy Weathersby – Albany GIS • UGA Provost Fund for financial support of the project Subsidence Feature Density Maps Fig. 1 – Outlined study area location in southern Dougherty County, GA (71 mi2). Fig. 4 – 1999 (10m). Fig. 5 – 2011 (10m). Fig. 6 – Subsidence features that formed between 1999 and 2011. Subsidence Feature Types Fig. 3 - Processing procedure for the 1999 and 2011 digital elevation models (DEMs), which were used to locate subsidence features and analyze the factors controlling their development in the covered karst setting of southern Dougherty County, Georgia. Fig. 9 – Lidar-derived map of subsidence features within study area. Cover subsidence features are > 100 m2, and cover collapse features are < 100 m2. Conclusions The proposed processing procedure was successful at delineating sinkholes temporally and attributing their formation to various factors spatially. Regression results showed that the increase in subsidence features between 1999 and 2011 was primarily influenced by geologic (i.e., distance to lineaments and overburden thickness), topographic (i.e., elevation and aspect), and anthropogenic (i.e., distance to roads) factors. The cover-collapse features’ distributions along streams is evidence of liquefaction processes occurring in areas with shallow overburden thickness being a primary control on their formation, while cover subsidence features form in areas with greater overburden thickness at higher elevations. Data acquisition Digital elevation model Fill in sinks to spill level Digital elevation models, geology, land use/land cover, soils, hydrography, fractures, overburden thickness Climatic, stream discharge, well levels, roads, urban structures, aerial imagery Generate a “fill- difference” raster Validate with aerial imagery and previous subsidence feature maps Attribute all variables to subsidence feature points Perform ordinary least squares and geographically weighted regression analysis Begin regression procedure on mapped subsidence features Create layers for each independent variable 1. Land use/land cover 2. Overburden thickness 3. Upper Floridan Aquifer fluctuations 4. Distance to fractures 5. Distance to streams 6. Distance to roads 7. Distance to lakes and ponds 8. Distance to wetlands 9. Elevation 10. Slope 11. Aspect Apply threshold filters based on depth, geometry, area, and intersection with human structures Convert to polygon layer Calculate subsidence feature point density (dependent variable) Subsidence Feature Development Fig. 2 – Subsidence features can be triggered by flooding events (i.e., liquefaction) and drought or groundwater withdrawal (i.e., loss of hydrostatic support). Dobecki and Upchurch, 2006 Category Description Source Method OLS p-value Elevation NED 10m DEM Raster to polygon 0.016007* Topography Aspect NED 10m DEM ArcMap Aspect tool 0.049568* Slope NED 10m DEM ArcMap Slope tool 0.287726 Distance to ponds Georgia GIS Clearinghouse ArcMap Generate Near Table tool 0.560277 Hydrology Distance to streams National Hydrography Dataset ArcMap Generate Near Table tool 0.153236 Distance to wetlands National Wetland Inventory ArcMap Generate Near Table tool 0.235599 Distance to lineaments Brook and Allison (1986) ArcMap Generate Near Table tool 0.000403* Overburden thickness Borehole data and USGS cross-sections (48 wells) Empirical Bayesian Kriging interpolation (RMS = 2.42) 0.000000* Hydrogeology Upper Floridan Aquifer fluctuations USGS well data (12 wells) Kriging interpolation (RMS = 3.22) 0.211642 Land use National Land Cover Dataset Raster to polygon 0.339056 Distance to roads Georgia GIS Clearinghouse ArcMap Generate Near Table tool 0.001548* Fig. 8 – Independent variable descriptions. Statistically significant variables (p-values < 0.05) are in bold. Independent Variables Fig. 7 – Maps of independent variables used in the ordinary least squares and geographically weighted regression models. Geology Anthropogenic G e o l o g y H y d r o l o g y A n t h r o H y d r o g e o l o g y Density (features/km2)