Global flows in a digital age: How trade, finance, people, and data connect the world economy
•
13 recomendaciones•7,924 vistas

One in three goods crosses national borders, and more than one-third of financial investments are international transactions. In the next decade, global flows could triple, powered by rising prosperity and participation in the emerging world and by the spread of the Internet and digital technologies. In a new McKinsey Global Institute (MGI) report, "Global flows in a digital age: How trade, finance, people, and data connect the world economy," scenarios show that global flows could reach $54 trillion to $85 trillion by 2025. Click to learn more, including a slideshow tracking the expanding network, a podcast with MGI authors, and a download of the full report. http://bit.ly/GlobalFlows

Recomendados
Recomendados
Más contenido relacionado
Destacado
Destacado (18)
Más de McKinsey & Company
Más de McKinsey & Company (20)
Último
Último (20)
Global flows in a digital age: How trade, finance, people, and data connect the world economy
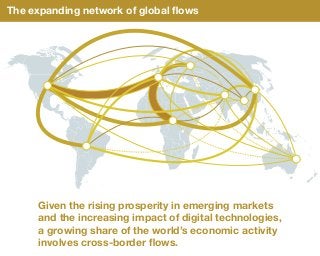
- 1. The expanding network of global flows Given the rising prosperity in emerging markets and the increasing impact of digital technologies, a growing share of the world’s economic activity involves cross-border flows.
- 2. 0.02–0.05 0.05–0.10 0.10–0.25 0.25–0.50 0.50–1.00 >1.00 % of global GDPFlow of goods Flow of services Flow of finance Flow of people Flow of data and communication 100% = $1.8 trillion United States and Canada Eastern Europe and Central Asia Africa and Middle East Australasia China region Other Asia Northeast Asia Western Europe Latin America Source: UN Comtrade; IMF Balance of Payments; World Development Indicators, World Bank; McKinsey Global Institute analysis Flow of goods in 1980
- 3. 0.02–0.05 0.05–0.10 0.10–0.25 0.25–0.50 0.50–1.00 >1.00 % of global GDP 100% = $17.2 trillion Flow of goods in 2011 Flow of goods Flow of services Flow of people Flow of data and communication Source: UN Comtrade; IMF Balance of Payments; World Development Indicators, World Bank; McKinsey Global Institute analysis Flow of finance 10x increase since 1980 United States and Canada Eastern Europe and Central Asia Africa and Middle East Australasia China region Other Asia Northeast Asia Western Europe Latin America
- 4. 0.02–0.05 0.05–0.10 0.10–0.25 0.25–0.50 0.50–1.00 >1.00 % of global GDP 100% = $1.5 trillion1 United States and Canada Eastern Europe and Central Asia Africa and Middle East Australasia China region Other Asia Northeast Asia Western Europe Latin America Flow of services in 2001 Flow of goods Flow of services Flow of people Flow of data and communication 1 Estimated based on 55% coverage with a bilateral data set. Source: UN Comtrade; IMF Balance of Payments; World Development Indicators, World Bank; McKinsey Global Institute analysis Flow of finance
- 5. 1 Estimated based on 61% coverage with a bilateral data set. Source: UN Comtrade; IMF Balance of Payments; World Development Indicators, World Bank; McKinsey Global Institute analysis 0.02–0.05 0.05–0.10 0.10–0.25 0.25–0.50 0.50–1.00 >1.00 % of global GDP 100% = $4.1 trillion1 United States and Canada Eastern Europe and Central Asia Africa and Middle East Australasia China region Other Asia Northeast Asia Western Europe Latin America Flow of services in 2011 Flow of goods Flow of services Flow of people Flow of data and communication Flow of finance 3x increase since 2001
- 6. 0.02–0.05 0.05–0.10 0.10–0.25 0.25–0.50 0.50–1.00 >1.00 % of global GDP 100% = $2.5 trillion United States and Canada Eastern Europe and Central Asia Africa and Middle East Australasia China region Other Asia Northeast Asia Western Europe Latin America Source: UN Comtrade; IMF Balance of Payments; World Development Indicators, World Bank; McKinsey Global Institute analysis Flow of finance in 2002 Flow of goods Flow of services Flow of people Flow of data and communication Flow of finance
- 7. United States and Canada Eastern Europe and Central Asia Africa and Middle East Australasia China region Other Asia Northeast Asia Western Europe Latin America 0.02–0.05 0.05–0.10 0.10–0.25 0.25–0.50 0.50–1.00 >1.00 % of global GDP 100% = $3.9 trillion Flow of finance in 2012 Source: UN Comtrade; IMF Balance of Payments; World Development Indicators, World Bank; McKinsey Global Institute analysis Flow of goods Flow of services Flow of people Flow of data and communication Flow of finance 1.5x increase since 2002
- 8. <1 1–5 5–10 10–50 >50 Millions of foreign travelers Total = 833 million United States and Canada Eastern Europe and Central Asia Africa and Middle East Australasia China region Other Asia Northeast Asia Western Europe Latin America Total international travelers Flow of people in 2002 Flow of goods Flow of services Flow of people Flow of data and communication Source: TeleGeography; World Trade Organization; McKinsey Global Institute analysis Flow of finance
- 9. United States and Canada Eastern Europe and Central Asia Africa and Middle East Australasia China region Other Asia Northeast Asia Western Europe Latin America <1 1–5 5–10 10–50 >50 Millions of foreign travelers Total = 1,100 million Total international travelers Flow of people in 2010 Source: TeleGeography; World Trade Organization; McKinsey Global Institute analysis Flow of goods Flow of services Flow of people Flow of data and communication Flow of finance 1.3x increase since 2002
- 10. <50,000 50,000–100,000 100,000–500,000 500,000–1 million 1–5 million >5 million Bandwidth, Megabits per second (Mbps) Total = 29 million Mbps United States and Canada Eastern Europe and Central Asia Africa and Middle East Australasia China region Other Asia Northeast Asia Western Europe Latin America Source: TeleGeography; World Trade Organization; McKinsey Global Institute analysis Flow of data and communication in 2008 Flow of goods Flow of services Flow of people Flow of data and communication Total cross-border bandwidth Flow of finance
- 11. Total cross-border bandwidth <50,000 50,000–100,000 100,000–500,000 500,000–1 million 1–5 million >5 million Bandwidth, Megabits per second (Mbps) Total = 201 million Mbps Flow of data and communication in 2013 Source: TeleGeography; World Trade Organization; McKinsey Global Institute analysis Flow of goods Flow of services Flow of people Flow of data and communication Flow of finance 7x increase since 2008 United States and Canada Eastern Europe and Central Asia Africa and Middle East Australasia China region Other Asia Northeast Asia Western Europe Latin America