National’s view on evidence-based assessment of the Sendai Indicators‒ Norway (Mia Ebeltoft, Finance Norway)
•
1 recomendación•263 vistas

Presentation made at the expert meeting organised jointly by the European Commission, the OECD and the project PLACARD, in Paris 26th -28th October 2016. For more information see www.oecd.org/gov/risk/joint-expert-meeting-on-disaster-loss-data.htm
![www.financenorway.com2
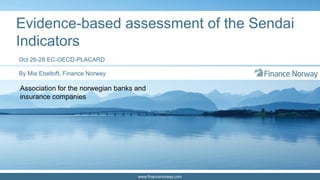
Suggested global indicators
Target A Target B Target C Target D
A1- Number of deaths and
missing due to hazardous
events per 100,000
B1- Number of affected people per 100,000
C1- Direct economic loss due to hazardous events in relation to global gross domestic
product
D1- Damage to critical infrastructure due to hazardous
events
(A-2 + A-3) (sum of B-2 to B-6) (sum of C-2 to C-7) (sum of D-2 to D-5)
A-2Numberofdeaths
A-3Numberofmissing
B-2-Injuredorill
B-3a–Numberofevacuated
B-3b-Numberofrelocated
B-4-Numberofpeoplewhosehouses
weredamaged
B-5-Numberofpeoplewhosehouses
weredestroyed
B-6-Numberofpeoplewhoreceivedfood
reliefaid
C-2-Directagriculturalloss
C-3-Directeconomiclossdueto
industrialfacilitiesdamagedordestroyed
C-4-Directeconomiclossdueto
commercialfacilitiesdamagedor
destroyed
C-5-Directeconomiclossduetohouses
damaged
C-6-Directeconomiclossduetohouses
destroyed
C-7-Directeconomiclossduetodamage
tocriticalinfrastructurecausedby
hazardousevents
D-2-Numberofhealthfacilitiesdestroyed
ordamaged
D-3-Numberofeducationalfacilities
destroyedordamaged
D-4-Numberoftransportation
infrastructuresdestroyedordamaged
D-5-Numberoftimebasicserviceshave
beendisrupted
Mapping
Public Authority
Norwegian Institute of
Public Health, Cause
of Death Registry,
International
Classifikaction of
Diseases (ICD)
Norwegian
Directorat of
Health,
Norwegian
Patient Registry
Norwegian
National Fund
for Natural
Damage
Assistance
Academic & Research
Institutes
Private Sector Finance Norway Finance Norway Finance Norway Finance Norway Finance Norway Finance Norway Finance Norway Finance Norway
Data
Recording
[National, Regional,
Municipality, Asset]
National
National,
recordning from
specialised
services only
Asset Asset National Asset Asset Asset Asset
Asset,
recordning from
primary health
care only
Asset,
recordning from
municipal level
only
Format
[database, shp,...]
Oracle/SQL SQL SAS/SQL SAS/SQL Unknown SAS/SQL SAS/SQL SAS/SQL SAS/SQL SAS/SQL SAS/SQL
B4 and B5 C3, C4 C5 and C6
Indicators and
Insurance
loss data](data:image/gif;base64,R0lGODlhAQABAIAAAAAAAP///yH5BAEAAAAALAAAAAABAAEAAAIBRAA7)
Recomendados
Recomendados
Más contenido relacionado
La actualidad más candente
La actualidad más candente (7)
Destacado
Destacado (14)
Similar a National’s view on evidence-based assessment of the Sendai Indicators‒ Norway (Mia Ebeltoft, Finance Norway)
Similar a National’s view on evidence-based assessment of the Sendai Indicators‒ Norway (Mia Ebeltoft, Finance Norway) (20)
Más de OECD Governance
Más de OECD Governance (20)
Último
Último (20)
National’s view on evidence-based assessment of the Sendai Indicators‒ Norway (Mia Ebeltoft, Finance Norway)
- 1. www.financenorway.com Evidence-based assessment of the Sendai Indicators Oct 26-28 EC-OECD-PLACARD By Mia Ebeltoft, Finance Norway Association for the norwegian banks and insurance companies
- 2. www.financenorway.com2 Suggested global indicators Target A Target B Target C Target D A1- Number of deaths and missing due to hazardous events per 100,000 B1- Number of affected people per 100,000 C1- Direct economic loss due to hazardous events in relation to global gross domestic product D1- Damage to critical infrastructure due to hazardous events (A-2 + A-3) (sum of B-2 to B-6) (sum of C-2 to C-7) (sum of D-2 to D-5) A-2Numberofdeaths A-3Numberofmissing B-2-Injuredorill B-3a–Numberofevacuated B-3b-Numberofrelocated B-4-Numberofpeoplewhosehouses weredamaged B-5-Numberofpeoplewhosehouses weredestroyed B-6-Numberofpeoplewhoreceivedfood reliefaid C-2-Directagriculturalloss C-3-Directeconomiclossdueto industrialfacilitiesdamagedordestroyed C-4-Directeconomiclossdueto commercialfacilitiesdamagedor destroyed C-5-Directeconomiclossduetohouses damaged C-6-Directeconomiclossduetohouses destroyed C-7-Directeconomiclossduetodamage tocriticalinfrastructurecausedby hazardousevents D-2-Numberofhealthfacilitiesdestroyed ordamaged D-3-Numberofeducationalfacilities destroyedordamaged D-4-Numberoftransportation infrastructuresdestroyedordamaged D-5-Numberoftimebasicserviceshave beendisrupted Mapping Public Authority Norwegian Institute of Public Health, Cause of Death Registry, International Classifikaction of Diseases (ICD) Norwegian Directorat of Health, Norwegian Patient Registry Norwegian National Fund for Natural Damage Assistance Academic & Research Institutes Private Sector Finance Norway Finance Norway Finance Norway Finance Norway Finance Norway Finance Norway Finance Norway Finance Norway Data Recording [National, Regional, Municipality, Asset] National National, recordning from specialised services only Asset Asset National Asset Asset Asset Asset Asset, recordning from primary health care only Asset, recordning from municipal level only Format [database, shp,...] Oracle/SQL SQL SAS/SQL SAS/SQL Unknown SAS/SQL SAS/SQL SAS/SQL SAS/SQL SAS/SQL SAS/SQL B4 and B5 C3, C4 C5 and C6 Indicators and Insurance loss data
- 3. www.financenorway.com Insurance loss data Target B: affected people and Target C: Direct economic loss • B-4- Number of people whose houses were damaged • B-5- Number of people whose houses were destroyed • C- 3 -Direct economic loss due to industrial facilities damaged or destroyed • C-4- Direct economic loss due to commercial facilities damaged or destroyed • C-5- Direct economic loss due to houses damaged and C-5 b loss of administrative building • C-6- Direct economic loss due to houses destroyed • Around 99 % of the (228) municipalities by private property insurance • Finance Norway (insurance association) collects loss data on a municipality level • Indirect insurance loss data due to Natcat hazards / events or urban flooding: – business interruption, motor vehicle, electricity disruption, personal accidents 3
- 4. www.financenorway.com Questions from JRC Question no 1 • “How National loss databases can support the implementation of Sendai Indicators at Global and National scale?” • Observations and answer: – National database will give a totally different and better holistic risk picture • Today neither the local, regional or national Government have the total risk picture, the cause of the disaster or the costs the disasters • Will be needed to fulfill the “build back better” - goal – A national database must also be “multi-beneficial” on DRR and CC adaptation • Not only used as an «reporting-upwards» -system (for the national coordinator/ the Civil Protection) Important: loss data on a municipal / city level will NOT help the local Government fulfill Sendai. They need to know WHERE exactly the losses are (the address). 4
- 5. www.financenorway.com Questions nr 2 • “How targeted collaboration between Scientific Experts and Public Authorities can improve the implementation of loss databases, according to the Sendai Framework?” • Observations: The research projects: – are extremely many and complex, but not coordinated or possible to get an overview of – so, where are the synergies? – are almost impossible to track or find, or to understand or use for local (and partly national) decision makers • They don´t give the decision makers – particularly on local level – the tools or useful «instruments» they need for preventive measures / fulfilling the Sendai goals. – are too much based on, or defined by the researchers themselves, not the practitioners – need to bring the decision makers on all levels into the projects (not only the signature/name or funding) 5
- 6. www.financenorway.com Question 3 • Which are the benefits from an effective national implementation of the Sendai Indicators in terms of loss accounting, risk modelling, loss compensation and disaster forensic? • Observations/answer – Holistic picture; understanding the «real» picture and trends and how it hits the economical budgets – Will create different political and technical decisions – Will (hopefully) make the public stakeholdes see the need of cross – border engage the other i stakeholders – cooperation 6
- 7. www.financenorway.com Question no 4 7 • What is the roadmap for the National implementation of Sendai Indicators? – National agencies established a national platform with multi – agencies /stakeholders from the authorities – Finance Norway (insurance) will probably be included • Already set up three projects – where loss data is one – National White Paper (road map) before end of 2016 Otherwise: – Follows Japan suggestion (less indicators)
- 8. www.financenorway.com Holistic risk picture: You need collaboration cross sectors Thevalueof collaboration Governments Private Sector Local Authorities Public Agencies Insurance Industry • Risk management • Assessment • Quantify & Calculate • Risk transfer products • Collects local disaster loss data • Compensate, don’t mitigate
- 10. www.financenorway.com 0 500 1,000 1,500 2,000 2,500 3,000 3,500 4,000 4,500 5,000 Damages-millNOK Total "water-related" damages incl urban flooding vs land /river-flooding Total water damage Land flooding Other Natural Perils
- 11. www.financenorway.com Urban flooding: 70 % of “natcat” (disaster) insurance loss 11 Average insurance pay outs last 10 years River floodin g Urban flooding / storm water Landslide Stormsurge Urban flooding / sewer back up2/3 of Europeans live in cities
- 12. www.financenorway.com “National’s view on evidence-based assessment” • PPP by Finance Norway – Finance Norway started in 2010 to invite municipalities and relevant national agencies and ministries into (smaller) discussion forum and workshops (“PPP local and national platform”) – Based on this cross-over dialogue, connections and workshops, Finance Norway initiated, or participated from 2011 and following years - 4 projects directly related to transfer of insurance loss data: 1. Private - public - project (PPP): local insurance loss data to make the cities understand risk zones and take better, more resilient decision and investments + “build back better” 2. Geovisualization tool – based on PP 1: a ‘data display’ of all natcat compensations on municipality level (Climres) 3. Collected critical risk management information for agencies (river flooding) through insurance loss adjusters – changed flood models and better prioritizing of local flood maps 4. PPP-platform; 8- years national research program together with national agencies, municipalities, researchers and business - http://www.klima2050.no/ 12
- 13. www.financenorway.com How local insurance lossdata can fulfill Sendai goals 13 Private – Public Project: Using insurance loss data to strengthen municipalities’ efforts to prevent climate-related natural hazards Collaboration project between Finance Norway Western Norway Research Institute Norwegian University of Science and Technology Number 1 PPP
- 14. www.financenorway.com What helped to kick off the project “In order to improve adaptation, and to be able to prioritize, and to take the right, optimal decisions, you need to understand what is at risk and where are the “risk zones” (vulnerable areas). “ The report NOU2010:10 recommended to (and by that challenges the insurance industry): ”Establish a nastional database for public use and research using aggregate, anonymised data on climate-related damage from the insurance companies and the Norwegian Natural Perils Pool”». National Green Paper
- 15. www.financenorway.com First «public-private-project» in Europe in its kind • Initiated by Finance Norway in close dialogue with municipalities and national agencies (flood agency and civil protection agency) • Financed by: – Finance Norway/ insurance industry and – Norwegian Government (Ministry of Climate and Environment) • Ten different “pilot” municipalities/cities • Reference group: five different agencies and meteorological inst. • Project period: Sept 2013 to Feb 2015
- 16. www.financenorway.com Main goals • Can insurance loss data help climate - resilient and disaster risk reduction work in the municipalities? • Will these loss data strengthen municipalities’ knowledge base for preventing for natcat and urban flooding-related natural hazards? • Will the insurance loss data help secure and preserve the insurance willingness to (still) offer covered? – Avoid repetitive damages and diminish the increasing number of damages – Avoid “unaffordable” insurance premium or withdrawal of insurance coverage
- 17. www.financenorway.com • Generally – Increase collaboration within the municipalities (planning og technical) – Got new insights into risks previously unknown and vulnerable areas (hot spots) – Improved understanding of how climate change affects society (did not show on the budget!) • Land-use planning – Improved knowledge base to • select areas with the lowest possible risk of natural hazards • prioritize security measures • Construction and maintenance of water and sanitation – Improved knowledge base for • prioritizing management, maintenance, rehabilitation, and reinvestment • collaboration between municipal water/sanitation and planning units • Preparedness – Improved knowledge base for risk and vulnerability analyses (ROS-analyses required by law) 17 Main conclusion This PP-project kicked of many other research projects using local insurance loss data We are now looking into combining insurance loss data (vulnerable areas) and local weather (meteorological institute)
- 18. www.financenorway.com Oslo capital – the city’s own loss data
- 19. www.financenorway.com Oslo – after transfer of insurance loss data from private, business and municipality buildings
- 21. www.financenorway.com21 Insurance loss data on municipal level: Geovisualization tools showing insurance compensation due to various natcat (river flooding, strom, storm surge, landslide) and storm water and sewage backup (urban flooding) from 1980 - 2014 http://setebos.svt.ntnu.no/climres/
- 22. www.financenorway.com22 Collected critical risk management information for agencies (river flooding) through insurance loss adjusters – changed flood models and better prioritizing of local flood maps Extra table with parameters related to the flood. To be able to link this information to the rest of the survey, the following information was requested: surveyor name, survey no., insurance company, location and municipality no. Flood parameters included in registration form used by insurance surveyors Number 3 PPP Building no. ID or type of building Water level cm +/- relative to ground floor level Basement? yes/no Erosion, under-mining of building? yes/no Mass deposition outside of the building? yes/no - thickness Damage due to floating objects etc. hitting the building? yes/no Supplementary information