
Recomendados
Más contenido relacionado
La actualidad más candente
La actualidad más candente (15)
Similar a OECD-FAO Agricultural Outlook 2018-2027
Similar a OECD-FAO Agricultural Outlook 2018-2027 (20)
Último
Último (20)
OECD-FAO Agricultural Outlook 2018-2027
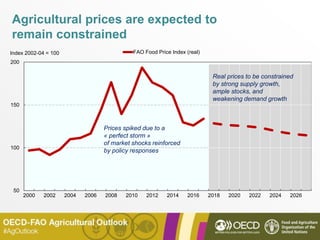
- 1. Agricultural prices are expected to remain constrained 50 100 150 200 2000 2002 2004 2006 2008 2010 2012 2014 2016 2018 2020 2022 2024 2026 Index 2002-04 = 100 FAO Food Price Index (real) Prices spiked due to a « perfect storm » of market shocks reinforced by policy responses Real prices to be constrained by strong supply growth, ample stocks, and weakening demand growth
- 2. Growth in demand for agricultural commodities slows down – except for dairy 0.0 0.5 1.0 1.5 2.0 2.5 3.0 3.5 4.0 4.5 5.0 2008-17 2018-27 2008-17 2018-27 2008-17 2018-27 2008-17 2018-27 2008-17 2018-27 2008-17 2018-27 Cereals Meat Fish Fresh dairy Sugar Vegetable oil % Due to per capita demand growth (food & other uses) Due to population growth Average annual growth rate in demand
- 3. Most additional food demand will come from Sub-Saharan Africa, India and China -20 0 20 40 60 80 100 120 140 160 2008-17 2018-27 2008-17 2018-27 2008-17 2018-27 2008-17 2018-27 2008-17 2018-27 2008-17 2018-27 Cereals Meat Fish Fresh dairy Sugar Vegetable oil Rest of World MENA China India Sub-Saharan Africa OECD Mt/decade Growth in demand
- 4. Meat and fish: Convergence in consumption patterns remains limited Per capita food consumption, 2027 0 10 20 30 40 50 60 70 80 90 100 SSA India China MENA OECD World Fish Sheepmeat Poultry Pigmeat Beef and vealkg/ cap
- 5. Dairy: Strong growth in fresh dairy products in India will continue Per capita food consumption of milk solids, 2027 0 5 10 15 20 25 30 SSA India China MENA OECD World Butter Whole milk powder Skim milk powder Cheese Fresh dairykg/cap
- 6. Aquaculture is on track to overtake capture fisheries globally 0 20 40 60 80 100 120 Aquaculture Total capture Capture for human consumptionMt
- 7. 0 100 200 300 400 500 600 700 800 Maize Protein meals Other coarse grains Wheat Cereal bran Others Mt 2015-17 2027 Maize and protein meals increase their share of the global feed mix
- 8. Biofuel growth slows down 0 20 40 60 80 100 120 140 2000 2003 2006 2009 2012 2015 2018 2021 2024 2027 bln L World ethanol production World biodiesel production
- 9. Feedstocks for biofuels will account for a stable share of demand 0 5 10 15 20 25 2000 2003 2006 2009 2012 2015 2018 2021 2024 2027 % Maize used for biofuels Sugarcane used for biofuels Vegetable oil used for biofuels
- 10. 0 5 10 15 20 25 30 35 0 200 400 600 800 1000 1200 1400 1600 1800 Sub-Saharan Africa South and East Asia Middle East and North Africa Americas Eastern Europe and Central Asia Oceania Western Europe % 2015-17 2027 Growth, 2015-17 to 2027 (right axis)USD billion Production will grow fastest in developing regions Agriculture and fisheries production (constant 2004-06 prices)
- 11. The share of agricultural production traded is expected to remain constant 0 5 10 15 20 25 30 35 40 45 50 % 2015-17 2027
- 12. Trade: Specialisation between regions is increasing over time -100 -50 0 50 100 150 1990 1993 1996 1999 2002 2005 2008 2011 2014 2017 2020 2023 2026 USD bln Agricultural trade balances by region, in constant value, 1990-2027 Americas Oceania Eastern Europe and Central Asia Western Europe Sub-Saharan Africa MENA South and East Asia
- 13. The Middle East and North Africa will remain dependent on imports Share of imports in domestic consumption 0 10 20 30 40 50 60 70 80 90 100 Wheat Rice Oilseeds Vegetable oil Sugar Beef Poultry Sheep Milk Fish % 2015-17 2027
- 14. 0 50 100 150 200 250 300 350 2008 2011 2014 2017 2020 2023 2026 USD/t Real maize price: Baseline and 90% interval Grey range includes 90% of simulated prices from the stochastic analysis Despite downward trend, risk of temporary price increases remains