

Recomendados
Recomendados
Más contenido relacionado
La actualidad más candente
La actualidad más candente (20)
Destacado
Destacado (20)
Similar a index_result_eng8
Similar a index_result_eng8 (20)
Más de Oksana Abramenko (resume@lvivconsult.com)
index_result_eng8
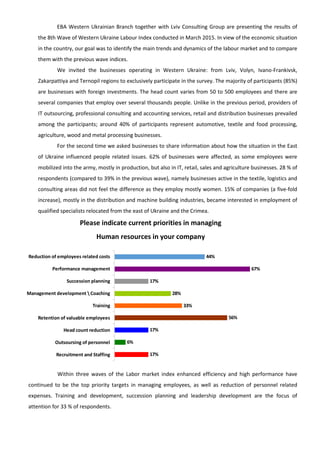
- 1. EBA Western Ukrainian Branch together with Lviv Consulting Group are presenting the results of the 8th Wave of Western Ukraine Labour Index conducted in March 2015. In view of the economic situation in the country, our goal was to identify the main trends and dynamics of the labour market and to compare them with the previous wave indices. We invited the businesses operating in Western Ukraine: from Lviv, Volyn, Ivano-Frankivsk, Zakarpattiya and Ternopil regions to exclusively participate in the survey. The majority of participants (85%) are businesses with foreign investments. The head count varies from 50 to 500 employees and there are several companies that employ over several thousands people. Unlike in the previous period, providers of IT outsourcing, professional consulting and accounting services, retail and distribution businesses prevailed among the participants; around 40% of participants represent automotive, textile and food processing, agriculture, wood and metal processing businesses. For the second time we asked businesses to share information about how the situation in the East of Ukraine influenced people related issues. 62% of businesses were affected, as some employees were mobilized into the army, mostly in production, but also in IT, retail, sales and agriculture businesses. 28 % of respondents (compared to 39% in the previous wave), namely businesses active in the textile, logistics and consulting areas did not feel the difference as they employ mostly women. 15% of companies (a five-fold increase), mostly in the distribution and machine building industries, became interested in employment of qualified specialists relocated from the east of Ukraine and the Crimea. Please indicate current priorities in managing Human resources in your company 17% 6% 17% 56% 33% 28% 17% 67% 44% Recruitment and Staffing Outsoursing of personnel Head count reduction Retention of valuable employees Training Management development Coaching Succession planning Performance management Reduction of employees related costs Within three waves of the Labor market index enhanced efficiency and high performance have continued to be the top priority targets in managing employees, as well as reduction of personnel related expenses. Training and development, succession planning and leadership development are the focus of attention for 33 % of respondents.
- 2. A tendency to optimize resources is still strong, though a number of respondents planning to reduce headcount decreased by 15% from 36% in the Seventh Wave. Among them are seasonal businesses. 40% of companies plan to expand and increase head count: e.g. to open new trade outlets or stores, representative offices and branches in other cities (consulting, audit, software development firms). Assembly operations businesses in the machine building, metal working and textile industries also plan to hire new employees. 55% of medium and large companies will not change head count during the coming three months. Please indicate what categories of employees are currently in demand in your company 17% 50% 11% 6% 11% 17% Line Managers Core Business Specialists Administrative Staff Fresh graduates without experience / Students Workers (skilled labour) Workers (non skilled labour) Employers became more active in recruitment of new hires in the market (78% compared to 50% in the previous wave). Companies are looking for sales specialists, engineers, marketing specialists, accountants and IT specialists with 3 +years of experience. There is a pronounced demand for line managers and semi-skilled labour by production companies. Fresh graduates became less attractive for employers. A small number of respondents started to look for top managers compared to zero demand in the past 6 to 9 months. Despite a very complicated situation in the economy, none of the respondents plan to reduce pay levels. 21 % of businesses, mostly in sales and distribution, will not review pay levels at all. 39% have already increased salaries in January, 2015; a half of them will adjust pay levels within next three months. 56% of respondents are ready to increase employees’ pay during three months to cover inflation rate and local currency devaluation. Some companies (IT and assembly operations) plan to do so each month for certain groups of employees.
- 3. Average salary ranges (before taxes) in different industries: Average salary ranges (before taxes), UAH Manufacturing: Wood processing Metal Working Automotive Light industry Food industry Machine building Agriculture Non-skilled /semi-skilled labour (operators, seamstresses) *assembly operations, textile industry ** wood processing and agriculture 2100-2400* 3100 - 4600** Skilled labour (mechanics, locksmiths, etc.) *assembly operations, machine building, automotive ** wood processing and agriculture 3100 – 4500* 5500- 7000** Administrative and office personnel (accountants, analysts, administrators, lawyers, etc) 4100-6500 Specialists (engineers, logistic, consultants, HR, agronomists) 5200 - 8500 Mid level managers (heads of departments) 7500-11000 Top managers * pay level may be linked to currency exchange rate 15 000+* Services: Legal and audit Consulting Retail HR ІТ Semi-skilled workers with high school certificate (cleaners, sales agent) 1300-2200 Qualified workers (call centre operators, clerks, cashiers, senior sales agents) 2200-3500 Administrative and office personnel (accountants, analysts, administrators, lawyers, office managers) * IT and e-commerce companies 4300 – 6500 6500 - 8500* Specialists ( logistics, consultants, HR, sales managers) * IT , e-commerce and trade companies 4500 - 8500 9000- 12000+* Mid level managers (heads of departments) 7500 - 10000 Toр managers * pay level may be linked to currency exchange rate 15 000+* Compared to the previous wave, average pay level of workers, specialists and middle managers in manufacturing companies increased by 11%-13%. This is a general tendency, though a few companies increased pay by up to 30% for all employees. Some companies did selective salary increase for key performers to retain the best talent.
- 4. Salaries of non-skilled employees in servicing firms have increased by 8% to 11%, mid level managers, office and administrative staff got a 14%-17% increase in pay. Salary of specialists in those firms also increased by 20%. Top management salaries of manufacturing and service companies, indicated in the table, are minimum salaries, often linked to currency exchange rate. Information is not complete to identify % of increase. Please indicate what benefits your company offers to employees, in addition to those required by the law 50% 39% 89% 39% 0% 34% 23% 39% 6% Meals Subsidized transportation Mobile phone connection Medical insurance Additional vacations Sport and recreation facilities Flexible working hours Free loans Pension plan Not a single company among the respondents deprived employees of additional incentives during the past 6 months. Free mobile connection remains the most popular incentive favoured by manufacturing and service companies. Manufacturing companies complemented subsidized meals and transportation to a work place by medical insurance and flexible working hours. Structure of the compensation package provided by service companies has not changed over time. Employees of IT, trade and audit firms can use free sports and recreation procedures, medical insurance and flexible working hours.
- 5. How would you estimate the current labor market? Labour Market Index in March 2015 is 3.46. The index is defined as average indicator of the individual categories. Individual indicators were defined as follows: e.g. “Market salaries”: 1*6,3% + 2*6,3% + 3*37,5% + 4*37,5% + 5*12,5% = 3.43 Compared to September 2014, Labour market Index in March 2015 went up by 0.41 and is at the level of 3.46. Thus, the labour market is still unstable but demonstrates positive trends for employers, namely, relatively low salaries if calculated in hard currency and lower employee related expenses. Labour Market Index Dynamics