SlideShare una empresa de Scribd logo
1 de 43
Descargar para leer sin conexión
Tegemeo Institute of Agricultural
                      Policy and Development


                      Tegemeo Working paper 25/2006
           Rural Financial Services in Kenya: What is Working and Why?


                                           By
                                     Betty Kibaara


                 Tegemeo Institute of Agricultural Policy and Development,
                                    Egerton University.
                                 P.O Box 20498, Nairobi.
                                     Tel: (02) 2717818
                              Email: egerton@tegemeo.org


Support for this research has been provided by the Tegemeo Agricultural Monitoring and
Policy Analysis Project (TAMPA) between Tegemeo Institute/Egerton University and the
Department of Agricultural Economics at Michigan State University. Financial support
for this project is provided by the Kenya Mission of the United States Agency for
International Development. I sincerely thank Samuel Mburu and Mercy Mutua for their
assistance in data collection and compilation of field report. The time afforded to us by
our field respondents and other stakeholders interviewed during the course of this study is
humbly appreciated.
Rural Financial Services in Kenya: What is Working and Why?

                                           Betty Kibaara∗

                                           Abstract

        Access to rural financial services has a potential to make a difference in
agricultural productivity, food security and poverty reduction. However, an efficient,
sustainable and widely accessible rural financial system remains a major development
challenge in most Sub Sahara African countries. The Economic Recovery Strategy for
Wealth and Employment Creation (ERS) has identified poor access to farm credit and
financial services as a contributing factor to the decline in agricultural productivity. The
Strategy for Revitalizing Agriculture (SRA) proposes to improve access to rural financial
services in Kenya. As a follow up on SRA, the Agricultural Sector Co-ordination Unit
(ASCU) has fast tracked access to rural financial services by establishing a thematic
group on inputs and rural financial services with an overall objective of developing an
Integrated Farm Input Strategy. In the late 1990’s, most mainstream commercial banks
closed down the rural branches in order to cut costs and improve profits. Since then, a
number of non-traditional financial institutions have emerged to fill the gap created by
the mainstream banks which locked out low income and irregular earners.
        This study examines the evolving structure of the rural financial services and the
extent to which the current financial institutions have improved access to producers and
traders in the rural areas. The study identifies successful cases of functioning financial
services in the rural areas. It also identifies constraints that hinder increased access to
rural financial services and proposes policy interventions that could make the services
more accessible to the rural people. The study was carried out in 15 Districts within six
agro-ecological zones. Data was obtained from key rural finance stakeholders using a
structured checklist. The study is supplemented with information from the Tegemeo
Agricultural Monitoring and Policy Analysis (TAMPA) 2004 survey consisting of
responses from 1540 rural households.

       Findings from the study indicate that a number of key rural financial models have
evolved to address the demand for rural financial services in Kenya. These include:
Community Owned Rural Financing Models, Private Commercial Bank Led Model,
Government Led-Rural Finance Model, Donor Guarantees-Input Supply Model,
Managed SACCO-Beach Banking Model and the Informal Group Based Rural Financing
Model. The Government on its part has restructured the operations of Agricultural
Finance Corporation (AFC) in line with the Strategy for Revitalization of Agriculture
(SRA). The emerging leading indigenous banks have also set up fixed and mobile
branches in the rural areas.


∗
 Research Fellow, Tegemeo Institute, Egerton University. P.O. Box 20498 (00200), Nairobi, Kenya. Tel.
+254 20 2717818: email: bkibaara@tegemeo.org


                                                                                                        ii
Table of Contents
Abstract ............................................................................................................................... ii
Table of Contents............................................................................................................... iii
List of Tables ..................................................................................................................... iv
List of Figures .................................................................................................................... iv
List of Acronyms ................................................................................................................ v
1.0      Introduction........................................................................................................... 1
1.1      Background Information ..................................................................................... 1
1.2      Objectives............................................................................................................... 3
1.3      Research Questions............................................................................................... 3
1.4      Methodology .......................................................................................................... 3
2.0      An overview of the Agricultural Credit in Kenya.............................................. 5
2.1      The Role of Rural Credit in Increasing Agricultural Productivity.................. 5
2.2      Demand and Supply of Rural Credit .................................................................. 5
   2.2.1       Demand ........................................................................................................... 5
   2.2.2       Supply ............................................................................................................. 7
2.3      Characteristics of the Households that Received Agricultural Credit ............ 9
2.4      Agricultural Credit Type and Repayment Mode............................................. 10
3.0      Emerging Models of Rural Financing............................................................... 12
   3.1      Community Owned Rural Finance Model........................................................ 12
      3.1.1        Financial Service Associations ................................................................. 12
      3.1.2        Mbeu Savings and Credit Association...................................................... 14
   3.2      Private Commercial Bank Led Model: a Case of Emerging Indigenous Bank 17
      3.2.1        Mobile Banking with Equity Bank ........................................................... 18
   3.3      Government Led Rural Finance Model: a case of AFC ................................... 19
   3.4      The Donor Guarantee-Input Supply Model ...................................................... 23
      3.4.1        Stockists Credit Guarantee System ........................................................... 24
      3.4.2        Credit Voucher System:Rice Production in Ahero Irrigation Scheme ..... 25
   3.5      Managed SACCO: a case of ‘Beach Banking’ Model...................................... 28
      3.5.1        Market Day Loans..................................................................................... 28
   3.6      Informal Group Based Rural Financing Model ................................................ 29
      3.6.1        Merry go –round ....................................................................................... 29
      3.6.2        Mata Masu Dubara (MMD) ...................................................................... 29
     3.6.3         Table ‘Banking’ ........................................................................................ 30
     3.6.4         Rotating Savings and Credit Associations (ROSCAs) ............................. 30
  3.7      Group Membership in Rural Kenya.................................................................. 31
  3.8      A Comparative Analysis of the Models............................................................ 32
     3.8.1         Sustainability and Outreach ...................................................................... 34
   3.9      Future Scenario of Rural Financing.................................................................. 36
4.0     Key Findings and Policy Implications............................................................... 37
Reference ......................................................................................................................... 38


                                                                                                                                       iii
List of Tables

Table 1: Sources of Primary Data by Agro-Ecological Zones ........................................... 4
Table 2: Maize Productivity and Access to Agricultural Credit, 2004............................... 5
Table 3: Source of Agricultural Credit in Percent, 2000 and 2004 .................................... 8
Table 4: Selected Characteristics of households that received credit, 2004 ..................... 10
Table 5: Credit Type and Repayment Mode..................................................................... 11
Table 6: Statistical for Financial Service Association, 1999-2005................................... 14
Table 7: Where do Mbeere District Households save?..................................................... 15
Table 8: AFC Development and Seasonal Credit, 1996 to 2005...................................... 21
Table 9: Group Type by Zone, 2004................................................................................. 31
Table 10: A comparative Analysis of selected Models .................................................... 33


List of Figures

Figure 1: Reasons for borrowing, 2000 and 2004…………………………………. .. .. 6
Figure 2: Percent of households that obtained credit by zone, 2004……………………...7
Figure 3: Outreach and Financial Sustainability Frontier…………………………        .35


                                                                                                                  iv
List of Acronyms
 AFC           Agricultural Finance Corporation
 AFRACA        African Rural and Agricultural Credit Association
 AGMARK        Agricultural Market Development Trust
 AMFI          Association of Micro Finance Institutions
 ASCU          Agricultural Sector Co-ordination Unit
 CDF           Constituency Development Fund
 CGS           Credit Guarantee System
 DFS           Decentralised Financial Services
 ERSWC         Economic Recovery Strategy for Wealth and Employment Creation
 FOSA          Front Office Service Activities
 FSA           Financial Services Association
 IFAD          International Fund for Agricultural Development
 KACE          Kenya Agricultural Commodity Exchange
 KSH           Kenya Shilling
 KREP          Kenya Rural Enterprise
 MMD           Mata Masu Dubara
 MFI           Micro Finance Institution
 NARC          National Rainbow Coalition
 NCPB          National Cereals and Produce Board
 NGOs          Non Governmental Organizations
 NIB           National Irrigation Board
 PRSP          Poverty Reduction Strategy Paper
 RMC           Regional Management Company
 ROSCAs        Rotating Savings and Credit Associations
 SACCO         Savings and Credit Co-operative Societies
 SRA           Strategy for Revitalizing Agriculture
 STEP          Saga Thrift Enterprise Promotion
 TAMPA         Tegemeo Agricultural Monitoring and Policy Analysis
 USAID         United States Agency for International Development


                                                                               v
1.0    Introduction

1.1    Background Information

       Agriculture contributes 23.9% percent of national Gross Domestic Product (GDP)
and 60 percent of the total export earnings. In addition, 80 per cent of the population
derives their livelihood from agriculture. In spite of the significant contribution,
agriculture has experienced low productivity in the past decade. The Poverty Reduction
Strategy Paper (PRSP) prioritized agriculture and rural development sector as one of the
key sectors that needs urgent intervention. In order to attain the targeted five percent
annual growth in this sector, financial systems, extension services, rural infrastructure,
marketing and distribution systems need to be addressed.
       Promoting an efficient, sustainable and widely accessible rural financial systems
remains a major development challenge in most sub Sahara African countries. With about
73% of Africa’s population living in the rural areas and experiencing a high incidence of
rural poverty, improved rural finance is crucial in achieving pro-poor growth and poverty
reduction goals. However, the development of rural financial systems is hampered by the
high cost of delivering the services to small, widely dispersed customers; as well as a
difficult financial terrain – characterized by high covariant risks, missing markets for risk
management instruments and lack of suitable collateral (Onumah, 2002).
       Lack of working capital and low liquidity limit the farmer’s ability to purchase
productivity enhancing inputs like seeds, fertilizers and pesticide. Inspite of the relatively
high adoption rates of inputs like fertilizers, the quantities used are low and therefore,
hybrid variety crops that are dependent on fertilizers may not attain their potential
production (Nyoro, 2002). The average production efficiency levels are higher among
producers who have access to formal credit, (Awudu and Richard, 2001). Access to credit
resulted to higher technical efficiency in maize production in Kenya, (Kibaara, 2005).
       Kenya has not developed a comprehensive rural financial services strategy. The
rural financial sector is governed by the Banking Act, Building Society Act and the Post
Bank Act. The proposed Deposit Taking Micro Finance Bill 2005 and the proposed
SACCO Societies Regulatory bill, 2004 are still to be debated in parliament. Through the
Economic Recovery Strategy for Wealth and Employment Creation (ERSWC) the


                                                                                            1
government has identified poor access to farm credit and financial services as a
contributing factor to the decline in agricultural productivity.         The Strategy for
Revitalizing Agriculture (SRA) proposes to encourage an orderly development of micro-
finance institutions through the enactment of facilitative legislation, encourage
commercial banks to set up operations in the rural areas by providing appropriate
incentives, encourage banks to lend to agriculture by reviewing and repealing legal
provisions that have undermined banks lending to the sector, recapitalize and streamline
the management of Agricultural Finance Corporation so that it can perform its function of
providing affordable credit to farmers ( Republic of Kenya, 2004). As a follow up on
SRA, the Agricultural Sector Co-ordination Unit (ASCU) has fast tracked the rural
financial services by establishing a thematic group on inputs and rural financial services
with an overall objective of developing an Integrated Farm Input Strategy.
       Rural financial services refer to all financial services extended to agricultural and
non-agricultural activities in rural areas; these services include money deposit/savings,
loans, money transfer, safe deposit and insurance. Demanders/beneficiaries of rural
financial services are mainly households, producers, input stockists/suppliers, traders,
agro-processors and service providers. Rural financial services help the poor and low
income households increase their incomes and build the assets that allow them to mitigate
risk, smoothen consumption, plan for future, increase food consumption, invest in
education and other lifecycle needs. These needs can be broadly categorized into working
capital, fixed asset financing, income smoothing and life cycle events. Access to credit
and financial services has the potential to make a difference between grinding poverty
and economically secure life. Inspite of the importance of a savings account, 77 percent
of Kenyan households have no access to a bank account (Kodhek, 2003). In the late
1990’s, most mainstream commercial banks closed down some rural branches in order to
cut costs and improve profits. The non-traditional financial institutions have emerged to
fill the gap created by the mainstream banks which locked out low income and irregular
earners.


                                                                                          2
1.2    Objectives
       The primary objective of this study was to examine the evolving models of rural
financial service providers with a broad aim of understanding models that are working,
why they are working, characteristics, opportunities and constraints.         It seeks to
understand the extent to which these models have improved access to the rural financial
services for producers and traders in the rural areas. The study proposes some policy
some interventions that could improve access to financial services.

1.3    Research Questions
       The study seeks to answer the following research questions; Are there success
cases in the provision of rural financial services? What are the characteristics of rural
financial service providers? What are the challenges and opportunities? How can the
success cases be replicated and up-scaled? Who is accessing and at what cost? Has the
government implemented any SRA proposal of recapitalizing and restructuring AFC?
       Results will contribute to a better understanding of the evolving structure of rural
financial services and provide an input to the Integrated Farm Input Strategy to be
prepared by the thematic group on inputs and rural financial services.

1.4    Methodology
       This study utilized data from primary and secondary sources. Secondary data was
gathered during the discussions with stakeholders from the rural finance sub-sector i.e.
Banks-Equity Bank, Co-operative Bank of Kenya, Post bank, Kenya Commercial Bank;
Development     partners-United     States   Agency    for   International   Development,
International Fund for Agricultural Development (IFAD); Financial Associations-
African Rural and Agricultural Credit Association (AFRACA), Association of Micro-
finance (AMFI); Financial Regulator-Central Bank- Rural Finance Development
Department; Non-governmental organizations-Sacred Africa, K-Rep Development
Agency (KDA), Kenya Agricultural Commodity Exchange Ltd (KACE), Decentralized
Financial Services (DFS), ACDI VOCA, Agricultural Market Development Trust
(AGMARK); Government-Agricultural Finance Corporation (AFC), Ministry of
Agriculture, Agricultural Sector Co-ordination Unit (ASCU), Ministry of Co-operative
Development and Marketing, Ministry of Social Services; Community Associations -
Diocese of EMBU- Mbeu Savings and Credit Development Association, Archdiocese of


                                                                                         3
Kisumu-ADOK TIMO; Micro-Finance Institutions (MFI)-Krep, MFI-SAGA Thrift and
Enterprise Promotions Ltd.
         Primary data on the emerging models were gathered purposively from 15 districts
within six agro-ecological zones (Table 1). The rural financiers were interviewed using a
structured checklist mainly covering the history of the organization, operations, outreach,
costs, performance indicators, financial services provided, socio-economic characteristic
of the client, requirements, use of loans, transaction charges, default rates, sustainability,
constraints, opportunities among others .

Table 1: Sources of Primary Data by Agro-Ecological Zones
Agro-Ecological Zones                 Districts                            Models

Eastern Lowlands                      Embu, Kitui, Makueni                 Community Owned RF Model


Central Highlands                     Naivasha, Nyandarua, Murang' Meru,
                                                                 a,        Private Commercial Bank Led model

High Potential Maize zone             Eldoret, Kakamega, Narok,            Government Led model, Informal Group
                                                                           based model

Western Lowlands                      Kisumu                               Donor-guarantee Input Supply, Beach
                                                                           banking,

                                                                           Community mobilized model, Table
Western Highlands                     Bungoma, Kakamega, Mumias, Kisii     banking
Marginal Rain Shadow                  Kajiado                              Government led model
Source: Rural finance study, 2006


         The study uses supplementary data from the Tegemeo Agricultural Monitoring
Project Analysis (TAMPA) panel data. This is cross-sectional panel (2000 and 2004)
household data comprising of 1540 rural households.                 The data covers eight agro-
ecological zones (High Potential Maize Zone, Central Highlands, Western Highlands,
Western Transition, Western Lowlands, Eastern Lowlands, Marginal Rain Shadow and
Coastal Lowlands). This data provided information on agricultural credit; demand and
sources of agricultural credit and repayment mode and household information on self-
help groups.
         The second section of the paper gives an overview of agricultural credit in Kenya,
demand and suppliers of agricultural credit and outlines characteristics of beneficiaries of
agricultural credit.        Section three discusses the emerging models of rural financial
services and section four outlines the key findings and policy implications.


                                                                                                     4
2.0       An overview of the Agricultural Credit in Kenya

          This section highlights access of general credit in Kenya, demand and supply of
agricultural credit, characteristics of borrowers of agricultural credit and repayment
mode.

2.1       The Role of Rural Credit in Increasing Agricultural Productivity
          Credit is an important input into the production system and it contributes to
increased food productivity.      Results from TAMPA Panel data 2004 shows that
households who received credit for maize production had a higher productivity averaging
7.65 bags per acre as compared 6.5 bags per acre among households that did not receive
credit (Table 2). Access to credit increases the farmers’ working capital enabling the
farmers to buy productivity enhancing inputs such as good quality seeds, fertilizers and
chemicals.
    Table 2: Maize Productivity and Access to Agricultural Credit, 2004
                                   Mean Yield in            Standard
                                       1
    Agricultural credit            bags per acre            Deviation
    Received                           7.88                   6.45
    Did not receive                    6.50                   6.08
Source: Tegemeo household survey, 2004


          These results were subjected to Levene test of equality of variance and an
evaluation of t-statistics shows that there is an overall statistical significant (at 1%
significance level) difference between maize productivity among households with and
without credit.

2.2       Demand and Supply of Rural Credit
          2.2.1 Demand
          Data from the 2004 Tegemeo survey shows that only 39% of the households
sought credit. The main reasons for trying to access credit were farming, consumption
needs, school fees, medical and business. Figure 1 compares levels of demand for credit
in 2000 and 2004. Credit for farming purposes remains the most dominant need because
majority of the rural households, derive their livelihood from agriculture. Demand for


1
    Bag weights 90 kilograms


                                                                                       5
credit for agricultural purposes has increased from 53.71% in 2000 to 71.15% in 2004.
Demand for credit for school fees has declined from 13.29% in 2000 to 11.50% in 2004
partly attributed to free primary education policy in Kenya implemented in 2003.


Figure 1: Reasons for borrowing, 2000 and 2004
                        80.00         71

                        60.00    54
              Percent


                        40.00                 28

                                                           13                                      2000
                        20.00                      10                12
                                                                                3                  2004
                                                                          3           2        5
                         0.00
                                Farming    Consumption School fees        Medical   Business
                                             needs
                                                   Reasons for credit


Source: Tegemeo household survey, 2000 and 2004


         Demand for credit for business purposes had increased from 2% (2000) to 5%
(2004). This could partly be attributed to the increasing importance of off-farm income
earning activities in the rural area. This is supported by Tegemeo panel data set which
reveals that off-farming income sources such as business enterprises are increasingly
becoming an important contributor to the aggregate household income. The contribution
of off-farm income as a percentage of total household income has increased from 24.4%
in 2000 to 45% in 2004. Credit demand for medical needs remains unchanged.
         82% of those that tried to obtain some sort of credit actually received. However,
among those who did not receive credit, 62% had tried to borrow for farming purposes.
An indication that although there is a dominant need for farm credit, most farmers do not
get the required credit. This is partly associated with the nature of agricultural farming
which has high covariant risk
         Access to agricultural credit in Kenya is skewed towards the more productive
agro-ecological zones. Households in the high potential areas have more access to credit
as a result of embedded credit component for the perennial crops such as sugar, coffee
and tea. In 2004, 70 % of the producers in the Central Highlands received credit; as


                                                                                                          6
compared to 44.62% in Western Highlands; Western Transitional (44.80%) and High
Potential Maize Zone (19.67%).                    The low production-potential regions had a lower
percentage of farmers that obtained credit; Marginal Rain Shadow (26%); Western
Lowlands (19.8%); Eastern Lowlands (5.92%) and Coastal lowlands (5.13%).                                             This
shows that there is need to improve access to credit services in the lowlands- Arid and
Semi-arid regions (Figure 2).


Figure 2: Percent of households that obtained credit by zone, 2004

             100


              80
                      70.33


              60
   Percent


                                  44.62        44.52
              40
                                                            25.64
                                                                              19.88         19.67
              20
                                                                                                          5.92       5.13

               0
                    Central     Western      Western     Marginal           Western   High Potential    Eastern    Coastal
                   Highlands   Highlands   Transitional Rain Shadow        Lowlands    Maize Zone      Lowlands   Lowlands
                                                                    Zone


Source: Tegemeo household survey, 2004


2.2.2          Supply

               Market share for agricultural credit is dominated by commodity based credit
providers (Tea, Sugarcane, French beans) whose provision of credit to beneficiaries has
increased from 53.5% in 2000 to 62.7% in 2004. Thus the role of contracted farming in
provision of embedded services such as credit for agricultural inputs has become
increasingly important. The producer cooperatives/SACCOs remain a significant supplier
of agricultural credit and especially in the Central Highlands and Western Transitional
zones. However, the market share has slightly declined from 25% in 2000 to 20.6% in
2004 partly because of spillover effect of wrangles and mismanagement of cooperatives.


                                                                                                                         7
Table 3: Source of Agricultural Credit in Percent, 2000 and 2004
    Source of credit                                  2000               2004
    Commodity Based Credit Providers                 53.5%              62.7%
    Cooperative/ Saccos                               26%               20.6%
    Informal money lenders2                          12.1%               9.9%
    Local trader/input stockists                      6.8%               3.9%
    AFC                                               0.4%               1.3%
    Commercial bank                                   0.6%               1.0%
    MFI/ NGO                                          0.6%               0.5%
                                                    100%%               100%
Source: Tegemeo household survey, 2000 and 2004

            The informal money lenders and local traders/input stockists are more important
than the formal banking institutions. They provide close to 20% of the agricultural credit
in Kenya.
            The government owned Agricultural Finance Corporation has gained from 0.4%
in 2000 to 1.3% market share in 2004. This gain is partly associated to financial revamp
by the government in addition to the current restructuring of the institution. For example,
the reintroduction of seasonal crop credit scheme from 2003/04, which had been
terminated in 1995/96.
            Provision of agricultural credit through the mainstream commercial banks has
increased slightly following the recent innovative products associated with retail banking
such as loans to tea and dairy farmers, reduced bureaucracy, excess liquidity as
investment opportunities are thinned following reduction of government/treasury bills
which was estimated to contribute 50% of the bank’s income. However, the commercial
bank’s contribution to agricultural credit is insignificant.
            The Micro Finance Institutions (MFIs) provide agricultural credit to only to a
mere 0.6% of the rural households. The MFIs have been in existence for the last 20 years,
focus on the economically active poor/entrepreneurs and have played a pivotal role in
helping the low-income earners access non-agricultural loans. In terms of monetary
value, AFC and the commercial banks gave the largest amounts of credit per household
but only to a few households, while the co-operatives/Saccos and commodity based credit
providers ( such as Tea, Tobacco, French beans and sugar companies) disbursed low
amounts of credit to a larger clientele base.

2
    Informal money lender includes shylocks, self help groups, merry-go-rounds, community associations


                                                                                                         8
The credit market is segmented with specific credit providers concentrating on specific
regions. Over 70% of Commodity Based Credit Providers served the Central Highlands
and Western Transitional Zones. 86% of the Co-operatives and 57% of the mainstream
Commercial banks served the Central highlands. In 2004, 64 percent of credit disbursed
by AFC was disseminated to the High Potential Maize Zone, 45% of MFI/NGOs served
the High Potential Maize Zone, 27.7% served the Central highlands and 22.7% served the
Eastern Lowlands. 43.8% of the Informal moneylenders provided agricultural credit to
High Potential Maize Zone, 19% to Western Lowland and 17% Central Highland.

2.3       Characteristics of the Households that Received Agricultural Credit

          The Tegemeo household survey 2004 shows 92.30% of households that received
credit had at least one family member belonging to a group (self help, producer, co-
operative) as compared to 67% who did not receive credit. Household assets act as
collateral for loan repayment. Table 4 shows households that received credit had high
asset value (in Ksh) than those who did not receive.
          Households that received credit had higher annual income. Dis-aggregating
annual household income into income quartile reveals that the lowest income quartile is
15 times poorer than the high income quartile. Among the low income quartile, only
23% of the households received agricultural credit as compared to 39% of the households
in the high income quartile. Therefore, any intervention targeted towards improvement
of rural financial services should not be uniform, but should consider the different income
levels.
          In addition, those that received credit had a higher proportion of households that
engaged in off-farm income as compared to those who did not receive credit.


                                                                                          9
Table 4: Selected Characteristics of households that received credit, 2004
                                                                             Received Agricultural Credit
 Indicator                                                                     Yes                  No
 % received agricultural credit                                               32%                  68%
 Belongs to a group                                                          92.30%              67.60%
 Asset Value in Ksh                                                          264,678             170,994
 Annual Household Income in Ksh                                              189,037             147,469
 Incomes by Quartiles
     Lowest income Quartile in Ksh                                      24,818 (23%)*             25,227
     Second lowest income Quartile in Ksh                                76,356(33%)*             76,221
     Third lowest income Quartile in Ksh                                141,988(33%)*            142,774
    Highest income Quartile in Ksh                                      399,107(39%)*            384,170

 % engaged of household head in off-farm activities                            36%                34%
 Education level
    No formal education                                                        16%                23%
    Primary                                                                    52%                52%
    Secondary                                                                  23%                19%
    Post secondary                                                              6%                 5%
 Gender of the Household Head
    Male -headed                                                             32.90%              67.06%
    Female-headed                                                            27.50%              72.54%
Source: Tegemeo household survey, 2004
 * The values in bracket shows the percentage of households that received agricultural credit


          Education is also a key determinant of access to rural financial services. The table
shows that households that received credit had higher literacy level. Gender influences
access to rural agricultural credit. From this study, male-headed households had higher
access to credit (32.90%) as compared to female-headed households (27.50%). These
characteristics indicate that improving access to rural credit and other financial services
will require a holistic rural development approach that addresses all aspects of
development.

2.4        Agricultural Credit Type and Repayment Mode

          82% of the agricultural credit was received in-kind while 18% was received
inform of cash. 91% of the agricultural credit was disbursed in form of operating inputs
such as fertilizer, seeds, chemicals and labor, 7% on livestock and livestock feeds and 2%
on investment in capital assets.


                                                                                                            10
90% of operating inputs was repaid from crop revenue. 66% of the livestock
credit was repaid from livestock revenue. However, this was supplemented from crop
and off-farm income. 55% of investment in capital asset was mainly repaid from off-farm
income. Crop revenue is an important source of repayment for capital investment (Table
5). This shows that households that have access to off-farm income are more likely to
borrow for capital investment.


Table 5: Credit Type and Repayment Mode
                                                         Mode of Repayment in Percent
 Type of credit                                                                Livestock
                                         Crop      Livestock      Off farm     and crop
                                         revenue   Revenue        income       revenue     Total
 Operating inputs                        89.50     3.40           5.90         1.20        100
 Livestock and feed                      13.60     66.10          11.90        8.50        100
 Investment in capital assets            31.80     9.10           54.50        4.50        100
       Total                             83.10     7.70           7.50         1.80        100
Source: Tegemeo household survey, 2004


                                                                                            11
3.0     Emerging Models of Rural Financing

        Since Rural Financial services is broader than agricultural credit, this section
discusses selected emerging models of providing financial services in the rural areas; the
Community Owned Rural Finance Model, Private Commercial Bank Led Model,
Government Led Rural Finance Model, Donor Guarantee-Input Supply Model, Managed
SACCO-Beach Banking Model, and the Informal Rural Financing Model. The section
looks at the principle behind each model, outreach (in terms of number of beneficiaries),
rural financial products, costs, constraints and opportunities.


3.1     Community Owned Rural Finance Model

        The community owned rural finance model is a rural finance model that is owned
and managed by the rural community with assistance from the donor agency. The
community forms registered associations. Membership is through purchase of shares
from the associations. The objective of this model is to reduce poverty through improved
access to financial services mainly in the low population density areas with high
incidences of poverty such as parts of Eastern and Western Lowland regions. The main
beneficiaries are the low and medium income population who have few alternatives to
financial services. The study found some cases where the community financing models
were set up using the Constituency Development Fund (CDF). Examples of the
community owned rural finance model are the Financial Service Associations and the
church based Mbeu Savings and Credit Association.

3.1.1   Financial Service Associations

        The Financial Services Associations (FSA) are also referred to as village ‘bank’s
and are mainly promoted by K-rep development agency since 1997. The association is
registered as a self help group under the Ministry of Culture and Social Services.
Membership is acquired through purchase of at least one share at a cost ranging from
Ksh. 300 to Ksh. 400. For the model to be operational, it requires a minimum of 300
shareholders. The community contributes towards the share capital and setting up of a
physical financial transaction structure that acts as a ‘banking’ hall. The cost of setting


                                                                                        12
up a physical structure ranges between Ksh. 100,000 and Ksh. 400,000. The donor
agency contributes towards institutionalization (building, furniture, insurance, audit fee)
and capacity building. The agency has a clear exit strategy. The FSA is run by a board of
directors comprising eight members who are elected annually in a general meeting. The
agency monitors the activities of the FSA and has formed Regional Management
Companies (RMC) to provide management expertise in addition to supervision and
training. RMC charge a fixed rate of 15% (though this may vary between FSAs). The day
to day activities are run by lean and low income earning staff members from the
community.
       The main financial services offered are; compulsory savings, voluntary savings,
fixed deposit, money transfer, business loans, agricultural loans, education loans,
emergency loans and safe deposit. The financial services are open to the non-
shareholders at a higher fee. Each FSA operates a bank account with a link mainstream
bank located in the nearest town center where surplus money is deposited and money
transfer is transacted. Members interested in borrowing loans are required to be members
of a primary group and secondary groups. The group members scrutinize the borrower
and also guarantee to repay the loan incase of default. The borrower is loaned three times
the amount of accumulated shares. The loan attracts an interest rate ranging between 3%
and 7% per month on reducing balance, depending on the loan type, repayment and credit
history. The loans are insured at a small fee averaging Ksh. 80 per month. The monthly
revenue per village bank averages Ksh. 100,000 and the expenditure is about Ksh.
50,000. This show the FSAs are making some reasonable amounts of profit.
       The number of FSAs have grown by 105% from 34 (1999) to 70 (2005). The
FSAs have registered a 2233% growth in number of savers from 3000 in 1999 to 70,000
in 2005. The rural poor have mobilized a total of Ksh.82 millions through shareholding.
The value of savings was Ksh. 1.3 billion while cumulative disbursed loan was Ksh. 524
million (Table 6).


                                                                                        13
Table 6: Statistical for Financial Service Association, 1999-2005
                           Shares
                           capital    loans in            Saving in       Average        Average
          No. of            in Ksh.   Ksh        No. of   Ksh.        savings/member   loan/member
Year      shareholders     Millions   Millions   savers   Millions         (Ksh)           (Ksh)
1999      12,958           7          9          3,833    8                 2,087         4,284
2000      21,686           17         38         10,620   49                4,614         5,685
2001      27,377           30         101        16,137   125               7,746         7,011
2002      33,978           36         163        19,369   264              13,630         8,506
2003      42,148           48         236        25,199   438              17,382         8,660
2004      52,925           67         329        35,372   677              19,139         8,590
2005      58,897           82         524        70,683   1,354            19,156         7,215
Source: K-rep development Agency


The cumulative average savings per member is Ksh. 19,000. In addition, the amount of
average loan averages Ksh. 7,215. The proportion of loans clients to saving clients is
38%, re-enforcing the finding that the rural folks have a higher demand for a save haven
for their money rather than for credit/borrowing.


3.1.2   Mbeu Savings and Credit Association

        Mbeu savings and credit association is another example of a community owned
model. It is promoted by the Catholic Diocese of Embu in conjunction with a foreign
donor who has a clear exit strategy. The association became operational in 2001 and
targets the Embu and Mbeere Districts. It uses the basic principles of FSA; however, the
only deviation is that it does not set up a fortified financial transaction structure ‘banking
hall’. The loan officers take the financial services to the people using motor cycles
where the groups are located. The groups meet under big trees, church compound or a
shopping center to collect money and make financial transactions such as compulsory
Ksh. 200 monthly saving, voluntary saving, loans and money transfers (school fees). The
model has also provided a channel for remitting contributions towards the National
Hospital Insurance Fund (NHIF). The association penetrates deep into the interior where
many have not succeeded or have not considered viable for banking services. In this
model, the members do not have to incur two-way transport cost to the nearest town to
access financial services thus saving time and scarce financial resource. All loans attract a
12% p.a interest rate and additional 2% for loan insurance premium.


                                                                                           14
A recent study shows that 60% of households in the remote Mbeere Districts of
Kenya deposit their savings with Mbeu Savings and Credit Association (Kibaara, et.,al,
2006). Households that save with this association live below the poverty line i.e. earn less
than one US dollar per day (Table 7).

Table 7: Where do Mbeere District Households save?
                                                      Mean Annual
                                       Mbeere         Household income     Daily earning
 Where save?                                          In Ksh.             ( in dollar/day)
 Mbeu savings and Credit Association   60%            108,676                   0.66
 Sacco                                 12%            161,825                   0.99
 Commercial bank                       28.8%          190,439                   1.16
Source: Kibaara et al, 2006


          The association has seen a tremendous growth in membership, shares and loans.
There is a 550% growth in membership from 1140 members in 2001 to 7408 in Feb
2006. In addition, there is a remarkable increase in shares, from Ksh. 1.7 million in 2001
to 30.2 million in Feb 2006. Loans increased from Ksh. 0.12 million in 2001 to Ksh.
22.48 million (Feb 2006). The tremendous increase in membership, shares and loans
implies that the association is on the path of growth. Cumulative average saving per
member is Ksh. 4,077. Only 30% of the members borrowed loans averaging Ksh. 10,000.
This again is an indication that most rural households are mainly interested in other
financial services and not only on loans/credit.
          The Mbeu model can be replicated and scaled up in other regions of the country at
low costs. For example, the foreign donor contributed only Ksh. 17 million towards
setting up of Mbeu savings and credit association.


Challenges and Opportunities of the Community Owned Model
Challenges
   i.     The insecurity in the urban areas has infiltrated to the rural areas. For example
          the FSAs reported close to 10 robberies in 2005. The monetary loss from these
          incidences has been estimated at Ksh 1 million, not to mention bodily harm to the
          security guards. The targeted robberies are attracted by money that is kept in the
          safe and yet it’s not economical to regularly transport the money to the link banks
          due to infrastructure problems. In order to avoid or reduce such losses in the


                                                                                             15
future, the agency has invested in expensive break-proof safe and insured money
        in the safe and on transit. This additional cost will be absorbed by the members of
        FSA and will certainly impact on profitability of the FSAs.
  ii.   Poor infrastructure – the rural infrastructure (road and communication network)
        is poorly developed in most rural areas. Poor road net work increases transaction
        costs of transporting monies to the link banks regularly.       For example, the
        Marsabit FSA is far from the main link-bank, thus making it almost impossible
        for the agency to monitor the activities. In addition, most FSA operates their
        activities manually because of lack of electricity.
 iii.   Policy and regulatory framework. Lack of proper policy framework to spur the
        growth of rural financial services has also been identified as a key challenge.
        These community associations offer unregulated Front Office Services Activities
        (FOSA). Incase of the collapse of the association, the members will have no
        recourse of recovering their deposits.
 iv.    Management personnel lack the necessary management skills required to run
        financial services associations. In an attempt to overcome this challenge, FSAs
        hire services of the regional management company.
  v.    Sustainability of the community owned model remains a big challenge. The
        donor has a clear exit strategy and yet the associations have not yet attained
        sustainability.
 vi.    High interest rate charged by FSA may discourage borrowing thus deny the
        revenue required for sustainability. For example Ksh. 10,000 loan at 4% p.m,
        repayable on reducing balance translates to 34 % annual interest rate. Some key
        findings from the study show that the borrowers are willing to pay the high
        interest rates due to lack of alternatives. In addition, the FSAs are owned by the
        borrowers and any income accruing from loans is disbursed inform of dividends
        at the end of the year.


Opportunities
• As the associations move towards sustainability, they can consider other sources of
  financing from the upcoming wholesalers of rural finance.


                                                                                        16
• To increase the revenue base, Mbeu saving association should extend their financial
  services such as money transfer to non-shareholders at a higher fee.

3.2     Private Commercial Bank Led Model: a Case of Emerging Indigenous Banks

        Commercial banks are potentially an important source of rural financial services.
However, most mainstream banks have undergone major restructuring such as closing
branches in the rural areas to cut down on costs and improve profits. This has left a gap in
the rural financial services which has partly been filled by the emerging indigenous banks
such as Equity bank. The equity bank model works on the principle of taking banking
services closer to the people. The bank financial services to rural clients make up 68
percent of Equity’s bank clients but with only 28 percent of the total deposit volume,
given the relatively lower average savings account size of rural clients (CGAP, 2004).
Although the bank reaches a wide range of clients, the majority of its clients are low-end
salaried workers, and micro and small businesses. In addition, the rural farming
community can access supervised short term loans for horticulture, dairy, coffee and tea
farmers.
        The bank has captured a market niche in the banking sector in Kenya of the low
income earners by addressing the perceived exorbitant price and attendant charges of loan
and savings products. The main financial services offered are savings/deposit, loans,
cheque clearance, money transfer. The deposit products are designed to target the low
income clients who cannot be considered by the mainstream banks. For example, the
operating balance on the deposit account is only Ksh. 400. Ease of opening a bank account
and all that is needed is a national identity card and the opening balance. The bank uses a
digital camera to take free passport photographs. Unlike other banks, there is no ledger fee
or maintenance fee. In addition, withdrawal charges of Ksh. 50 are affordable to the low
income clients. The interest on loan ranges between 1% and 1.5 % per month or 12% to
18% per year.
        Equity bank has focused specifically on the outreach component of mobile
banking services, and on improving service efficiency and proximity for clients.


                                                                                         17
The number of branches has increased by 55% from 20 in 2004 to 31 in 2005.
The customer base increased by 33% from 413,000 clients in 2004 to 560,000 clients in
2005, this constitutes 22% of all the deposit accounts in Kenya. Customer deposits grew
by 76% from 5.1 Ksh. billion in 2004 to 9 billion in 2005. The loan portfolio has also
grown by Ksh. 97% from Ksh 3 billion in 2004 to Ksh 5.9 Billion in 2005. Profit has
increased by 130% Ksh. 218 million in 2004 to Ksh 501 million in 2005. The ratio of
borrowing clients to total clients is 21% showing that the need for other financial services
is greater than the need for credit/loan. Average loan per client is Ksh. 42,942 while
savings Ksh 16, 071.


3.2.1   Mobile Banking with Equity Bank

        Mobile banking comes in many variants such as a Grameen loan officer visiting a
Grameen group on a motorcycle, an automated teller machine visiting a remote village to
pay out pension and provide savings facilities. Mobile banking has been widely accepted
in many countries such as South Africa, Vietnam, Thailand, Indonesia, West Africa and
Bangladesh as an innovative and low-cost distribution system of improving financial
services in remote areas where there are no formal banks (Coetzee et.,al, 2003). In most
cases the benefits outweigh the costs.
        The concept of mobile banking involves taking banking services to the rural areas
using an equipped mobile van. This is done 2-3 times in a week. Other requirements of a
mobile bank include; permanent premise, motor vehicles, at least two banking staff and
two security personnel. Currently, there are 52 Equity mobile banks in Kenya that
contributes an estimated 15% of the Equity’s banking business. For sustainability, one
mobile unit requires to have at least 1500 clients. Most mobile Equity banks reported a
clientele base of up to 3000 members. These mobiles are demand driven and in most
cases, some have converted into fully fledged branches in less than one year. The mobile
bank charges an addition to a fixed monthly charge of Ksh. 50. In most cases most
branches handle between 250-300 transactions per day on busy days. Mobile banking
services are beneficial to clients because most save money that could have been used on
transport. For example a client based in Siakago pays Ksh. 160 (2 way) for transport to
access financial services in Embu (about 40 Km). However, with the mobile bank in


                                                                                         18
Siakago, the same client is charged an extra Ksh. 50 to access his financial services via
the mobile bank. The clients also save traveling time in addition to convenience. The
estimated cost of running a mobile unit is Ksh. 70,000 per month and mobile unit
generate a monthly profit of Ksh. 100,000.


Challenges and opportunities
        The main challenge is related to infrastructure and especially when taking the
mobile services to the people in the rural areas. In most cases, a mobile van travel as far
as 60 kilometers on poor road conditions. In most cases, the mobile hubs have no
electricity therefore necessitating the use of generators. There is also a lot of congestion
in the banking halls. The other challenge is insecurity for money on transit.
        The model has demonstrated that the low income population in the rural area is
bankable and an opportunity exists for expansion. The bank has proposed to expand the
number of branches from 31 to 43 and mobile banks from current 52 to 58 by the end of
2006. The mobile banking services were first supported by the donor but now, they are
sustainable.

3.3     Government Led Rural Finance Model: a case of AFC

      This is a government owned, financed and managed model that provids credit
services mainly to large scale farmers with an objective of promoting food production in
the country. The main actors are the government, a non-bank financial institution, the
farmer and in some cases the donor. In Kenya, the model works through the Agricultural
Finance Corporation. There are 31 AFC branches country wide. The corporation has
been instrumental in the implementation of many government and donor supported
programs such as mechanization of the agricultural sector, livestock development
programs, the Guarantee Minimum Return, the Seasonal Crop Credit and the Emergency
Livestock Off-take Program. Since early 1990’s, the corporation started experiencing
operational difficulties due to poor governance, political interference and effects of
economic liberalization that led to subsequent collapse of some agricultural marketing
bodies. By 1992, the non-performing loan portfolio reached 89% (AFC, 2005). The


                                                                                         19
government and other donors stopped funding AFC and the recovered monies were used
for recurrent expenditure. AFC stopped lending officially from 1997 to 2001.
   The National Rainbow Coalition (NARC) government pledged to improve access to
rural credit and financial services from 2003. Since then, the government has
implemented some of its pledges as stated in the Strategy for Revitalizing Agriculture
(SRA) such as restructuring the operations of the corporation: The government has:-


  i. Approved AFC restructuring by appointing a new board and a chief executive
     officer.
 ii. Implemented the performance contract signed by the managers in order to improve
     management and increase accountability
 iii. Written-off accumulated debts owned by the corporation.
 iv. Released Ksh. Ksh. 1.3 billion being equity injection to be disbursed over a period
     of five years from 2003 to 2007 at Ksh. 260 million per year.
 v. Channeled the Japanese grant of Ksh. 759 million to AFC to finance the seasonal
     crop credit.


The main beneficiaries of the credit from the corporation are the large scale farmers who
own at least 5 acres of maize and wheat farms. The loan attracts an interest rate of 10%
per annum. The main credit products offered are:-
   a. Seasonal crop credit
   This loan is for production of hybrid maize and wheat in high potential gazetted
   areas. Condition for loaning includes; land must be suitable for the crop to be
   financed; Minimum acreage financed is 5 acres; client to raise 20% of the project
   cost; applicants with land not owned must provide a lease note of not less than 3
   years, registered by the local land register; payment period is within 12 months (one
   installment) and for each loan 25% of the loan funds is retained for harvesting. The
   maximum loan disbursed is Ksh. 3.3 million.
   b. Development loans
   These include machinery, water development, livestock development and fisheries.
   The repayment period for development loans is 3 to 5 years.


                                                                                      20
c. Cash Crop Loans such as tea, coffee, sugarcane, pyrethrum, cashew nuts, citrus,
       mango trees and bananas. Mainly for Crop establishment; Crop maintenance;
       processing equipment, operating costs.
       d. Horticulture and floriculture loans
       e. Oil crops loans
       f. Value addition loans at 15%


            Table 8 shows trends in development and seasonal crop credit. As at 2004/2005
year, the corporation had advanced a total of one billion Kenya shilling to 5253 farmers.
Seasonal loans account for 52% of the total loans, while development accounts for 48% .
For wheat and maize seasonal crop credit, the beneficiaries receive Ksh. 11,000 per acre
of land. On the other hand, the minimum amount disbursed is Ksh. 50,000 for the
development loans.


Table 8: AFC Development and Seasonal Credit, 1996 to 2005
                        Total development3
                             loans (SS, LS,                                  Total loan         Average loan/beneficiary
                Year              ranches)      Seasonal crop4 credit     ( Dev+ Seasonal)              In Ksh
                                                           Amount in              Amount in
                                                                                                        5                  6
                         No.   Amount in 000'     No.         000'       No.         000'     Small scale     Large scale
              1995/96    112        202,877      831        142,228      943       345,105      96,364         2,111,223
              1996/97    283        290,863        0                    283        290,863      40,307         1,590,458
              1997/98    133          87,941       0                    133         87,941     133,333          675,357
              1998/99    105        157,872        0                    105        157,872     150,000         1,544,333
              1999/00    117        130,728        0                    117        130,728     236,667         1,190,722
              2000/01     56        112,638        0                     56        112,638     182,500         2,510,182
              2001/02      1             225       0                      1          225       225,000             0
              2002/03    590          90,772       0                    590         90,772     100,824          635,017
              2003/04   2314        187,030      2077       338,612     4391       525,642      15,464          503,452
              2004/05   2663        497,991      2580       537,624     5243      1,035,615    152,023          499,591
    Average loans                                                                              133,248         1,126,034
Source:AFC


            Prior to the year 2002, the corporation advanced 98% of the development loans to
the large scale farmers. But after the year 2003, lending to large scale farmers averages
36%. AFC’s average loans to small scale farmer averages Ksh. 130,000 while the large
scale averages Ksh. 1.1 million.

3
  Dairy, poultry, pigs, farm infrastructure, farm mechanization etc
4
  Seasonal credit loans –specifically for production of marketed wheat , maize and potatoes
5
  Small scale loans have a maximum loan ceiling of Ksh. 200,000 and a minimum of Ksh. 50,000
6
  Large scale loans with a minimum loan of Ksh. 200,000 and a maximum of Ksh. 1 million


                                                                                                            21
Challenges and opportunities
Challenges
      i.   Prohibitive loan transaction costs for small scale farmers, for example if AFC
           was to lend a supervised seasonal loan to a small scale borrower amounting to
           Ksh. 11,000 to plant maize on one acre, the loan transaction costs before
           repayment of interest would be Ksh. 8,715 (Ksh. 2500 application fee, Ksh. 6050
           conveyance fee and Ksh. 165 commitment7 fee). This shows that the cost of
           loaning to individual small scale farmers is too high.
     ii.   Bloated workforce. Between 1997 and 2002, the corporation carried out an
           organizational and staff restructuring, reducing the branch network by 37% (from
           49 to 31) and staff members reduced by 53% i.e. from 1200 to 570 workers.
           However further analysis shows that 64% of the current staff is composed of
           non-technical (support) staff, leading to lots of inefficiencies in the system. This
           is an indication that the staff restructuring is still not efficient and the support
           staffs should be reduced. Maybe its time the government considered outsourcing
           some of the non-core activities.
    iii.   Delayed payment for produce delivered to the National Cereals and Produce
           Board (NCPB). The beneficiary of the seasonal crop credit loan signs an
           irrevocable order (IRO) with AFC to deliver maize to the NCPB, which in return
           deducts the loaned amount and the balance is paid to the producer. However, the
           IRO cannot be strictly enforced in a liberalized market and producers can sell
           their maize elsewhere and repay the loan. Producers who sell their produce
           through the board experience incidences of delayed payment. Currently only
           about 30% of farmers sell grains through NCPB while 70% sell through other
           channels. This makes the loan recovery a tedious process.
    iv.    Sustainability. In the past, AFC has solely relied on the government and donor
           agencies for funding. However, the corporation is expected to attain some level
           of sustainability. Several AFC branches visited acknowledged that it will be
           difficult to operate without the Government support given the low interest rates
           charged on loans.

7
    Commitment fee is 1.5% of the loan amount


                                                                                            22
Opportunities
i. Value addition loans. Traditionally, the corporation has concentrated on financing for
   primary production.    Some branches have started lending to borrowers for value
   addition of agricultural products such as asset financing for a borrower to set up an
   abattoir, a tea nursery and Small and Micro Enterprise (SME) in milk processing.
ii. Wholesale/group lending approach.. This involves lending to organized groups. The
   group must be registered, must have management structure, must have a history of
   success- (must have undertaken an activity together at least for the last three years),
   must provide security e.g. title deed or deposit 15% of the loan amount with AFC as
   security.
 The corporation intends to reduce the cost of offering credit by implementing the
 wholesaling/group lending as stipulate in its Strategic Plan 2005-2010. The corporation
 proposes to reach 68% (340,000) clients through wholesaling/group lending of credit to
 MFIs, co-operatives and organized registered groups. In addition, it intends to retain 32%
 (160,000) of its clientele for retailing. The study shows that some branches have initiated
 the group lending approach. For example in the four branches visited by the research
 team, at least 8 groups/cooperatives were in the loan appraisal stage. In total, the loans
 will benefit at least 16,000 individuals (150% more clients than the current retail level)
 with a total of Ksh. 42 million, thus this is a more efficient and effective way of
 improving access to rural credit. On average, each member of the wholesaling group will
 probably get a loan of Ksh. 18,721 per member, this is about 70% lower than the current
 amount loaned to the AFC ‘small scale farmers’.


 3.4   The Donor Guarantee-Input Supply Model
 The model has two components, i.e. the stockists credit guarantee system and the credit
 voucher system.
        A guarantee is a promise to repay credit or a loan incase of default. This is done
        to promote private sector lending to decrease credit risks, build lending capacity
        and potential for sustained activity and address a market imperfection.


                                                                                         23
3.4.1      Stockists Credit Guarantee System

           The credit guarantee system is a model of building lending capacity between the
commercial manufacture of agricultural input and the input stockists. The rural
stockists/shopkeepers are an important source of credit for agricultural inputs to the rural
areas. Data from the 2004 Tegemeo survey shows that rural stockists provide 4 % to 7%
of credit in-kind. The rural stockists face challenges such as lack of the required capital to
meet the input requirements of the producers, lack of knowledge on inputs and business
skills. This has contributed to low usage of agricultural input that translates to low
agricultural productivity. The overall objective of the guarantee system is to improve
agricultural productivity and incomes of smallholder farmers in Western Kenya8. The
central strategy is to strengthen commercial linkages between enterprises in the private
sector distribution system, from input supply companies to regional wholesalers to rural
stockists- from whom farmer’s access inputs – in order to increase the range and quantity
of inputs available. This will increase the smallholder farmers’ sustainable access to and
use of agricultural inputs and services (including dairy) by improving their availability.


How does the credit guarantee system work?
           The credit guarantee system involves the following parties; the donor, agricultural
input stockists/wholesaler, a local non-governmental organization (NGO) in this case
Agricultural Market Development Trust and an input manufacturing company. To
increase the creditworthiness of the input stockist, the donor through an NGO offers
seven modules on business training courses at a cost of Ksh. 500 per module. As at
January, 2006, 138 stockists had been trained. The NGO avails the list of trained stockist
to the input company. The input manufacturing company then enters into agreement with
the trained stockist to supply inputs (companies and wholesalers) on credit. The donor
guarantees to pay 50% of the default loan balance and the company will absorb the other
half. The guarantee fund worth over US $40,000 (Ksh 2.9 million) is held by the donor.
The program was piloted in 2005 in Western Kenya.


8
    Kisumu, Siaya, Bungoma and Vihiga districts


                                                                                             24
As at January, 2006, five companies had received a revolving credit9 guarantee of
enabling them to extend credit valued at Ksh. 866, 364 to two wholesalers who in turn
guaranteed 50 new stockists who have received inputs worth Ksh. 3.6 million on credit.
There has been excellent repayment, with only one defaulter, amounting to Ksh. 222,
285. The organization has already paid for 50% default though the process of repayment
is lengthy, taking approximately 2-3 months.
           A recent study shows that the effect of the credit guarantee has trickled down to
the farmer. Stockists affiliated to the credit guarantee system are doing better than the
non-affiliated stockists in credit provision; about 34% stockists gave credit to farmers
compared to 29% of the non-affiliated stockists (AGMARK, 2006).


           Challenges and Opportunities
           The credit guarantee fund of $40,000 is limited and can only guarantee limited
beneficiaries. On the other hand, the ‘free things mentality’ among the people is a
problem towards repayment of credit, which might slow down repayment rates.
           The model could be replicated and scaled up to other parts of the country where
many stockists need empowerment in business skills and credit services. The trained
stockist are now more attractable to banks and other financial institutions and can
therefore benefit from the upcoming wholesaling and group lending financiers such as the
AFC.


3.4.2      Credit Voucher System:Rice Production in Ahero Irrigation Scheme

           The credit voucher system is a model of providing agricultural inputs on credit to
farmers.       The principle involves provision of input using a combination of a credit
voucher and cash (where vouchers cannot be used). The voucher reduced the likelihood
of credit diversion to other life cycle needs. Provision of credit vouchers is staggered
during the production. The model involves a number of actors i.e. the donor, a micro
finance institution, SACCO, input stockists, government, and buyer of the agricultural


9
    Credit inform of fertilizer, seeds, crop protection chemicals and animal feeds.


                                                                                          25
10
output. The credit voucher system otherwise referred to as             Mkulima loan is being
piloted in Ahero rice scheme since March 2005.
           The donor guarantee to repay offers a 50 % of any defaulted loans. The MFI-
SAGA Thrift and Enterprise Promotion Limited (STEP) is a rural financial organization
that facilitates the delivery of financial services to people living in the Kenyan districts11
around Lake Victoria region. It comprises of SAGA SACCO and SAGA Thrift and
Enterprise Promotion Limited (STEP), the later manage the affairs of the SACCO.
SAGA operates a Front Office Service Activities (FOSA). Members buy shares from the
SACCO at Ksh 25 with a minimum of 4 shares per month (Ksh 100 per month). The
shareholder can then access loan and savings products. All loans attract an interest rate of
2% per month with a rebate of 0.5% on timely repayment. The 1.5% of the interest
earned is shared equally between the SAGA Sacco and the management company –
STEP.
           The farmers who are members of the SACCO get mkulima loans up to three times
the amount of shares held in the SACCO. The loan attracts a 2% per month interest rate
or 24% p.a. In addition, the beneficiaries pay an insurance fee of 2% of the loan amount.
No tangible collateral is required. All loans are secured by SACCO members and
guarantors savings. The 75% of the mkulima loans is disbursed via the credit vouchers
and 25% through cash vouchers. Cash vouchers cover, transplanting, weeding and
harvesting and credit vouchers include but not limited to cost of ploughing and
rotavation, seeds, fertilizers, chemicals and gunny bags.           During the 2005 crop
production year, the organization disbursed a total of Ksh. 6.7 million to 617 farmers in
Ahero rice irrigation scheme.
           The farmers obtain the vouchers from MFI-SAGA and submit the vouchers to the
stockists for the supply of the inputs/services, the stockists then remit the voucher to
SAGA for payments. All farming activities in the scheme are supervised by the credit
officers; this ensures that credit is used for the intended purposes. The disbursement of
the vouchers is staggered over the production period and the loan officers supervise the
farmers to ensure that the inputs and cash are not diverted. The loan for irrigated rice is


10
     Meaning a farmer loan
11
     Kisumu, Bondo, Busia and Rachuonyo


                                                                                           26
repaid using the balloon payment method (deducted from sale of produce-check off
system) upon sale but for horticulture there is a grace period of 3 months. The farmer is
expected to contribute towards the cost of production by meeting the labor and transport
costs. The maximum loan is Ksh. 17,500 per acre of rice and Ksh. 20,000 for
horticultural crops. On average each farmer gets a loan of Ksh. 10,630.
        Rice yield ranges between 20 -30 bags per acre leading to an estimated net profit
of Ksh. 8,600 /acre. Given that most farmers cultivate 4 acres, then majority of farmers
take home between Ksh. 30,000 and Ksh. 120,000 as net profit for each growing season.
The ‘high interest rate’ does not deter the farmers from borrowing. Decomposition of the
cost of capital as a fraction of overall cost of production reveals that the cost of capital
accounts for only 7% of the total costs.      Farmers in the scheme are now better off
economically and there is a spill over effect in the business community which is now
more vibrant and has recorded improved sales/business.
        The government has contributed to the revival of the once dead Ahero scheme by
reviving the scheme in 2005 following a Ksh. 20 million intervention bankrolled by the
state and the Food and Agriculture Organization (FAO) that saw two pumps (with a
capacity to handle 600 liters of water per second) installed and its 10 kilometer irrigation
canals rehabilitated. The cost of water amounts to Ksh. 3,100 per acre and it is paid in
advance directly to the National Irrigation Board (NIB) by the micro-finance institution
before planting. The output market prices are negotiated before planting.


Challenge and opportunities
The model has incorporated Front Office Service Activities (FOSA), whose legal status is
not very clear.


However, there exist a big opportunity for expansion into other rice schemes. For
example, the management company is replication the model in Bunyala rice scheme.
Since the model has worked so well and the default rate is minimal, the management
company did not need the donor credit guarantee.


                                                                                         27
3.5     Managed SACCO: a case of ‘Beach Banking’ Model

        This model involves a SACCO and a micro finance institution (in this case, MFI-
SAGA Thrift and Enterprise Promotion Limited) which overseas the management of the
SACCO at a fee recovered from paid up interest rates. Members in the SACCO buy
shares which are used as collateral for leveraged loans. A share is valued at Ksh 25 with a
minimum of 4 shares per month (Ksh 100 per month).
        The model operates eight service points otherwise referred to as ‘Beach banks’
along Lake Victoria beaches in Kisumu and Bondo District. The motivation behind this
innovation is to contribute towards poverty alleviation among the fisher folks. Kenya
earns about Ksh 6.9 billion annually from fishing. However, with such large amounts of
money, there has been insignificant impact of fisherman’s physical and economic
lifestyle, what a paradox?     Most of the fishermen along Lake Victoria have been
exploited by the middle men and others squander their hard earned cash due to lack of
banking institutions.
        The service points have front offices that operate like conventional banks,
providing saving and credit products. It has a current membership of 3,000 clients with a
total savings of Ksh. 15 million. The beach ‘banks’ contribute 36% (Ksh. 15 million out
of Ksh. 42 million) of the total savings in MFI-SAGA. On average each beach ‘banker’
has a savings of Ksh. 5000.
        About 55% of the beach bank savers are female fish mongers and the rest are
male fishermen. Previously, most of the female fishmongers were initially constrained by
lack of capital for business transactions. However, the beach banks have facilitated, thus
reducing financial dependency on fishermen.


3.5.1   Market Day Loans

The beach ‘bank’s offer a variety of loan products, the market day loans are a special
loan facility, a very short-term loan for business people dealing with fast moving goods
with quick returns. The loan is processed within the same day and is payable in 5 days
with 2% interest rate. The leverage ratio is 1:2. In addition, a borrower pays a 2%
insurance premium incase of death. This product is popular among fishmongers and


                                                                                        28
traders. This is one of the most innovative rural finance product developed by MFI-
SAGA. The market day loans account for 62% of the total beach ‘bank’ loans. Members
can borrow as low as Ksh. 200 per visit and in addition; they can borrow for a number of
times in a day. The cumulative average loan amount disbursed to the beach bankers is
about Ksh 18,152. The ratio of borrowers to savers is 30%.


Challenges and Opportunities
Insecurity remains a big challenge for the success of the beach ‘banks’. There have been
cases where the service points have been broken into and large sums of monies stolen. In
addition, the migratory nature of the fishermen reduces the business activities thus
affecting the performance of the beach ‘banks’. The beach ‘banks’ have a potential for
expansion, currently only reaching 3,000 fishmongers but there exists a potential of
12,000.


3.6     Informal Group Based Rural Financing Model

Informal systems are an important source of basic rural financial services, table 3 showed
that these models provide between 10% to 12% of the agricultural credit, the contribution
could even be higher for the non agricultural credit The informal group based rural
finance models come in various forms such; merry-go- round, Mata Masu Dubara
(MMD), table banking and Rotating Savings and Credit Association. The main principle
behind the informal system lies in group formation.


3.6.1   Merry go –round
Merry-go-round is composed of less than 20 members who contribute a specified amount
of money regularly. Members vote on who is to be given lump sum amount. The merry
go –rounds are most common with women mainly for the purposes of buying household
items. This model does not charge any interest rate.


3.6.2   Mata Masu Dubara (MMD)
The Mata Masu Dubara (MMD) model first originated from Niger in West Africa and it
is currently being piloted in Rachuonyo, Homabay, Migori and Suba District of Kenya


                                                                                       29
under CARE international which offers training to groups on self selection, groups
formation, leadership, constitution and record keeping. The model works on the group
principle; the members contribute regularly towards an objective such as purchase of
agricultural inputs for the planting season. Loans are also offered at low interest rates. In
addition, members save as low as Ksh. 300 in a month. There are no other charges paid
by the members such as loan application, insurances and membership fee. As at
September 2005, there were 163 MMD groups with a total membership of 2,560 who had
mobilized a saving of Ksh. 2.7 million, a total of Ksh 4.5 had been disbursed as loans;
Ksh. 934,000 had been shared out among the group members. Loan amounts ranged
between Ksh 50 and Ksh 10,000. The money accumulates for a specified period after
which the members divide the money and the group disintegrates.


3.6.3   Table ‘Banking’
        Table ‘banking’ is a unique rural finance concept that is widely practiced in
Western Kenya especially in Bungoma District. It involves group members who come
together and make regular contributions. The members contribute shares to a revolving
fund, which is loaned to members. During the meetings, the members who have loans
make their payment plus the interest, and then every member makes the agreed
contribution. All the cash collected is intended to be loaned out in the same meeting. All
the transactions are recorded and every member is required to obtain a loan. The loans do
not require collateral and there is a high degree of accountability and trust since all the
money transactions are done on the table in the presence of all members. The members
are willing to take loans at high interest rate for they know they stand to gain from the
interest accruing from the loans. The interest rate varies from group to group but ranges
between 10 to 20 % per loan period. The repayment period is short-term usually monthly
but varies with the group.


3.6.4   Rotating Savings and Credit Associations (ROSCAs)
        The Rotating Savings and Credit Association (ROSCAs) variant is an advanced
version of merry go round where the members contribute some monthly shares and also
disburse loans to members. They have their roots in the traditional mutual guarantee


                                                                                          30
system. The actual number of ROSCAS in Kenya is not known, however these
associations provide credit to many low-income people. A typical ROSCA involves a
group of 5 to 30 members. The Merry go round is embedded in the model. The
association offer short-term loans to members at interest rates that range between 5-20%
per period. Some ROSCAs and especially in Rift Valley are financially very strong and
have managed to buy assets such as land and buildings.


3.7       Group Membership in Rural Kenya

          Group formation is a prerequisite for the formation of community owned rural
finance models. Tampa data 2004 shows that 78.8% of the household had at least one
member involved in some form of a group. 50.2% were in the informal/self help group,
34% in producer co-operatives, 13.1% in savings and credit co-operative and 2.5% in
multipurpose co-operatives. Table 9 shows the distribution of the groups by types by
agro-regional zones.


Table 9: Group Type by Zone, 2004
                                                               Group Type
                                     Producer       Multi-purpose    Savings & Credit   Self help
 Zone                                Cooperatives   cooperatives     cooperatives       groups           Total
 Coastal Lowlands                    17.80                           4.10               78.10            100
 Eastern Lowlands                    17.30          0.90             7.80               74.00            100
 Western Lowlands                    20.30          1.30             6.30               72.20            100
 Marginal Rain Shadow                27.90          1.60             4.90               65.60            100
 High Potential Maize Zone           37.30          2.50             10.70              49.50            100
 Western Transitional                68.70                           4.50               26.90            100
 Western Highlands                   69.30                           5.80               24.80            100
 Central Highlands                   71.20          3.60             3.10               22.00            100
Source: Tegemeo household survey, 2004

Over 70% of the self help groups are in the low income zones of Kenya. These are the
zones that are least served by the formal financial systems. An implication that there
exist an opportunity for the community mobilized models of rural financing to thrive
better in these areas. In addition, these groups can benefit from the current group lending
through the government corporation.


                                                                                                    31
3.8      A Comparative Analysis of the Models

      The following section looks at a brief analysis of the described models of rural
finance. Table 9 outlines a comprehensive description of these models. Rural financing
model are designed to meet different objectives; the Government led model and Donor-
guarantee credit voucher system are designed to increase food security in the country.
The emerging bank model is mainly for expansion of rural financial services. The
community owned model and managed Saccos-beach banking models are mainly
designed for poverty reduction.
      Compared to other models of financing, the emerging indigenous banks have the
greatest outreach in the rural areas partly associated to mobile banking, affordable rates
and reduced bureaucracy.        The community owned models have the second largest
clientele outreach partly because of the group masses. However, this model has a great
potential for outreach.     While AFC has the lowest, there exist potential for greater
outreach under the group lending. The model is unlikely to meet a large clientele since
only a small proportion of Kenyan land is under irrigation.
      Estimated annual household income generated from Tampa 2004 household survey
shows that AFC clientele are above the poverty line as defined by the dollar a day
(averages US $1.4 per day. Although the emerging indigenous banks have a greater
clientele outreach, the model is mainly reaching the middle income group who are
slightly above the poverty level (averages $ 1.2 per day). The community owned rural
finance model, the donor-guarantee credit voucher system and the beach banking models
reach the rural poor of low land regions. The beneficiaries earn a range US $ 0.5 to US
$0.8 per day. This implies that any policy that promotes development of the community
owned models is most likely to have a greater impact in improving access to rural
financial services.
      The community models provide the lowest amounts of loans averaging from Ksh.
7000 to Ksh. 10,000 per beneficiary per year, indication that the models serve the poor in
the community. The beach banking disburses slightly higher amount of loans partly
because of the market day loans.


                                                                                         32
Table 10: A comparative Analysis of selected Models
 Indicator                           Government led         Commercial Bank                       Community Owned Model:              Donor Guarantee         Managed Sacco
                                     Model: AFC             Model                              FSA                        Mbeu        Input Supply System     (Beach banking
                                                                                                                                      (Voucher system )       model)
 Objective                           Food Security          Profit making                 Poverty reduction       Poverty reduction   Food security           Poverty reduction
 Interest rates per annum            10%                    12% to 18%                         20% to 34%                12%          24%                     24%
                                                                      **
 Outreach ( no. of clients)          5,200                  380,800                              70,000                  7,400        617                     2,700
 Average annual * HH
 income in Ksh                       260,489                227,103                             159,130                159,130        99,317                  99,317
 Per capital income in US
 Dollar per day                      1.4                    1.2                                   0.8                     0.7         0.5                     0.6
 Average loans per client            320,000                42,942                               7,215                  10,000        10,000                  18,153
 Insurance on loans                  No                     Yes                                   Yes                     Yes         Yes                     Yes
 % loaned members***                 N/A                    21%                                   38%                    30%          N/A                     30%
 Unit cost of lending 1 Ksh          0.5                    0.22                                  0.13                    0.08        0.09                    0.02
 Average Savings per client          N/A                    16,071                               19,000                  4,077        3,635                   5,797
 Sustainability                      Low                    High                                Average                Average        Average                 High
 Source of funds                     Government             shareholders                       shareholders/interest rates/donor                shareholders/interest rates


Source: Author’s computation;
* Annual household income and dollar per day computed from TAMPA household survey, 2004
** 60% of the total clients,


                                                                                                                                                                        33
The government led model and the emerging bank provide relatively higher loan
amount The results show that across these models, the proportion of rural borrowers
ranges between 30% and 39%, reinforcing the fact that most households prefer to have
access to a saving facility rather than a borrowing facility. This is also supported by
Tampa household survey 2004 on agricultural credit, which showed that only 39% of the
households tried to obtain any credit. The unit cost of lending ranges between Ksh. 0.02
and Ksh 0.5. AFC lending is the most costly; each shilling loaned out incurs an expense
of Ksh 0.5. The community owned models are low cost models. Insurance on loans
ensures recovery of loans incase of the death of a beneficiary. Results show that all the
financiers with and exception of AFC including the community based models insures the
loaned amount, insurance averages at 2% of the loaned amounts.
        The interest rates vary across the models. AFC has the lowest interest rate of 10%
per annum. FSAs have the highest interest rates ranging from 20% to 34% per annum.
The interest rates by FSA are set by the shareholders, the interest rates are highest partly
because of lack of alternative to other financial institutions, to increase monthly revenue
as the FSA attempts to move towards sustainability and finally earned interest is paid as
dividends at the end of the year. Where markets and other support services exist, high
interest rates do not deter borrowing because there are reduced covariant risks.


3.8.1   Sustainability and Outreach
        Most of these models have an external source of funding; in most cases the donor
has a clear exit strategy. However the issue of financial sustainability remains a big
challenge.
        AFC is mainly supported through a budgetary allocation and in some cases the
donor. Given its current form, the corporation has low sustainability and low outreach.
However, the implementation of group lending will most likely improve outreach, but the
issue of sustainability will be uncertain because it will depend on the ability to recover
loaned amount to the registered groups. Figure 3 demonstrates an outreach and
sustainability frontier.
        The community owned models have a high outreach and low sustainability.
Some attempts made to move towards sustainability are; piloting of regional management


                                                                                         34
companies by FSA, withholding dividends on interest rates by Mbeu savings and credit
association. Financial sustainability will require an increase in shareholding membership
and improved management.
       The emerging indigenous banks demonstrate the high outreach and high
sustainable model because the operating expenses are sourced mainly from the local
shareholders capital and earned interests. The rapid expansion is demand driven.
       The Donor guarantee–input credit voucher system has high sustainability as
evidenced by the fact that the MFI promoting the voucher system has expanded to
Bunyala without the donor guarantee. However, outreach is low because in Kenya, the
proportion of irrigated land is very low. The development of irrigation scheme would
provide and opportunity for the expansion of the voucher system.
       The Managed Sacco-beach ‘banking’ model has high sustainability because it
lends from the voluntary and compulsory savings from local shareholders. Currently, it
has low outreach because of the few service points. There is a potential for expansion to
cover 12,000 beach bankers. The informal models have high sustainability and high
outreach.
Figure 3: Outreach and Financial Sustainability Frontier
                                       Sustainability
                                       frontier


                                                     Private commercial bank
        High                                         led model- a case of
                             Community               indigenous banks
                             Owned Models

                                                                             Outreach
 Outreach                                                                    frontier

        Low                                              Donor guarantee –input
                                                         Supply
                                                         (Credit Voucher System)
                  AFC


                      Low                                          High
                                        Sustainability


                                                                                        35
3.9      Future Scenario of Rural Financing
      This section looks at the future scenario of rural financing. Given this background,
most likely, the mainstream banks will concentrate on the niche markets in the urban
centers. The emerging indigenous banks will continue to expand in the rural areas.
      The AFC will most likely to transform itself in order to survive. Wholesale and group
lending will enable the corporation to reach more clients reach at lower costs.
      The MFIs will continue to serve the middle and upper income earners and will be
transforming themselves into commercial banks. They will be profit motivated. Their
transaction charges will go up as they go national.
      The rural SACCOs, ROSCAS, self-help groups will continue serving the rural people
and will transform themselves into community based micro-credit units. This will most
likely reduce unemployment in the rural areas. We are likely to see some form of urban-
rural migration as some skilled workers will probably move to the rural areas to work in
the community based micro-credit units. The credit guarantee works on limited scale and
may not address the needs of the masses in the future


                                                                                        36
Farmers' Agribusiness Training Course: Module 1 Supplementary Reading. Rural Financial Services in Kenya: What is Working and Why?

Más contenido relacionado

Similar a Farmers' Agribusiness Training Course: Module 1 Supplementary Reading. Rural Financial Services in Kenya: What is Working and Why?

Farmers' Agribusiness Training Course: Module 1 Supplementary Reading. Agricu...
Farmers' Agribusiness Training Course: Module 1 Supplementary Reading. Agricu...Farmers' Agribusiness Training Course: Module 1 Supplementary Reading. Agricu...
Farmers' Agribusiness Training Course: Module 1 Supplementary Reading. Agricu...PiLNAfrica
 
An Assessment of Agricultural Policy and Regulatory Constraints to Agribusine...
An Assessment of Agricultural Policy and Regulatory Constraints to Agribusine...An Assessment of Agricultural Policy and Regulatory Constraints to Agribusine...
An Assessment of Agricultural Policy and Regulatory Constraints to Agribusine...The Rockefeller Foundation
 
Agricultural Production Loan Project Proposal
Agricultural Production Loan Project ProposalAgricultural Production Loan Project Proposal
Agricultural Production Loan Project ProposalSu Myat Naing
 
Agricultural advisory services_uganda
Agricultural advisory services_ugandaAgricultural advisory services_uganda
Agricultural advisory services_ugandaWilly Mutenza
 
Strategies for a High Performance Revenue Cycle
Strategies for a High Performance Revenue CycleStrategies for a High Performance Revenue Cycle
Strategies for a High Performance Revenue Cyclekarthik Venkilot
 
9059_GPF Learning Series_Zambia v4 (1)
9059_GPF Learning Series_Zambia v4 (1)9059_GPF Learning Series_Zambia v4 (1)
9059_GPF Learning Series_Zambia v4 (1)Victoria Cabral
 
Mainstreaming Governance in Country Programs: Insights from the Governance Pa...
Mainstreaming Governance in Country Programs: Insights from the Governance Pa...Mainstreaming Governance in Country Programs: Insights from the Governance Pa...
Mainstreaming Governance in Country Programs: Insights from the Governance Pa...Victoria Cabral
 
Challenges and Changes The Political Economy of National Development Banks in...
Challenges and Changes The Political Economy of National Development Banks in...Challenges and Changes The Political Economy of National Development Banks in...
Challenges and Changes The Political Economy of National Development Banks in...Mondher Khanfir
 
fr2013_02_improving_marketing_efficiency_posthar_16289 (2)
fr2013_02_improving_marketing_efficiency_posthar_16289 (2)fr2013_02_improving_marketing_efficiency_posthar_16289 (2)
fr2013_02_improving_marketing_efficiency_posthar_16289 (2)Mrs Serah Koko
 
HBS Management Challenge - Telemedicine for Prisons Final
HBS Management Challenge - Telemedicine for Prisons FinalHBS Management Challenge - Telemedicine for Prisons Final
HBS Management Challenge - Telemedicine for Prisons FinalSitul Shah
 
Telemedicine for Prisons Final_External
Telemedicine for Prisons Final_ExternalTelemedicine for Prisons Final_External
Telemedicine for Prisons Final_ExternalSitul Shah
 
Martin otundo research paperDETERMINANTS OF IMPLEMENTATION OF CASH TRANSFER P...
Martin otundo research paperDETERMINANTS OF IMPLEMENTATION OF CASH TRANSFER P...Martin otundo research paperDETERMINANTS OF IMPLEMENTATION OF CASH TRANSFER P...
Martin otundo research paperDETERMINANTS OF IMPLEMENTATION OF CASH TRANSFER P...Martin Otundo
 

Similar a Farmers' Agribusiness Training Course: Module 1 Supplementary Reading. Rural Financial Services in Kenya: What is Working and Why? (20)

Farmers' Agribusiness Training Course: Module 1 Supplementary Reading. Agricu...
Farmers' Agribusiness Training Course: Module 1 Supplementary Reading. Agricu...Farmers' Agribusiness Training Course: Module 1 Supplementary Reading. Agricu...
Farmers' Agribusiness Training Course: Module 1 Supplementary Reading. Agricu...
 
An Assessment of Agricultural Policy and Regulatory Constraints to Agribusine...
An Assessment of Agricultural Policy and Regulatory Constraints to Agribusine...An Assessment of Agricultural Policy and Regulatory Constraints to Agribusine...
An Assessment of Agricultural Policy and Regulatory Constraints to Agribusine...
 
Agricultural Production Loan Project Proposal
Agricultural Production Loan Project ProposalAgricultural Production Loan Project Proposal
Agricultural Production Loan Project Proposal
 
Agricultural advisory services_uganda
Agricultural advisory services_ugandaAgricultural advisory services_uganda
Agricultural advisory services_uganda
 
Main Report
Main ReportMain Report
Main Report
 
Strategies for a High Performance Revenue Cycle
Strategies for a High Performance Revenue CycleStrategies for a High Performance Revenue Cycle
Strategies for a High Performance Revenue Cycle
 
Final Manual Addendum.pdf
Final Manual Addendum.pdfFinal Manual Addendum.pdf
Final Manual Addendum.pdf
 
Final Manual Addendum.pdf
Final Manual Addendum.pdfFinal Manual Addendum.pdf
Final Manual Addendum.pdf
 
MMFI_R_Report
MMFI_R_ReportMMFI_R_Report
MMFI_R_Report
 
Rural Territorial Dynamics Program – Final Report 2007-2012
Rural Territorial Dynamics Program – Final Report 2007-2012Rural Territorial Dynamics Program – Final Report 2007-2012
Rural Territorial Dynamics Program – Final Report 2007-2012
 
9059_GPF Learning Series_Zambia v4 (1)
9059_GPF Learning Series_Zambia v4 (1)9059_GPF Learning Series_Zambia v4 (1)
9059_GPF Learning Series_Zambia v4 (1)
 
Mainstreaming Governance in Country Programs: Insights from the Governance Pa...
Mainstreaming Governance in Country Programs: Insights from the Governance Pa...Mainstreaming Governance in Country Programs: Insights from the Governance Pa...
Mainstreaming Governance in Country Programs: Insights from the Governance Pa...
 
Challenges and Changes The Political Economy of National Development Banks in...
Challenges and Changes The Political Economy of National Development Banks in...Challenges and Changes The Political Economy of National Development Banks in...
Challenges and Changes The Political Economy of National Development Banks in...
 
Addendum-1.docx
Addendum-1.docxAddendum-1.docx
Addendum-1.docx
 
fr2013_02_improving_marketing_efficiency_posthar_16289 (2)
fr2013_02_improving_marketing_efficiency_posthar_16289 (2)fr2013_02_improving_marketing_efficiency_posthar_16289 (2)
fr2013_02_improving_marketing_efficiency_posthar_16289 (2)
 
HBS Management Challenge - Telemedicine for Prisons Final
HBS Management Challenge - Telemedicine for Prisons FinalHBS Management Challenge - Telemedicine for Prisons Final
HBS Management Challenge - Telemedicine for Prisons Final
 
Telemedicine for Prisons Final_External
Telemedicine for Prisons Final_ExternalTelemedicine for Prisons Final_External
Telemedicine for Prisons Final_External
 
Enhancing the Development Impact of the SGSY
Enhancing the Development Impact of the SGSYEnhancing the Development Impact of the SGSY
Enhancing the Development Impact of the SGSY
 
Finland rural
Finland ruralFinland rural
Finland rural
 
Martin otundo research paperDETERMINANTS OF IMPLEMENTATION OF CASH TRANSFER P...
Martin otundo research paperDETERMINANTS OF IMPLEMENTATION OF CASH TRANSFER P...Martin otundo research paperDETERMINANTS OF IMPLEMENTATION OF CASH TRANSFER P...
Martin otundo research paperDETERMINANTS OF IMPLEMENTATION OF CASH TRANSFER P...
 

Más de PiLNAfrica

Gastric Lavage Procedure Animation
Gastric Lavage Procedure AnimationGastric Lavage Procedure Animation
Gastric Lavage Procedure AnimationPiLNAfrica
 
Game-based Assessment Template detailed specification
Game-based Assessment Template detailed specificationGame-based Assessment Template detailed specification
Game-based Assessment Template detailed specificationPiLNAfrica
 
Game-based Assessment Quiz Template
Game-based Assessment Quiz TemplateGame-based Assessment Quiz Template
Game-based Assessment Quiz TemplatePiLNAfrica
 
Fostering Cross-institutional Collaboration for Open Educational Resources Pr...
Fostering Cross-institutional Collaboration for Open Educational Resources Pr...Fostering Cross-institutional Collaboration for Open Educational Resources Pr...
Fostering Cross-institutional Collaboration for Open Educational Resources Pr...PiLNAfrica
 
Ethics and Integrity in Data Use and Management Detailed Specifications
Ethics and Integrity in Data Use and Management Detailed SpecificationsEthics and Integrity in Data Use and Management Detailed Specifications
Ethics and Integrity in Data Use and Management Detailed SpecificationsPiLNAfrica
 
EMR Implementation Considerations Slides
EMR Implementation Considerations SlidesEMR Implementation Considerations Slides
EMR Implementation Considerations SlidesPiLNAfrica
 
Developing and using Open Educational Resources at KNUST
Developing and using Open Educational Resources at KNUSTDeveloping and using Open Educational Resources at KNUST
Developing and using Open Educational Resources at KNUSTPiLNAfrica
 
Data Quality: Missing Data detailed specification
Data Quality: Missing Data detailed specificationData Quality: Missing Data detailed specification
Data Quality: Missing Data detailed specificationPiLNAfrica
 
ata Management Ethics Resources
ata Management Ethics Resourcesata Management Ethics Resources
ata Management Ethics ResourcesPiLNAfrica
 
Childhood TB: Preventing childhood tuberculosis
Childhood TB: Preventing childhood tuberculosisChildhood TB: Preventing childhood tuberculosis
Childhood TB: Preventing childhood tuberculosisPiLNAfrica
 
Childhood TB: Management of childhood tuberculosis
Childhood TB: Management of childhood tuberculosisChildhood TB: Management of childhood tuberculosis
Childhood TB: Management of childhood tuberculosisPiLNAfrica
 
Childhood TB: Introduction to childhood tuberculosis
Childhood TB: Introduction to childhood tuberculosisChildhood TB: Introduction to childhood tuberculosis
Childhood TB: Introduction to childhood tuberculosisPiLNAfrica
 
Childhood TB: Introduction
Childhood TB: IntroductionChildhood TB: Introduction
Childhood TB: IntroductionPiLNAfrica
 
Childhood TB: Diagnosis of childhood tuberculosis
 Childhood TB: Diagnosis of childhood tuberculosis Childhood TB: Diagnosis of childhood tuberculosis
Childhood TB: Diagnosis of childhood tuberculosisPiLNAfrica
 
Childhood TB: Clinical presentation of childhood tuberculosis
Childhood TB: Clinical presentation of childhood tuberculosisChildhood TB: Clinical presentation of childhood tuberculosis
Childhood TB: Clinical presentation of childhood tuberculosisPiLNAfrica
 
Child Healthcare: Upper respiratory tract condition
Child Healthcare: Upper respiratory tract conditionChild Healthcare: Upper respiratory tract condition
Child Healthcare: Upper respiratory tract conditionPiLNAfrica
 
hild Healthcare: Tuberculosis
hild Healthcare: Tuberculosishild Healthcare: Tuberculosis
hild Healthcare: TuberculosisPiLNAfrica
 
Child Healthcare: The history and examination
Child Healthcare: The history and examinationChild Healthcare: The history and examination
Child Healthcare: The history and examinationPiLNAfrica
 
Child Healthcare: Skin condition
Child Healthcare: Skin conditionChild Healthcare: Skin condition
Child Healthcare: Skin conditionPiLNAfrica
 
Child Healthcare: Serious illnesses
Child Healthcare: Serious illnessesChild Healthcare: Serious illnesses
Child Healthcare: Serious illnessesPiLNAfrica
 

Más de PiLNAfrica (20)

Gastric Lavage Procedure Animation
Gastric Lavage Procedure AnimationGastric Lavage Procedure Animation
Gastric Lavage Procedure Animation
 
Game-based Assessment Template detailed specification
Game-based Assessment Template detailed specificationGame-based Assessment Template detailed specification
Game-based Assessment Template detailed specification
 
Game-based Assessment Quiz Template
Game-based Assessment Quiz TemplateGame-based Assessment Quiz Template
Game-based Assessment Quiz Template
 
Fostering Cross-institutional Collaboration for Open Educational Resources Pr...
Fostering Cross-institutional Collaboration for Open Educational Resources Pr...Fostering Cross-institutional Collaboration for Open Educational Resources Pr...
Fostering Cross-institutional Collaboration for Open Educational Resources Pr...
 
Ethics and Integrity in Data Use and Management Detailed Specifications
Ethics and Integrity in Data Use and Management Detailed SpecificationsEthics and Integrity in Data Use and Management Detailed Specifications
Ethics and Integrity in Data Use and Management Detailed Specifications
 
EMR Implementation Considerations Slides
EMR Implementation Considerations SlidesEMR Implementation Considerations Slides
EMR Implementation Considerations Slides
 
Developing and using Open Educational Resources at KNUST
Developing and using Open Educational Resources at KNUSTDeveloping and using Open Educational Resources at KNUST
Developing and using Open Educational Resources at KNUST
 
Data Quality: Missing Data detailed specification
Data Quality: Missing Data detailed specificationData Quality: Missing Data detailed specification
Data Quality: Missing Data detailed specification
 
ata Management Ethics Resources
ata Management Ethics Resourcesata Management Ethics Resources
ata Management Ethics Resources
 
Childhood TB: Preventing childhood tuberculosis
Childhood TB: Preventing childhood tuberculosisChildhood TB: Preventing childhood tuberculosis
Childhood TB: Preventing childhood tuberculosis
 
Childhood TB: Management of childhood tuberculosis
Childhood TB: Management of childhood tuberculosisChildhood TB: Management of childhood tuberculosis
Childhood TB: Management of childhood tuberculosis
 
Childhood TB: Introduction to childhood tuberculosis
Childhood TB: Introduction to childhood tuberculosisChildhood TB: Introduction to childhood tuberculosis
Childhood TB: Introduction to childhood tuberculosis
 
Childhood TB: Introduction
Childhood TB: IntroductionChildhood TB: Introduction
Childhood TB: Introduction
 
Childhood TB: Diagnosis of childhood tuberculosis
 Childhood TB: Diagnosis of childhood tuberculosis Childhood TB: Diagnosis of childhood tuberculosis
Childhood TB: Diagnosis of childhood tuberculosis
 
Childhood TB: Clinical presentation of childhood tuberculosis
Childhood TB: Clinical presentation of childhood tuberculosisChildhood TB: Clinical presentation of childhood tuberculosis
Childhood TB: Clinical presentation of childhood tuberculosis
 
Child Healthcare: Upper respiratory tract condition
Child Healthcare: Upper respiratory tract conditionChild Healthcare: Upper respiratory tract condition
Child Healthcare: Upper respiratory tract condition
 
hild Healthcare: Tuberculosis
hild Healthcare: Tuberculosishild Healthcare: Tuberculosis
hild Healthcare: Tuberculosis
 
Child Healthcare: The history and examination
Child Healthcare: The history and examinationChild Healthcare: The history and examination
Child Healthcare: The history and examination
 
Child Healthcare: Skin condition
Child Healthcare: Skin conditionChild Healthcare: Skin condition
Child Healthcare: Skin condition
 
Child Healthcare: Serious illnesses
Child Healthcare: Serious illnessesChild Healthcare: Serious illnesses
Child Healthcare: Serious illnesses
 

Último

The Most Excellent Way | 1 Corinthians 13
The Most Excellent Way | 1 Corinthians 13The Most Excellent Way | 1 Corinthians 13
The Most Excellent Way | 1 Corinthians 13Steve Thomason
 
Z Score,T Score, Percential Rank and Box Plot Graph
Z Score,T Score, Percential Rank and Box Plot GraphZ Score,T Score, Percential Rank and Box Plot Graph
Z Score,T Score, Percential Rank and Box Plot GraphThiyagu K
 
Activity 01 - Artificial Culture (1).pdf
Activity 01 - Artificial Culture (1).pdfActivity 01 - Artificial Culture (1).pdf
Activity 01 - Artificial Culture (1).pdfciinovamais
 
Beyond the EU: DORA and NIS 2 Directive's Global Impact
Beyond the EU: DORA and NIS 2 Directive's Global ImpactBeyond the EU: DORA and NIS 2 Directive's Global Impact
Beyond the EU: DORA and NIS 2 Directive's Global ImpactPECB
 
The basics of sentences session 2pptx copy.pptx
The basics of sentences session 2pptx copy.pptxThe basics of sentences session 2pptx copy.pptx
The basics of sentences session 2pptx copy.pptxheathfieldcps1
 
Sanyam Choudhary Chemistry practical.pdf
Sanyam Choudhary Chemistry practical.pdfSanyam Choudhary Chemistry practical.pdf
Sanyam Choudhary Chemistry practical.pdfsanyamsingh5019
 
Software Engineering Methodologies (overview)
Software Engineering Methodologies (overview)Software Engineering Methodologies (overview)
Software Engineering Methodologies (overview)eniolaolutunde
 
The byproduct of sericulture in different industries.pptx
The byproduct of sericulture in different industries.pptxThe byproduct of sericulture in different industries.pptx
The byproduct of sericulture in different industries.pptxShobhayan Kirtania
 
Grant Readiness 101 TechSoup and Remy Consulting
Grant Readiness 101 TechSoup and Remy ConsultingGrant Readiness 101 TechSoup and Remy Consulting
Grant Readiness 101 TechSoup and Remy ConsultingTechSoup
 
Measures of Dispersion and Variability: Range, QD, AD and SD
Measures of Dispersion and Variability: Range, QD, AD and SDMeasures of Dispersion and Variability: Range, QD, AD and SD
Measures of Dispersion and Variability: Range, QD, AD and SDThiyagu K
 
Student login on Anyboli platform.helpin
Student login on Anyboli platform.helpinStudent login on Anyboli platform.helpin
Student login on Anyboli platform.helpinRaunakKeshri1
 
microwave assisted reaction. General introduction
microwave assisted reaction. General introductionmicrowave assisted reaction. General introduction
microwave assisted reaction. General introductionMaksud Ahmed
 
JAPAN: ORGANISATION OF PMDA, PHARMACEUTICAL LAWS & REGULATIONS, TYPES OF REGI...
JAPAN: ORGANISATION OF PMDA, PHARMACEUTICAL LAWS & REGULATIONS, TYPES OF REGI...JAPAN: ORGANISATION OF PMDA, PHARMACEUTICAL LAWS & REGULATIONS, TYPES OF REGI...
JAPAN: ORGANISATION OF PMDA, PHARMACEUTICAL LAWS & REGULATIONS, TYPES OF REGI...anjaliyadav012327
 
1029 - Danh muc Sach Giao Khoa 10 . pdf
1029 -  Danh muc Sach Giao Khoa 10 . pdf1029 -  Danh muc Sach Giao Khoa 10 . pdf
1029 - Danh muc Sach Giao Khoa 10 . pdfQucHHunhnh
 
Accessible design: Minimum effort, maximum impact
Accessible design: Minimum effort, maximum impactAccessible design: Minimum effort, maximum impact
Accessible design: Minimum effort, maximum impactdawncurless
 
BASLIQ CURRENT LOOKBOOK LOOKBOOK(1) (1).pdf
BASLIQ CURRENT LOOKBOOK  LOOKBOOK(1) (1).pdfBASLIQ CURRENT LOOKBOOK  LOOKBOOK(1) (1).pdf
BASLIQ CURRENT LOOKBOOK LOOKBOOK(1) (1).pdfSoniaTolstoy
 
Organic Name Reactions for the students and aspirants of Chemistry12th.pptx
Organic Name Reactions  for the students and aspirants of Chemistry12th.pptxOrganic Name Reactions  for the students and aspirants of Chemistry12th.pptx
Organic Name Reactions for the students and aspirants of Chemistry12th.pptxVS Mahajan Coaching Centre
 

Último (20)

The Most Excellent Way | 1 Corinthians 13
The Most Excellent Way | 1 Corinthians 13The Most Excellent Way | 1 Corinthians 13
The Most Excellent Way | 1 Corinthians 13
 
Z Score,T Score, Percential Rank and Box Plot Graph
Z Score,T Score, Percential Rank and Box Plot GraphZ Score,T Score, Percential Rank and Box Plot Graph
Z Score,T Score, Percential Rank and Box Plot Graph
 
Activity 01 - Artificial Culture (1).pdf
Activity 01 - Artificial Culture (1).pdfActivity 01 - Artificial Culture (1).pdf
Activity 01 - Artificial Culture (1).pdf
 
Mattingly "AI & Prompt Design: The Basics of Prompt Design"
Mattingly "AI & Prompt Design: The Basics of Prompt Design"Mattingly "AI & Prompt Design: The Basics of Prompt Design"
Mattingly "AI & Prompt Design: The Basics of Prompt Design"
 
Beyond the EU: DORA and NIS 2 Directive's Global Impact
Beyond the EU: DORA and NIS 2 Directive's Global ImpactBeyond the EU: DORA and NIS 2 Directive's Global Impact
Beyond the EU: DORA and NIS 2 Directive's Global Impact
 
The basics of sentences session 2pptx copy.pptx
The basics of sentences session 2pptx copy.pptxThe basics of sentences session 2pptx copy.pptx
The basics of sentences session 2pptx copy.pptx
 
Sanyam Choudhary Chemistry practical.pdf
Sanyam Choudhary Chemistry practical.pdfSanyam Choudhary Chemistry practical.pdf
Sanyam Choudhary Chemistry practical.pdf
 
Software Engineering Methodologies (overview)
Software Engineering Methodologies (overview)Software Engineering Methodologies (overview)
Software Engineering Methodologies (overview)
 
The byproduct of sericulture in different industries.pptx
The byproduct of sericulture in different industries.pptxThe byproduct of sericulture in different industries.pptx
The byproduct of sericulture in different industries.pptx
 
Grant Readiness 101 TechSoup and Remy Consulting
Grant Readiness 101 TechSoup and Remy ConsultingGrant Readiness 101 TechSoup and Remy Consulting
Grant Readiness 101 TechSoup and Remy Consulting
 
Measures of Dispersion and Variability: Range, QD, AD and SD
Measures of Dispersion and Variability: Range, QD, AD and SDMeasures of Dispersion and Variability: Range, QD, AD and SD
Measures of Dispersion and Variability: Range, QD, AD and SD
 
Student login on Anyboli platform.helpin
Student login on Anyboli platform.helpinStudent login on Anyboli platform.helpin
Student login on Anyboli platform.helpin
 
microwave assisted reaction. General introduction
microwave assisted reaction. General introductionmicrowave assisted reaction. General introduction
microwave assisted reaction. General introduction
 
JAPAN: ORGANISATION OF PMDA, PHARMACEUTICAL LAWS & REGULATIONS, TYPES OF REGI...
JAPAN: ORGANISATION OF PMDA, PHARMACEUTICAL LAWS & REGULATIONS, TYPES OF REGI...JAPAN: ORGANISATION OF PMDA, PHARMACEUTICAL LAWS & REGULATIONS, TYPES OF REGI...
JAPAN: ORGANISATION OF PMDA, PHARMACEUTICAL LAWS & REGULATIONS, TYPES OF REGI...
 
1029 - Danh muc Sach Giao Khoa 10 . pdf
1029 -  Danh muc Sach Giao Khoa 10 . pdf1029 -  Danh muc Sach Giao Khoa 10 . pdf
1029 - Danh muc Sach Giao Khoa 10 . pdf
 
Advance Mobile Application Development class 07
Advance Mobile Application Development class 07Advance Mobile Application Development class 07
Advance Mobile Application Development class 07
 
Accessible design: Minimum effort, maximum impact
Accessible design: Minimum effort, maximum impactAccessible design: Minimum effort, maximum impact
Accessible design: Minimum effort, maximum impact
 
BASLIQ CURRENT LOOKBOOK LOOKBOOK(1) (1).pdf
BASLIQ CURRENT LOOKBOOK  LOOKBOOK(1) (1).pdfBASLIQ CURRENT LOOKBOOK  LOOKBOOK(1) (1).pdf
BASLIQ CURRENT LOOKBOOK LOOKBOOK(1) (1).pdf
 
INDIA QUIZ 2024 RLAC DELHI UNIVERSITY.pptx
INDIA QUIZ 2024 RLAC DELHI UNIVERSITY.pptxINDIA QUIZ 2024 RLAC DELHI UNIVERSITY.pptx
INDIA QUIZ 2024 RLAC DELHI UNIVERSITY.pptx
 
Organic Name Reactions for the students and aspirants of Chemistry12th.pptx
Organic Name Reactions  for the students and aspirants of Chemistry12th.pptxOrganic Name Reactions  for the students and aspirants of Chemistry12th.pptx
Organic Name Reactions for the students and aspirants of Chemistry12th.pptx
 

Farmers' Agribusiness Training Course: Module 1 Supplementary Reading. Rural Financial Services in Kenya: What is Working and Why?

  • 1. Tegemeo Institute of Agricultural Policy and Development Tegemeo Working paper 25/2006 Rural Financial Services in Kenya: What is Working and Why? By Betty Kibaara Tegemeo Institute of Agricultural Policy and Development, Egerton University. P.O Box 20498, Nairobi. Tel: (02) 2717818 Email: egerton@tegemeo.org Support for this research has been provided by the Tegemeo Agricultural Monitoring and Policy Analysis Project (TAMPA) between Tegemeo Institute/Egerton University and the Department of Agricultural Economics at Michigan State University. Financial support for this project is provided by the Kenya Mission of the United States Agency for International Development. I sincerely thank Samuel Mburu and Mercy Mutua for their assistance in data collection and compilation of field report. The time afforded to us by our field respondents and other stakeholders interviewed during the course of this study is humbly appreciated.
  • 2. Rural Financial Services in Kenya: What is Working and Why? Betty Kibaara∗ Abstract Access to rural financial services has a potential to make a difference in agricultural productivity, food security and poverty reduction. However, an efficient, sustainable and widely accessible rural financial system remains a major development challenge in most Sub Sahara African countries. The Economic Recovery Strategy for Wealth and Employment Creation (ERS) has identified poor access to farm credit and financial services as a contributing factor to the decline in agricultural productivity. The Strategy for Revitalizing Agriculture (SRA) proposes to improve access to rural financial services in Kenya. As a follow up on SRA, the Agricultural Sector Co-ordination Unit (ASCU) has fast tracked access to rural financial services by establishing a thematic group on inputs and rural financial services with an overall objective of developing an Integrated Farm Input Strategy. In the late 1990’s, most mainstream commercial banks closed down the rural branches in order to cut costs and improve profits. Since then, a number of non-traditional financial institutions have emerged to fill the gap created by the mainstream banks which locked out low income and irregular earners. This study examines the evolving structure of the rural financial services and the extent to which the current financial institutions have improved access to producers and traders in the rural areas. The study identifies successful cases of functioning financial services in the rural areas. It also identifies constraints that hinder increased access to rural financial services and proposes policy interventions that could make the services more accessible to the rural people. The study was carried out in 15 Districts within six agro-ecological zones. Data was obtained from key rural finance stakeholders using a structured checklist. The study is supplemented with information from the Tegemeo Agricultural Monitoring and Policy Analysis (TAMPA) 2004 survey consisting of responses from 1540 rural households. Findings from the study indicate that a number of key rural financial models have evolved to address the demand for rural financial services in Kenya. These include: Community Owned Rural Financing Models, Private Commercial Bank Led Model, Government Led-Rural Finance Model, Donor Guarantees-Input Supply Model, Managed SACCO-Beach Banking Model and the Informal Group Based Rural Financing Model. The Government on its part has restructured the operations of Agricultural Finance Corporation (AFC) in line with the Strategy for Revitalization of Agriculture (SRA). The emerging leading indigenous banks have also set up fixed and mobile branches in the rural areas. ∗ Research Fellow, Tegemeo Institute, Egerton University. P.O. Box 20498 (00200), Nairobi, Kenya. Tel. +254 20 2717818: email: bkibaara@tegemeo.org ii
  • 3. Table of Contents Abstract ............................................................................................................................... ii Table of Contents............................................................................................................... iii List of Tables ..................................................................................................................... iv List of Figures .................................................................................................................... iv List of Acronyms ................................................................................................................ v 1.0 Introduction........................................................................................................... 1 1.1 Background Information ..................................................................................... 1 1.2 Objectives............................................................................................................... 3 1.3 Research Questions............................................................................................... 3 1.4 Methodology .......................................................................................................... 3 2.0 An overview of the Agricultural Credit in Kenya.............................................. 5 2.1 The Role of Rural Credit in Increasing Agricultural Productivity.................. 5 2.2 Demand and Supply of Rural Credit .................................................................. 5 2.2.1 Demand ........................................................................................................... 5 2.2.2 Supply ............................................................................................................. 7 2.3 Characteristics of the Households that Received Agricultural Credit ............ 9 2.4 Agricultural Credit Type and Repayment Mode............................................. 10 3.0 Emerging Models of Rural Financing............................................................... 12 3.1 Community Owned Rural Finance Model........................................................ 12 3.1.1 Financial Service Associations ................................................................. 12 3.1.2 Mbeu Savings and Credit Association...................................................... 14 3.2 Private Commercial Bank Led Model: a Case of Emerging Indigenous Bank 17 3.2.1 Mobile Banking with Equity Bank ........................................................... 18 3.3 Government Led Rural Finance Model: a case of AFC ................................... 19 3.4 The Donor Guarantee-Input Supply Model ...................................................... 23 3.4.1 Stockists Credit Guarantee System ........................................................... 24 3.4.2 Credit Voucher System:Rice Production in Ahero Irrigation Scheme ..... 25 3.5 Managed SACCO: a case of ‘Beach Banking’ Model...................................... 28 3.5.1 Market Day Loans..................................................................................... 28 3.6 Informal Group Based Rural Financing Model ................................................ 29 3.6.1 Merry go –round ....................................................................................... 29 3.6.2 Mata Masu Dubara (MMD) ...................................................................... 29 3.6.3 Table ‘Banking’ ........................................................................................ 30 3.6.4 Rotating Savings and Credit Associations (ROSCAs) ............................. 30 3.7 Group Membership in Rural Kenya.................................................................. 31 3.8 A Comparative Analysis of the Models............................................................ 32 3.8.1 Sustainability and Outreach ...................................................................... 34 3.9 Future Scenario of Rural Financing.................................................................. 36 4.0 Key Findings and Policy Implications............................................................... 37 Reference ......................................................................................................................... 38 iii
  • 4. List of Tables Table 1: Sources of Primary Data by Agro-Ecological Zones ........................................... 4 Table 2: Maize Productivity and Access to Agricultural Credit, 2004............................... 5 Table 3: Source of Agricultural Credit in Percent, 2000 and 2004 .................................... 8 Table 4: Selected Characteristics of households that received credit, 2004 ..................... 10 Table 5: Credit Type and Repayment Mode..................................................................... 11 Table 6: Statistical for Financial Service Association, 1999-2005................................... 14 Table 7: Where do Mbeere District Households save?..................................................... 15 Table 8: AFC Development and Seasonal Credit, 1996 to 2005...................................... 21 Table 9: Group Type by Zone, 2004................................................................................. 31 Table 10: A comparative Analysis of selected Models .................................................... 33 List of Figures Figure 1: Reasons for borrowing, 2000 and 2004…………………………………. .. .. 6 Figure 2: Percent of households that obtained credit by zone, 2004……………………...7 Figure 3: Outreach and Financial Sustainability Frontier………………………… .35 iv
  • 5. List of Acronyms AFC Agricultural Finance Corporation AFRACA African Rural and Agricultural Credit Association AGMARK Agricultural Market Development Trust AMFI Association of Micro Finance Institutions ASCU Agricultural Sector Co-ordination Unit CDF Constituency Development Fund CGS Credit Guarantee System DFS Decentralised Financial Services ERSWC Economic Recovery Strategy for Wealth and Employment Creation FOSA Front Office Service Activities FSA Financial Services Association IFAD International Fund for Agricultural Development KACE Kenya Agricultural Commodity Exchange KSH Kenya Shilling KREP Kenya Rural Enterprise MMD Mata Masu Dubara MFI Micro Finance Institution NARC National Rainbow Coalition NCPB National Cereals and Produce Board NGOs Non Governmental Organizations NIB National Irrigation Board PRSP Poverty Reduction Strategy Paper RMC Regional Management Company ROSCAs Rotating Savings and Credit Associations SACCO Savings and Credit Co-operative Societies SRA Strategy for Revitalizing Agriculture STEP Saga Thrift Enterprise Promotion TAMPA Tegemeo Agricultural Monitoring and Policy Analysis USAID United States Agency for International Development v
  • 6. 1.0 Introduction 1.1 Background Information Agriculture contributes 23.9% percent of national Gross Domestic Product (GDP) and 60 percent of the total export earnings. In addition, 80 per cent of the population derives their livelihood from agriculture. In spite of the significant contribution, agriculture has experienced low productivity in the past decade. The Poverty Reduction Strategy Paper (PRSP) prioritized agriculture and rural development sector as one of the key sectors that needs urgent intervention. In order to attain the targeted five percent annual growth in this sector, financial systems, extension services, rural infrastructure, marketing and distribution systems need to be addressed. Promoting an efficient, sustainable and widely accessible rural financial systems remains a major development challenge in most sub Sahara African countries. With about 73% of Africa’s population living in the rural areas and experiencing a high incidence of rural poverty, improved rural finance is crucial in achieving pro-poor growth and poverty reduction goals. However, the development of rural financial systems is hampered by the high cost of delivering the services to small, widely dispersed customers; as well as a difficult financial terrain – characterized by high covariant risks, missing markets for risk management instruments and lack of suitable collateral (Onumah, 2002). Lack of working capital and low liquidity limit the farmer’s ability to purchase productivity enhancing inputs like seeds, fertilizers and pesticide. Inspite of the relatively high adoption rates of inputs like fertilizers, the quantities used are low and therefore, hybrid variety crops that are dependent on fertilizers may not attain their potential production (Nyoro, 2002). The average production efficiency levels are higher among producers who have access to formal credit, (Awudu and Richard, 2001). Access to credit resulted to higher technical efficiency in maize production in Kenya, (Kibaara, 2005). Kenya has not developed a comprehensive rural financial services strategy. The rural financial sector is governed by the Banking Act, Building Society Act and the Post Bank Act. The proposed Deposit Taking Micro Finance Bill 2005 and the proposed SACCO Societies Regulatory bill, 2004 are still to be debated in parliament. Through the Economic Recovery Strategy for Wealth and Employment Creation (ERSWC) the 1
  • 7. government has identified poor access to farm credit and financial services as a contributing factor to the decline in agricultural productivity. The Strategy for Revitalizing Agriculture (SRA) proposes to encourage an orderly development of micro- finance institutions through the enactment of facilitative legislation, encourage commercial banks to set up operations in the rural areas by providing appropriate incentives, encourage banks to lend to agriculture by reviewing and repealing legal provisions that have undermined banks lending to the sector, recapitalize and streamline the management of Agricultural Finance Corporation so that it can perform its function of providing affordable credit to farmers ( Republic of Kenya, 2004). As a follow up on SRA, the Agricultural Sector Co-ordination Unit (ASCU) has fast tracked the rural financial services by establishing a thematic group on inputs and rural financial services with an overall objective of developing an Integrated Farm Input Strategy. Rural financial services refer to all financial services extended to agricultural and non-agricultural activities in rural areas; these services include money deposit/savings, loans, money transfer, safe deposit and insurance. Demanders/beneficiaries of rural financial services are mainly households, producers, input stockists/suppliers, traders, agro-processors and service providers. Rural financial services help the poor and low income households increase their incomes and build the assets that allow them to mitigate risk, smoothen consumption, plan for future, increase food consumption, invest in education and other lifecycle needs. These needs can be broadly categorized into working capital, fixed asset financing, income smoothing and life cycle events. Access to credit and financial services has the potential to make a difference between grinding poverty and economically secure life. Inspite of the importance of a savings account, 77 percent of Kenyan households have no access to a bank account (Kodhek, 2003). In the late 1990’s, most mainstream commercial banks closed down some rural branches in order to cut costs and improve profits. The non-traditional financial institutions have emerged to fill the gap created by the mainstream banks which locked out low income and irregular earners. 2
  • 8. 1.2 Objectives The primary objective of this study was to examine the evolving models of rural financial service providers with a broad aim of understanding models that are working, why they are working, characteristics, opportunities and constraints. It seeks to understand the extent to which these models have improved access to the rural financial services for producers and traders in the rural areas. The study proposes some policy some interventions that could improve access to financial services. 1.3 Research Questions The study seeks to answer the following research questions; Are there success cases in the provision of rural financial services? What are the characteristics of rural financial service providers? What are the challenges and opportunities? How can the success cases be replicated and up-scaled? Who is accessing and at what cost? Has the government implemented any SRA proposal of recapitalizing and restructuring AFC? Results will contribute to a better understanding of the evolving structure of rural financial services and provide an input to the Integrated Farm Input Strategy to be prepared by the thematic group on inputs and rural financial services. 1.4 Methodology This study utilized data from primary and secondary sources. Secondary data was gathered during the discussions with stakeholders from the rural finance sub-sector i.e. Banks-Equity Bank, Co-operative Bank of Kenya, Post bank, Kenya Commercial Bank; Development partners-United States Agency for International Development, International Fund for Agricultural Development (IFAD); Financial Associations- African Rural and Agricultural Credit Association (AFRACA), Association of Micro- finance (AMFI); Financial Regulator-Central Bank- Rural Finance Development Department; Non-governmental organizations-Sacred Africa, K-Rep Development Agency (KDA), Kenya Agricultural Commodity Exchange Ltd (KACE), Decentralized Financial Services (DFS), ACDI VOCA, Agricultural Market Development Trust (AGMARK); Government-Agricultural Finance Corporation (AFC), Ministry of Agriculture, Agricultural Sector Co-ordination Unit (ASCU), Ministry of Co-operative Development and Marketing, Ministry of Social Services; Community Associations - Diocese of EMBU- Mbeu Savings and Credit Development Association, Archdiocese of 3
  • 9. Kisumu-ADOK TIMO; Micro-Finance Institutions (MFI)-Krep, MFI-SAGA Thrift and Enterprise Promotions Ltd. Primary data on the emerging models were gathered purposively from 15 districts within six agro-ecological zones (Table 1). The rural financiers were interviewed using a structured checklist mainly covering the history of the organization, operations, outreach, costs, performance indicators, financial services provided, socio-economic characteristic of the client, requirements, use of loans, transaction charges, default rates, sustainability, constraints, opportunities among others . Table 1: Sources of Primary Data by Agro-Ecological Zones Agro-Ecological Zones Districts Models Eastern Lowlands Embu, Kitui, Makueni Community Owned RF Model Central Highlands Naivasha, Nyandarua, Murang' Meru, a, Private Commercial Bank Led model High Potential Maize zone Eldoret, Kakamega, Narok, Government Led model, Informal Group based model Western Lowlands Kisumu Donor-guarantee Input Supply, Beach banking, Community mobilized model, Table Western Highlands Bungoma, Kakamega, Mumias, Kisii banking Marginal Rain Shadow Kajiado Government led model Source: Rural finance study, 2006 The study uses supplementary data from the Tegemeo Agricultural Monitoring Project Analysis (TAMPA) panel data. This is cross-sectional panel (2000 and 2004) household data comprising of 1540 rural households. The data covers eight agro- ecological zones (High Potential Maize Zone, Central Highlands, Western Highlands, Western Transition, Western Lowlands, Eastern Lowlands, Marginal Rain Shadow and Coastal Lowlands). This data provided information on agricultural credit; demand and sources of agricultural credit and repayment mode and household information on self- help groups. The second section of the paper gives an overview of agricultural credit in Kenya, demand and suppliers of agricultural credit and outlines characteristics of beneficiaries of agricultural credit. Section three discusses the emerging models of rural financial services and section four outlines the key findings and policy implications. 4
  • 10. 2.0 An overview of the Agricultural Credit in Kenya This section highlights access of general credit in Kenya, demand and supply of agricultural credit, characteristics of borrowers of agricultural credit and repayment mode. 2.1 The Role of Rural Credit in Increasing Agricultural Productivity Credit is an important input into the production system and it contributes to increased food productivity. Results from TAMPA Panel data 2004 shows that households who received credit for maize production had a higher productivity averaging 7.65 bags per acre as compared 6.5 bags per acre among households that did not receive credit (Table 2). Access to credit increases the farmers’ working capital enabling the farmers to buy productivity enhancing inputs such as good quality seeds, fertilizers and chemicals. Table 2: Maize Productivity and Access to Agricultural Credit, 2004 Mean Yield in Standard 1 Agricultural credit bags per acre Deviation Received 7.88 6.45 Did not receive 6.50 6.08 Source: Tegemeo household survey, 2004 These results were subjected to Levene test of equality of variance and an evaluation of t-statistics shows that there is an overall statistical significant (at 1% significance level) difference between maize productivity among households with and without credit. 2.2 Demand and Supply of Rural Credit 2.2.1 Demand Data from the 2004 Tegemeo survey shows that only 39% of the households sought credit. The main reasons for trying to access credit were farming, consumption needs, school fees, medical and business. Figure 1 compares levels of demand for credit in 2000 and 2004. Credit for farming purposes remains the most dominant need because majority of the rural households, derive their livelihood from agriculture. Demand for 1 Bag weights 90 kilograms 5
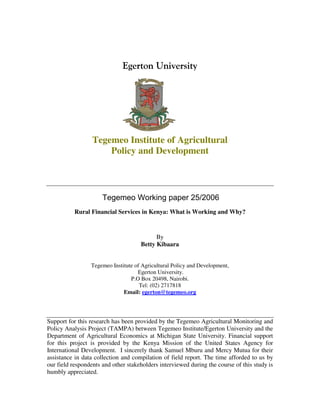
  • 11. credit for agricultural purposes has increased from 53.71% in 2000 to 71.15% in 2004. Demand for credit for school fees has declined from 13.29% in 2000 to 11.50% in 2004 partly attributed to free primary education policy in Kenya implemented in 2003. Figure 1: Reasons for borrowing, 2000 and 2004 80.00 71 60.00 54 Percent 40.00 28 13 2000 20.00 10 12 3 2004 3 2 5 0.00 Farming Consumption School fees Medical Business needs Reasons for credit Source: Tegemeo household survey, 2000 and 2004 Demand for credit for business purposes had increased from 2% (2000) to 5% (2004). This could partly be attributed to the increasing importance of off-farm income earning activities in the rural area. This is supported by Tegemeo panel data set which reveals that off-farming income sources such as business enterprises are increasingly becoming an important contributor to the aggregate household income. The contribution of off-farm income as a percentage of total household income has increased from 24.4% in 2000 to 45% in 2004. Credit demand for medical needs remains unchanged. 82% of those that tried to obtain some sort of credit actually received. However, among those who did not receive credit, 62% had tried to borrow for farming purposes. An indication that although there is a dominant need for farm credit, most farmers do not get the required credit. This is partly associated with the nature of agricultural farming which has high covariant risk Access to agricultural credit in Kenya is skewed towards the more productive agro-ecological zones. Households in the high potential areas have more access to credit as a result of embedded credit component for the perennial crops such as sugar, coffee and tea. In 2004, 70 % of the producers in the Central Highlands received credit; as 6
  • 12. compared to 44.62% in Western Highlands; Western Transitional (44.80%) and High Potential Maize Zone (19.67%). The low production-potential regions had a lower percentage of farmers that obtained credit; Marginal Rain Shadow (26%); Western Lowlands (19.8%); Eastern Lowlands (5.92%) and Coastal lowlands (5.13%). This shows that there is need to improve access to credit services in the lowlands- Arid and Semi-arid regions (Figure 2). Figure 2: Percent of households that obtained credit by zone, 2004 100 80 70.33 60 Percent 44.62 44.52 40 25.64 19.88 19.67 20 5.92 5.13 0 Central Western Western Marginal Western High Potential Eastern Coastal Highlands Highlands Transitional Rain Shadow Lowlands Maize Zone Lowlands Lowlands Zone Source: Tegemeo household survey, 2004 2.2.2 Supply Market share for agricultural credit is dominated by commodity based credit providers (Tea, Sugarcane, French beans) whose provision of credit to beneficiaries has increased from 53.5% in 2000 to 62.7% in 2004. Thus the role of contracted farming in provision of embedded services such as credit for agricultural inputs has become increasingly important. The producer cooperatives/SACCOs remain a significant supplier of agricultural credit and especially in the Central Highlands and Western Transitional zones. However, the market share has slightly declined from 25% in 2000 to 20.6% in 2004 partly because of spillover effect of wrangles and mismanagement of cooperatives. 7
  • 13. Table 3: Source of Agricultural Credit in Percent, 2000 and 2004 Source of credit 2000 2004 Commodity Based Credit Providers 53.5% 62.7% Cooperative/ Saccos 26% 20.6% Informal money lenders2 12.1% 9.9% Local trader/input stockists 6.8% 3.9% AFC 0.4% 1.3% Commercial bank 0.6% 1.0% MFI/ NGO 0.6% 0.5% 100%% 100% Source: Tegemeo household survey, 2000 and 2004 The informal money lenders and local traders/input stockists are more important than the formal banking institutions. They provide close to 20% of the agricultural credit in Kenya. The government owned Agricultural Finance Corporation has gained from 0.4% in 2000 to 1.3% market share in 2004. This gain is partly associated to financial revamp by the government in addition to the current restructuring of the institution. For example, the reintroduction of seasonal crop credit scheme from 2003/04, which had been terminated in 1995/96. Provision of agricultural credit through the mainstream commercial banks has increased slightly following the recent innovative products associated with retail banking such as loans to tea and dairy farmers, reduced bureaucracy, excess liquidity as investment opportunities are thinned following reduction of government/treasury bills which was estimated to contribute 50% of the bank’s income. However, the commercial bank’s contribution to agricultural credit is insignificant. The Micro Finance Institutions (MFIs) provide agricultural credit to only to a mere 0.6% of the rural households. The MFIs have been in existence for the last 20 years, focus on the economically active poor/entrepreneurs and have played a pivotal role in helping the low-income earners access non-agricultural loans. In terms of monetary value, AFC and the commercial banks gave the largest amounts of credit per household but only to a few households, while the co-operatives/Saccos and commodity based credit providers ( such as Tea, Tobacco, French beans and sugar companies) disbursed low amounts of credit to a larger clientele base. 2 Informal money lender includes shylocks, self help groups, merry-go-rounds, community associations 8
  • 14. The credit market is segmented with specific credit providers concentrating on specific regions. Over 70% of Commodity Based Credit Providers served the Central Highlands and Western Transitional Zones. 86% of the Co-operatives and 57% of the mainstream Commercial banks served the Central highlands. In 2004, 64 percent of credit disbursed by AFC was disseminated to the High Potential Maize Zone, 45% of MFI/NGOs served the High Potential Maize Zone, 27.7% served the Central highlands and 22.7% served the Eastern Lowlands. 43.8% of the Informal moneylenders provided agricultural credit to High Potential Maize Zone, 19% to Western Lowland and 17% Central Highland. 2.3 Characteristics of the Households that Received Agricultural Credit The Tegemeo household survey 2004 shows 92.30% of households that received credit had at least one family member belonging to a group (self help, producer, co- operative) as compared to 67% who did not receive credit. Household assets act as collateral for loan repayment. Table 4 shows households that received credit had high asset value (in Ksh) than those who did not receive. Households that received credit had higher annual income. Dis-aggregating annual household income into income quartile reveals that the lowest income quartile is 15 times poorer than the high income quartile. Among the low income quartile, only 23% of the households received agricultural credit as compared to 39% of the households in the high income quartile. Therefore, any intervention targeted towards improvement of rural financial services should not be uniform, but should consider the different income levels. In addition, those that received credit had a higher proportion of households that engaged in off-farm income as compared to those who did not receive credit. 9
  • 15. Table 4: Selected Characteristics of households that received credit, 2004 Received Agricultural Credit Indicator Yes No % received agricultural credit 32% 68% Belongs to a group 92.30% 67.60% Asset Value in Ksh 264,678 170,994 Annual Household Income in Ksh 189,037 147,469 Incomes by Quartiles Lowest income Quartile in Ksh 24,818 (23%)* 25,227 Second lowest income Quartile in Ksh 76,356(33%)* 76,221 Third lowest income Quartile in Ksh 141,988(33%)* 142,774 Highest income Quartile in Ksh 399,107(39%)* 384,170 % engaged of household head in off-farm activities 36% 34% Education level No formal education 16% 23% Primary 52% 52% Secondary 23% 19% Post secondary 6% 5% Gender of the Household Head Male -headed 32.90% 67.06% Female-headed 27.50% 72.54% Source: Tegemeo household survey, 2004 * The values in bracket shows the percentage of households that received agricultural credit Education is also a key determinant of access to rural financial services. The table shows that households that received credit had higher literacy level. Gender influences access to rural agricultural credit. From this study, male-headed households had higher access to credit (32.90%) as compared to female-headed households (27.50%). These characteristics indicate that improving access to rural credit and other financial services will require a holistic rural development approach that addresses all aspects of development. 2.4 Agricultural Credit Type and Repayment Mode 82% of the agricultural credit was received in-kind while 18% was received inform of cash. 91% of the agricultural credit was disbursed in form of operating inputs such as fertilizer, seeds, chemicals and labor, 7% on livestock and livestock feeds and 2% on investment in capital assets. 10
  • 16. 90% of operating inputs was repaid from crop revenue. 66% of the livestock credit was repaid from livestock revenue. However, this was supplemented from crop and off-farm income. 55% of investment in capital asset was mainly repaid from off-farm income. Crop revenue is an important source of repayment for capital investment (Table 5). This shows that households that have access to off-farm income are more likely to borrow for capital investment. Table 5: Credit Type and Repayment Mode Mode of Repayment in Percent Type of credit Livestock Crop Livestock Off farm and crop revenue Revenue income revenue Total Operating inputs 89.50 3.40 5.90 1.20 100 Livestock and feed 13.60 66.10 11.90 8.50 100 Investment in capital assets 31.80 9.10 54.50 4.50 100 Total 83.10 7.70 7.50 1.80 100 Source: Tegemeo household survey, 2004 11
  • 17. 3.0 Emerging Models of Rural Financing Since Rural Financial services is broader than agricultural credit, this section discusses selected emerging models of providing financial services in the rural areas; the Community Owned Rural Finance Model, Private Commercial Bank Led Model, Government Led Rural Finance Model, Donor Guarantee-Input Supply Model, Managed SACCO-Beach Banking Model, and the Informal Rural Financing Model. The section looks at the principle behind each model, outreach (in terms of number of beneficiaries), rural financial products, costs, constraints and opportunities. 3.1 Community Owned Rural Finance Model The community owned rural finance model is a rural finance model that is owned and managed by the rural community with assistance from the donor agency. The community forms registered associations. Membership is through purchase of shares from the associations. The objective of this model is to reduce poverty through improved access to financial services mainly in the low population density areas with high incidences of poverty such as parts of Eastern and Western Lowland regions. The main beneficiaries are the low and medium income population who have few alternatives to financial services. The study found some cases where the community financing models were set up using the Constituency Development Fund (CDF). Examples of the community owned rural finance model are the Financial Service Associations and the church based Mbeu Savings and Credit Association. 3.1.1 Financial Service Associations The Financial Services Associations (FSA) are also referred to as village ‘bank’s and are mainly promoted by K-rep development agency since 1997. The association is registered as a self help group under the Ministry of Culture and Social Services. Membership is acquired through purchase of at least one share at a cost ranging from Ksh. 300 to Ksh. 400. For the model to be operational, it requires a minimum of 300 shareholders. The community contributes towards the share capital and setting up of a physical financial transaction structure that acts as a ‘banking’ hall. The cost of setting 12
  • 18. up a physical structure ranges between Ksh. 100,000 and Ksh. 400,000. The donor agency contributes towards institutionalization (building, furniture, insurance, audit fee) and capacity building. The agency has a clear exit strategy. The FSA is run by a board of directors comprising eight members who are elected annually in a general meeting. The agency monitors the activities of the FSA and has formed Regional Management Companies (RMC) to provide management expertise in addition to supervision and training. RMC charge a fixed rate of 15% (though this may vary between FSAs). The day to day activities are run by lean and low income earning staff members from the community. The main financial services offered are; compulsory savings, voluntary savings, fixed deposit, money transfer, business loans, agricultural loans, education loans, emergency loans and safe deposit. The financial services are open to the non- shareholders at a higher fee. Each FSA operates a bank account with a link mainstream bank located in the nearest town center where surplus money is deposited and money transfer is transacted. Members interested in borrowing loans are required to be members of a primary group and secondary groups. The group members scrutinize the borrower and also guarantee to repay the loan incase of default. The borrower is loaned three times the amount of accumulated shares. The loan attracts an interest rate ranging between 3% and 7% per month on reducing balance, depending on the loan type, repayment and credit history. The loans are insured at a small fee averaging Ksh. 80 per month. The monthly revenue per village bank averages Ksh. 100,000 and the expenditure is about Ksh. 50,000. This show the FSAs are making some reasonable amounts of profit. The number of FSAs have grown by 105% from 34 (1999) to 70 (2005). The FSAs have registered a 2233% growth in number of savers from 3000 in 1999 to 70,000 in 2005. The rural poor have mobilized a total of Ksh.82 millions through shareholding. The value of savings was Ksh. 1.3 billion while cumulative disbursed loan was Ksh. 524 million (Table 6). 13
  • 19. Table 6: Statistical for Financial Service Association, 1999-2005 Shares capital loans in Saving in Average Average No. of in Ksh. Ksh No. of Ksh. savings/member loan/member Year shareholders Millions Millions savers Millions (Ksh) (Ksh) 1999 12,958 7 9 3,833 8 2,087 4,284 2000 21,686 17 38 10,620 49 4,614 5,685 2001 27,377 30 101 16,137 125 7,746 7,011 2002 33,978 36 163 19,369 264 13,630 8,506 2003 42,148 48 236 25,199 438 17,382 8,660 2004 52,925 67 329 35,372 677 19,139 8,590 2005 58,897 82 524 70,683 1,354 19,156 7,215 Source: K-rep development Agency The cumulative average savings per member is Ksh. 19,000. In addition, the amount of average loan averages Ksh. 7,215. The proportion of loans clients to saving clients is 38%, re-enforcing the finding that the rural folks have a higher demand for a save haven for their money rather than for credit/borrowing. 3.1.2 Mbeu Savings and Credit Association Mbeu savings and credit association is another example of a community owned model. It is promoted by the Catholic Diocese of Embu in conjunction with a foreign donor who has a clear exit strategy. The association became operational in 2001 and targets the Embu and Mbeere Districts. It uses the basic principles of FSA; however, the only deviation is that it does not set up a fortified financial transaction structure ‘banking hall’. The loan officers take the financial services to the people using motor cycles where the groups are located. The groups meet under big trees, church compound or a shopping center to collect money and make financial transactions such as compulsory Ksh. 200 monthly saving, voluntary saving, loans and money transfers (school fees). The model has also provided a channel for remitting contributions towards the National Hospital Insurance Fund (NHIF). The association penetrates deep into the interior where many have not succeeded or have not considered viable for banking services. In this model, the members do not have to incur two-way transport cost to the nearest town to access financial services thus saving time and scarce financial resource. All loans attract a 12% p.a interest rate and additional 2% for loan insurance premium. 14
  • 20. A recent study shows that 60% of households in the remote Mbeere Districts of Kenya deposit their savings with Mbeu Savings and Credit Association (Kibaara, et.,al, 2006). Households that save with this association live below the poverty line i.e. earn less than one US dollar per day (Table 7). Table 7: Where do Mbeere District Households save? Mean Annual Mbeere Household income Daily earning Where save? In Ksh. ( in dollar/day) Mbeu savings and Credit Association 60% 108,676 0.66 Sacco 12% 161,825 0.99 Commercial bank 28.8% 190,439 1.16 Source: Kibaara et al, 2006 The association has seen a tremendous growth in membership, shares and loans. There is a 550% growth in membership from 1140 members in 2001 to 7408 in Feb 2006. In addition, there is a remarkable increase in shares, from Ksh. 1.7 million in 2001 to 30.2 million in Feb 2006. Loans increased from Ksh. 0.12 million in 2001 to Ksh. 22.48 million (Feb 2006). The tremendous increase in membership, shares and loans implies that the association is on the path of growth. Cumulative average saving per member is Ksh. 4,077. Only 30% of the members borrowed loans averaging Ksh. 10,000. This again is an indication that most rural households are mainly interested in other financial services and not only on loans/credit. The Mbeu model can be replicated and scaled up in other regions of the country at low costs. For example, the foreign donor contributed only Ksh. 17 million towards setting up of Mbeu savings and credit association. Challenges and Opportunities of the Community Owned Model Challenges i. The insecurity in the urban areas has infiltrated to the rural areas. For example the FSAs reported close to 10 robberies in 2005. The monetary loss from these incidences has been estimated at Ksh 1 million, not to mention bodily harm to the security guards. The targeted robberies are attracted by money that is kept in the safe and yet it’s not economical to regularly transport the money to the link banks due to infrastructure problems. In order to avoid or reduce such losses in the 15
  • 21. future, the agency has invested in expensive break-proof safe and insured money in the safe and on transit. This additional cost will be absorbed by the members of FSA and will certainly impact on profitability of the FSAs. ii. Poor infrastructure – the rural infrastructure (road and communication network) is poorly developed in most rural areas. Poor road net work increases transaction costs of transporting monies to the link banks regularly. For example, the Marsabit FSA is far from the main link-bank, thus making it almost impossible for the agency to monitor the activities. In addition, most FSA operates their activities manually because of lack of electricity. iii. Policy and regulatory framework. Lack of proper policy framework to spur the growth of rural financial services has also been identified as a key challenge. These community associations offer unregulated Front Office Services Activities (FOSA). Incase of the collapse of the association, the members will have no recourse of recovering their deposits. iv. Management personnel lack the necessary management skills required to run financial services associations. In an attempt to overcome this challenge, FSAs hire services of the regional management company. v. Sustainability of the community owned model remains a big challenge. The donor has a clear exit strategy and yet the associations have not yet attained sustainability. vi. High interest rate charged by FSA may discourage borrowing thus deny the revenue required for sustainability. For example Ksh. 10,000 loan at 4% p.m, repayable on reducing balance translates to 34 % annual interest rate. Some key findings from the study show that the borrowers are willing to pay the high interest rates due to lack of alternatives. In addition, the FSAs are owned by the borrowers and any income accruing from loans is disbursed inform of dividends at the end of the year. Opportunities • As the associations move towards sustainability, they can consider other sources of financing from the upcoming wholesalers of rural finance. 16
  • 22. • To increase the revenue base, Mbeu saving association should extend their financial services such as money transfer to non-shareholders at a higher fee. 3.2 Private Commercial Bank Led Model: a Case of Emerging Indigenous Banks Commercial banks are potentially an important source of rural financial services. However, most mainstream banks have undergone major restructuring such as closing branches in the rural areas to cut down on costs and improve profits. This has left a gap in the rural financial services which has partly been filled by the emerging indigenous banks such as Equity bank. The equity bank model works on the principle of taking banking services closer to the people. The bank financial services to rural clients make up 68 percent of Equity’s bank clients but with only 28 percent of the total deposit volume, given the relatively lower average savings account size of rural clients (CGAP, 2004). Although the bank reaches a wide range of clients, the majority of its clients are low-end salaried workers, and micro and small businesses. In addition, the rural farming community can access supervised short term loans for horticulture, dairy, coffee and tea farmers. The bank has captured a market niche in the banking sector in Kenya of the low income earners by addressing the perceived exorbitant price and attendant charges of loan and savings products. The main financial services offered are savings/deposit, loans, cheque clearance, money transfer. The deposit products are designed to target the low income clients who cannot be considered by the mainstream banks. For example, the operating balance on the deposit account is only Ksh. 400. Ease of opening a bank account and all that is needed is a national identity card and the opening balance. The bank uses a digital camera to take free passport photographs. Unlike other banks, there is no ledger fee or maintenance fee. In addition, withdrawal charges of Ksh. 50 are affordable to the low income clients. The interest on loan ranges between 1% and 1.5 % per month or 12% to 18% per year. Equity bank has focused specifically on the outreach component of mobile banking services, and on improving service efficiency and proximity for clients. 17
  • 23. The number of branches has increased by 55% from 20 in 2004 to 31 in 2005. The customer base increased by 33% from 413,000 clients in 2004 to 560,000 clients in 2005, this constitutes 22% of all the deposit accounts in Kenya. Customer deposits grew by 76% from 5.1 Ksh. billion in 2004 to 9 billion in 2005. The loan portfolio has also grown by Ksh. 97% from Ksh 3 billion in 2004 to Ksh 5.9 Billion in 2005. Profit has increased by 130% Ksh. 218 million in 2004 to Ksh 501 million in 2005. The ratio of borrowing clients to total clients is 21% showing that the need for other financial services is greater than the need for credit/loan. Average loan per client is Ksh. 42,942 while savings Ksh 16, 071. 3.2.1 Mobile Banking with Equity Bank Mobile banking comes in many variants such as a Grameen loan officer visiting a Grameen group on a motorcycle, an automated teller machine visiting a remote village to pay out pension and provide savings facilities. Mobile banking has been widely accepted in many countries such as South Africa, Vietnam, Thailand, Indonesia, West Africa and Bangladesh as an innovative and low-cost distribution system of improving financial services in remote areas where there are no formal banks (Coetzee et.,al, 2003). In most cases the benefits outweigh the costs. The concept of mobile banking involves taking banking services to the rural areas using an equipped mobile van. This is done 2-3 times in a week. Other requirements of a mobile bank include; permanent premise, motor vehicles, at least two banking staff and two security personnel. Currently, there are 52 Equity mobile banks in Kenya that contributes an estimated 15% of the Equity’s banking business. For sustainability, one mobile unit requires to have at least 1500 clients. Most mobile Equity banks reported a clientele base of up to 3000 members. These mobiles are demand driven and in most cases, some have converted into fully fledged branches in less than one year. The mobile bank charges an addition to a fixed monthly charge of Ksh. 50. In most cases most branches handle between 250-300 transactions per day on busy days. Mobile banking services are beneficial to clients because most save money that could have been used on transport. For example a client based in Siakago pays Ksh. 160 (2 way) for transport to access financial services in Embu (about 40 Km). However, with the mobile bank in 18
  • 24. Siakago, the same client is charged an extra Ksh. 50 to access his financial services via the mobile bank. The clients also save traveling time in addition to convenience. The estimated cost of running a mobile unit is Ksh. 70,000 per month and mobile unit generate a monthly profit of Ksh. 100,000. Challenges and opportunities The main challenge is related to infrastructure and especially when taking the mobile services to the people in the rural areas. In most cases, a mobile van travel as far as 60 kilometers on poor road conditions. In most cases, the mobile hubs have no electricity therefore necessitating the use of generators. There is also a lot of congestion in the banking halls. The other challenge is insecurity for money on transit. The model has demonstrated that the low income population in the rural area is bankable and an opportunity exists for expansion. The bank has proposed to expand the number of branches from 31 to 43 and mobile banks from current 52 to 58 by the end of 2006. The mobile banking services were first supported by the donor but now, they are sustainable. 3.3 Government Led Rural Finance Model: a case of AFC This is a government owned, financed and managed model that provids credit services mainly to large scale farmers with an objective of promoting food production in the country. The main actors are the government, a non-bank financial institution, the farmer and in some cases the donor. In Kenya, the model works through the Agricultural Finance Corporation. There are 31 AFC branches country wide. The corporation has been instrumental in the implementation of many government and donor supported programs such as mechanization of the agricultural sector, livestock development programs, the Guarantee Minimum Return, the Seasonal Crop Credit and the Emergency Livestock Off-take Program. Since early 1990’s, the corporation started experiencing operational difficulties due to poor governance, political interference and effects of economic liberalization that led to subsequent collapse of some agricultural marketing bodies. By 1992, the non-performing loan portfolio reached 89% (AFC, 2005). The 19
  • 25. government and other donors stopped funding AFC and the recovered monies were used for recurrent expenditure. AFC stopped lending officially from 1997 to 2001. The National Rainbow Coalition (NARC) government pledged to improve access to rural credit and financial services from 2003. Since then, the government has implemented some of its pledges as stated in the Strategy for Revitalizing Agriculture (SRA) such as restructuring the operations of the corporation: The government has:- i. Approved AFC restructuring by appointing a new board and a chief executive officer. ii. Implemented the performance contract signed by the managers in order to improve management and increase accountability iii. Written-off accumulated debts owned by the corporation. iv. Released Ksh. Ksh. 1.3 billion being equity injection to be disbursed over a period of five years from 2003 to 2007 at Ksh. 260 million per year. v. Channeled the Japanese grant of Ksh. 759 million to AFC to finance the seasonal crop credit. The main beneficiaries of the credit from the corporation are the large scale farmers who own at least 5 acres of maize and wheat farms. The loan attracts an interest rate of 10% per annum. The main credit products offered are:- a. Seasonal crop credit This loan is for production of hybrid maize and wheat in high potential gazetted areas. Condition for loaning includes; land must be suitable for the crop to be financed; Minimum acreage financed is 5 acres; client to raise 20% of the project cost; applicants with land not owned must provide a lease note of not less than 3 years, registered by the local land register; payment period is within 12 months (one installment) and for each loan 25% of the loan funds is retained for harvesting. The maximum loan disbursed is Ksh. 3.3 million. b. Development loans These include machinery, water development, livestock development and fisheries. The repayment period for development loans is 3 to 5 years. 20
  • 26. c. Cash Crop Loans such as tea, coffee, sugarcane, pyrethrum, cashew nuts, citrus, mango trees and bananas. Mainly for Crop establishment; Crop maintenance; processing equipment, operating costs. d. Horticulture and floriculture loans e. Oil crops loans f. Value addition loans at 15% Table 8 shows trends in development and seasonal crop credit. As at 2004/2005 year, the corporation had advanced a total of one billion Kenya shilling to 5253 farmers. Seasonal loans account for 52% of the total loans, while development accounts for 48% . For wheat and maize seasonal crop credit, the beneficiaries receive Ksh. 11,000 per acre of land. On the other hand, the minimum amount disbursed is Ksh. 50,000 for the development loans. Table 8: AFC Development and Seasonal Credit, 1996 to 2005 Total development3 loans (SS, LS, Total loan Average loan/beneficiary Year ranches) Seasonal crop4 credit ( Dev+ Seasonal) In Ksh Amount in Amount in 5 6 No. Amount in 000' No. 000' No. 000' Small scale Large scale 1995/96 112 202,877 831 142,228 943 345,105 96,364 2,111,223 1996/97 283 290,863 0 283 290,863 40,307 1,590,458 1997/98 133 87,941 0 133 87,941 133,333 675,357 1998/99 105 157,872 0 105 157,872 150,000 1,544,333 1999/00 117 130,728 0 117 130,728 236,667 1,190,722 2000/01 56 112,638 0 56 112,638 182,500 2,510,182 2001/02 1 225 0 1 225 225,000 0 2002/03 590 90,772 0 590 90,772 100,824 635,017 2003/04 2314 187,030 2077 338,612 4391 525,642 15,464 503,452 2004/05 2663 497,991 2580 537,624 5243 1,035,615 152,023 499,591 Average loans 133,248 1,126,034 Source:AFC Prior to the year 2002, the corporation advanced 98% of the development loans to the large scale farmers. But after the year 2003, lending to large scale farmers averages 36%. AFC’s average loans to small scale farmer averages Ksh. 130,000 while the large scale averages Ksh. 1.1 million. 3 Dairy, poultry, pigs, farm infrastructure, farm mechanization etc 4 Seasonal credit loans –specifically for production of marketed wheat , maize and potatoes 5 Small scale loans have a maximum loan ceiling of Ksh. 200,000 and a minimum of Ksh. 50,000 6 Large scale loans with a minimum loan of Ksh. 200,000 and a maximum of Ksh. 1 million 21
  • 27. Challenges and opportunities Challenges i. Prohibitive loan transaction costs for small scale farmers, for example if AFC was to lend a supervised seasonal loan to a small scale borrower amounting to Ksh. 11,000 to plant maize on one acre, the loan transaction costs before repayment of interest would be Ksh. 8,715 (Ksh. 2500 application fee, Ksh. 6050 conveyance fee and Ksh. 165 commitment7 fee). This shows that the cost of loaning to individual small scale farmers is too high. ii. Bloated workforce. Between 1997 and 2002, the corporation carried out an organizational and staff restructuring, reducing the branch network by 37% (from 49 to 31) and staff members reduced by 53% i.e. from 1200 to 570 workers. However further analysis shows that 64% of the current staff is composed of non-technical (support) staff, leading to lots of inefficiencies in the system. This is an indication that the staff restructuring is still not efficient and the support staffs should be reduced. Maybe its time the government considered outsourcing some of the non-core activities. iii. Delayed payment for produce delivered to the National Cereals and Produce Board (NCPB). The beneficiary of the seasonal crop credit loan signs an irrevocable order (IRO) with AFC to deliver maize to the NCPB, which in return deducts the loaned amount and the balance is paid to the producer. However, the IRO cannot be strictly enforced in a liberalized market and producers can sell their maize elsewhere and repay the loan. Producers who sell their produce through the board experience incidences of delayed payment. Currently only about 30% of farmers sell grains through NCPB while 70% sell through other channels. This makes the loan recovery a tedious process. iv. Sustainability. In the past, AFC has solely relied on the government and donor agencies for funding. However, the corporation is expected to attain some level of sustainability. Several AFC branches visited acknowledged that it will be difficult to operate without the Government support given the low interest rates charged on loans. 7 Commitment fee is 1.5% of the loan amount 22
  • 28. Opportunities i. Value addition loans. Traditionally, the corporation has concentrated on financing for primary production. Some branches have started lending to borrowers for value addition of agricultural products such as asset financing for a borrower to set up an abattoir, a tea nursery and Small and Micro Enterprise (SME) in milk processing. ii. Wholesale/group lending approach.. This involves lending to organized groups. The group must be registered, must have management structure, must have a history of success- (must have undertaken an activity together at least for the last three years), must provide security e.g. title deed or deposit 15% of the loan amount with AFC as security. The corporation intends to reduce the cost of offering credit by implementing the wholesaling/group lending as stipulate in its Strategic Plan 2005-2010. The corporation proposes to reach 68% (340,000) clients through wholesaling/group lending of credit to MFIs, co-operatives and organized registered groups. In addition, it intends to retain 32% (160,000) of its clientele for retailing. The study shows that some branches have initiated the group lending approach. For example in the four branches visited by the research team, at least 8 groups/cooperatives were in the loan appraisal stage. In total, the loans will benefit at least 16,000 individuals (150% more clients than the current retail level) with a total of Ksh. 42 million, thus this is a more efficient and effective way of improving access to rural credit. On average, each member of the wholesaling group will probably get a loan of Ksh. 18,721 per member, this is about 70% lower than the current amount loaned to the AFC ‘small scale farmers’. 3.4 The Donor Guarantee-Input Supply Model The model has two components, i.e. the stockists credit guarantee system and the credit voucher system. A guarantee is a promise to repay credit or a loan incase of default. This is done to promote private sector lending to decrease credit risks, build lending capacity and potential for sustained activity and address a market imperfection. 23
  • 29. 3.4.1 Stockists Credit Guarantee System The credit guarantee system is a model of building lending capacity between the commercial manufacture of agricultural input and the input stockists. The rural stockists/shopkeepers are an important source of credit for agricultural inputs to the rural areas. Data from the 2004 Tegemeo survey shows that rural stockists provide 4 % to 7% of credit in-kind. The rural stockists face challenges such as lack of the required capital to meet the input requirements of the producers, lack of knowledge on inputs and business skills. This has contributed to low usage of agricultural input that translates to low agricultural productivity. The overall objective of the guarantee system is to improve agricultural productivity and incomes of smallholder farmers in Western Kenya8. The central strategy is to strengthen commercial linkages between enterprises in the private sector distribution system, from input supply companies to regional wholesalers to rural stockists- from whom farmer’s access inputs – in order to increase the range and quantity of inputs available. This will increase the smallholder farmers’ sustainable access to and use of agricultural inputs and services (including dairy) by improving their availability. How does the credit guarantee system work? The credit guarantee system involves the following parties; the donor, agricultural input stockists/wholesaler, a local non-governmental organization (NGO) in this case Agricultural Market Development Trust and an input manufacturing company. To increase the creditworthiness of the input stockist, the donor through an NGO offers seven modules on business training courses at a cost of Ksh. 500 per module. As at January, 2006, 138 stockists had been trained. The NGO avails the list of trained stockist to the input company. The input manufacturing company then enters into agreement with the trained stockist to supply inputs (companies and wholesalers) on credit. The donor guarantees to pay 50% of the default loan balance and the company will absorb the other half. The guarantee fund worth over US $40,000 (Ksh 2.9 million) is held by the donor. The program was piloted in 2005 in Western Kenya. 8 Kisumu, Siaya, Bungoma and Vihiga districts 24
  • 30. As at January, 2006, five companies had received a revolving credit9 guarantee of enabling them to extend credit valued at Ksh. 866, 364 to two wholesalers who in turn guaranteed 50 new stockists who have received inputs worth Ksh. 3.6 million on credit. There has been excellent repayment, with only one defaulter, amounting to Ksh. 222, 285. The organization has already paid for 50% default though the process of repayment is lengthy, taking approximately 2-3 months. A recent study shows that the effect of the credit guarantee has trickled down to the farmer. Stockists affiliated to the credit guarantee system are doing better than the non-affiliated stockists in credit provision; about 34% stockists gave credit to farmers compared to 29% of the non-affiliated stockists (AGMARK, 2006). Challenges and Opportunities The credit guarantee fund of $40,000 is limited and can only guarantee limited beneficiaries. On the other hand, the ‘free things mentality’ among the people is a problem towards repayment of credit, which might slow down repayment rates. The model could be replicated and scaled up to other parts of the country where many stockists need empowerment in business skills and credit services. The trained stockist are now more attractable to banks and other financial institutions and can therefore benefit from the upcoming wholesaling and group lending financiers such as the AFC. 3.4.2 Credit Voucher System:Rice Production in Ahero Irrigation Scheme The credit voucher system is a model of providing agricultural inputs on credit to farmers. The principle involves provision of input using a combination of a credit voucher and cash (where vouchers cannot be used). The voucher reduced the likelihood of credit diversion to other life cycle needs. Provision of credit vouchers is staggered during the production. The model involves a number of actors i.e. the donor, a micro finance institution, SACCO, input stockists, government, and buyer of the agricultural 9 Credit inform of fertilizer, seeds, crop protection chemicals and animal feeds. 25
  • 31. 10 output. The credit voucher system otherwise referred to as Mkulima loan is being piloted in Ahero rice scheme since March 2005. The donor guarantee to repay offers a 50 % of any defaulted loans. The MFI- SAGA Thrift and Enterprise Promotion Limited (STEP) is a rural financial organization that facilitates the delivery of financial services to people living in the Kenyan districts11 around Lake Victoria region. It comprises of SAGA SACCO and SAGA Thrift and Enterprise Promotion Limited (STEP), the later manage the affairs of the SACCO. SAGA operates a Front Office Service Activities (FOSA). Members buy shares from the SACCO at Ksh 25 with a minimum of 4 shares per month (Ksh 100 per month). The shareholder can then access loan and savings products. All loans attract an interest rate of 2% per month with a rebate of 0.5% on timely repayment. The 1.5% of the interest earned is shared equally between the SAGA Sacco and the management company – STEP. The farmers who are members of the SACCO get mkulima loans up to three times the amount of shares held in the SACCO. The loan attracts a 2% per month interest rate or 24% p.a. In addition, the beneficiaries pay an insurance fee of 2% of the loan amount. No tangible collateral is required. All loans are secured by SACCO members and guarantors savings. The 75% of the mkulima loans is disbursed via the credit vouchers and 25% through cash vouchers. Cash vouchers cover, transplanting, weeding and harvesting and credit vouchers include but not limited to cost of ploughing and rotavation, seeds, fertilizers, chemicals and gunny bags. During the 2005 crop production year, the organization disbursed a total of Ksh. 6.7 million to 617 farmers in Ahero rice irrigation scheme. The farmers obtain the vouchers from MFI-SAGA and submit the vouchers to the stockists for the supply of the inputs/services, the stockists then remit the voucher to SAGA for payments. All farming activities in the scheme are supervised by the credit officers; this ensures that credit is used for the intended purposes. The disbursement of the vouchers is staggered over the production period and the loan officers supervise the farmers to ensure that the inputs and cash are not diverted. The loan for irrigated rice is 10 Meaning a farmer loan 11 Kisumu, Bondo, Busia and Rachuonyo 26
  • 32. repaid using the balloon payment method (deducted from sale of produce-check off system) upon sale but for horticulture there is a grace period of 3 months. The farmer is expected to contribute towards the cost of production by meeting the labor and transport costs. The maximum loan is Ksh. 17,500 per acre of rice and Ksh. 20,000 for horticultural crops. On average each farmer gets a loan of Ksh. 10,630. Rice yield ranges between 20 -30 bags per acre leading to an estimated net profit of Ksh. 8,600 /acre. Given that most farmers cultivate 4 acres, then majority of farmers take home between Ksh. 30,000 and Ksh. 120,000 as net profit for each growing season. The ‘high interest rate’ does not deter the farmers from borrowing. Decomposition of the cost of capital as a fraction of overall cost of production reveals that the cost of capital accounts for only 7% of the total costs. Farmers in the scheme are now better off economically and there is a spill over effect in the business community which is now more vibrant and has recorded improved sales/business. The government has contributed to the revival of the once dead Ahero scheme by reviving the scheme in 2005 following a Ksh. 20 million intervention bankrolled by the state and the Food and Agriculture Organization (FAO) that saw two pumps (with a capacity to handle 600 liters of water per second) installed and its 10 kilometer irrigation canals rehabilitated. The cost of water amounts to Ksh. 3,100 per acre and it is paid in advance directly to the National Irrigation Board (NIB) by the micro-finance institution before planting. The output market prices are negotiated before planting. Challenge and opportunities The model has incorporated Front Office Service Activities (FOSA), whose legal status is not very clear. However, there exist a big opportunity for expansion into other rice schemes. For example, the management company is replication the model in Bunyala rice scheme. Since the model has worked so well and the default rate is minimal, the management company did not need the donor credit guarantee. 27
  • 33. 3.5 Managed SACCO: a case of ‘Beach Banking’ Model This model involves a SACCO and a micro finance institution (in this case, MFI- SAGA Thrift and Enterprise Promotion Limited) which overseas the management of the SACCO at a fee recovered from paid up interest rates. Members in the SACCO buy shares which are used as collateral for leveraged loans. A share is valued at Ksh 25 with a minimum of 4 shares per month (Ksh 100 per month). The model operates eight service points otherwise referred to as ‘Beach banks’ along Lake Victoria beaches in Kisumu and Bondo District. The motivation behind this innovation is to contribute towards poverty alleviation among the fisher folks. Kenya earns about Ksh 6.9 billion annually from fishing. However, with such large amounts of money, there has been insignificant impact of fisherman’s physical and economic lifestyle, what a paradox? Most of the fishermen along Lake Victoria have been exploited by the middle men and others squander their hard earned cash due to lack of banking institutions. The service points have front offices that operate like conventional banks, providing saving and credit products. It has a current membership of 3,000 clients with a total savings of Ksh. 15 million. The beach ‘banks’ contribute 36% (Ksh. 15 million out of Ksh. 42 million) of the total savings in MFI-SAGA. On average each beach ‘banker’ has a savings of Ksh. 5000. About 55% of the beach bank savers are female fish mongers and the rest are male fishermen. Previously, most of the female fishmongers were initially constrained by lack of capital for business transactions. However, the beach banks have facilitated, thus reducing financial dependency on fishermen. 3.5.1 Market Day Loans The beach ‘bank’s offer a variety of loan products, the market day loans are a special loan facility, a very short-term loan for business people dealing with fast moving goods with quick returns. The loan is processed within the same day and is payable in 5 days with 2% interest rate. The leverage ratio is 1:2. In addition, a borrower pays a 2% insurance premium incase of death. This product is popular among fishmongers and 28
  • 34. traders. This is one of the most innovative rural finance product developed by MFI- SAGA. The market day loans account for 62% of the total beach ‘bank’ loans. Members can borrow as low as Ksh. 200 per visit and in addition; they can borrow for a number of times in a day. The cumulative average loan amount disbursed to the beach bankers is about Ksh 18,152. The ratio of borrowers to savers is 30%. Challenges and Opportunities Insecurity remains a big challenge for the success of the beach ‘banks’. There have been cases where the service points have been broken into and large sums of monies stolen. In addition, the migratory nature of the fishermen reduces the business activities thus affecting the performance of the beach ‘banks’. The beach ‘banks’ have a potential for expansion, currently only reaching 3,000 fishmongers but there exists a potential of 12,000. 3.6 Informal Group Based Rural Financing Model Informal systems are an important source of basic rural financial services, table 3 showed that these models provide between 10% to 12% of the agricultural credit, the contribution could even be higher for the non agricultural credit The informal group based rural finance models come in various forms such; merry-go- round, Mata Masu Dubara (MMD), table banking and Rotating Savings and Credit Association. The main principle behind the informal system lies in group formation. 3.6.1 Merry go –round Merry-go-round is composed of less than 20 members who contribute a specified amount of money regularly. Members vote on who is to be given lump sum amount. The merry go –rounds are most common with women mainly for the purposes of buying household items. This model does not charge any interest rate. 3.6.2 Mata Masu Dubara (MMD) The Mata Masu Dubara (MMD) model first originated from Niger in West Africa and it is currently being piloted in Rachuonyo, Homabay, Migori and Suba District of Kenya 29
  • 35. under CARE international which offers training to groups on self selection, groups formation, leadership, constitution and record keeping. The model works on the group principle; the members contribute regularly towards an objective such as purchase of agricultural inputs for the planting season. Loans are also offered at low interest rates. In addition, members save as low as Ksh. 300 in a month. There are no other charges paid by the members such as loan application, insurances and membership fee. As at September 2005, there were 163 MMD groups with a total membership of 2,560 who had mobilized a saving of Ksh. 2.7 million, a total of Ksh 4.5 had been disbursed as loans; Ksh. 934,000 had been shared out among the group members. Loan amounts ranged between Ksh 50 and Ksh 10,000. The money accumulates for a specified period after which the members divide the money and the group disintegrates. 3.6.3 Table ‘Banking’ Table ‘banking’ is a unique rural finance concept that is widely practiced in Western Kenya especially in Bungoma District. It involves group members who come together and make regular contributions. The members contribute shares to a revolving fund, which is loaned to members. During the meetings, the members who have loans make their payment plus the interest, and then every member makes the agreed contribution. All the cash collected is intended to be loaned out in the same meeting. All the transactions are recorded and every member is required to obtain a loan. The loans do not require collateral and there is a high degree of accountability and trust since all the money transactions are done on the table in the presence of all members. The members are willing to take loans at high interest rate for they know they stand to gain from the interest accruing from the loans. The interest rate varies from group to group but ranges between 10 to 20 % per loan period. The repayment period is short-term usually monthly but varies with the group. 3.6.4 Rotating Savings and Credit Associations (ROSCAs) The Rotating Savings and Credit Association (ROSCAs) variant is an advanced version of merry go round where the members contribute some monthly shares and also disburse loans to members. They have their roots in the traditional mutual guarantee 30
  • 36. system. The actual number of ROSCAS in Kenya is not known, however these associations provide credit to many low-income people. A typical ROSCA involves a group of 5 to 30 members. The Merry go round is embedded in the model. The association offer short-term loans to members at interest rates that range between 5-20% per period. Some ROSCAs and especially in Rift Valley are financially very strong and have managed to buy assets such as land and buildings. 3.7 Group Membership in Rural Kenya Group formation is a prerequisite for the formation of community owned rural finance models. Tampa data 2004 shows that 78.8% of the household had at least one member involved in some form of a group. 50.2% were in the informal/self help group, 34% in producer co-operatives, 13.1% in savings and credit co-operative and 2.5% in multipurpose co-operatives. Table 9 shows the distribution of the groups by types by agro-regional zones. Table 9: Group Type by Zone, 2004 Group Type Producer Multi-purpose Savings & Credit Self help Zone Cooperatives cooperatives cooperatives groups Total Coastal Lowlands 17.80 4.10 78.10 100 Eastern Lowlands 17.30 0.90 7.80 74.00 100 Western Lowlands 20.30 1.30 6.30 72.20 100 Marginal Rain Shadow 27.90 1.60 4.90 65.60 100 High Potential Maize Zone 37.30 2.50 10.70 49.50 100 Western Transitional 68.70 4.50 26.90 100 Western Highlands 69.30 5.80 24.80 100 Central Highlands 71.20 3.60 3.10 22.00 100 Source: Tegemeo household survey, 2004 Over 70% of the self help groups are in the low income zones of Kenya. These are the zones that are least served by the formal financial systems. An implication that there exist an opportunity for the community mobilized models of rural financing to thrive better in these areas. In addition, these groups can benefit from the current group lending through the government corporation. 31
  • 37. 3.8 A Comparative Analysis of the Models The following section looks at a brief analysis of the described models of rural finance. Table 9 outlines a comprehensive description of these models. Rural financing model are designed to meet different objectives; the Government led model and Donor- guarantee credit voucher system are designed to increase food security in the country. The emerging bank model is mainly for expansion of rural financial services. The community owned model and managed Saccos-beach banking models are mainly designed for poverty reduction. Compared to other models of financing, the emerging indigenous banks have the greatest outreach in the rural areas partly associated to mobile banking, affordable rates and reduced bureaucracy. The community owned models have the second largest clientele outreach partly because of the group masses. However, this model has a great potential for outreach. While AFC has the lowest, there exist potential for greater outreach under the group lending. The model is unlikely to meet a large clientele since only a small proportion of Kenyan land is under irrigation. Estimated annual household income generated from Tampa 2004 household survey shows that AFC clientele are above the poverty line as defined by the dollar a day (averages US $1.4 per day. Although the emerging indigenous banks have a greater clientele outreach, the model is mainly reaching the middle income group who are slightly above the poverty level (averages $ 1.2 per day). The community owned rural finance model, the donor-guarantee credit voucher system and the beach banking models reach the rural poor of low land regions. The beneficiaries earn a range US $ 0.5 to US $0.8 per day. This implies that any policy that promotes development of the community owned models is most likely to have a greater impact in improving access to rural financial services. The community models provide the lowest amounts of loans averaging from Ksh. 7000 to Ksh. 10,000 per beneficiary per year, indication that the models serve the poor in the community. The beach banking disburses slightly higher amount of loans partly because of the market day loans. 32
  • 38. Table 10: A comparative Analysis of selected Models Indicator Government led Commercial Bank Community Owned Model: Donor Guarantee Managed Sacco Model: AFC Model FSA Mbeu Input Supply System (Beach banking (Voucher system ) model) Objective Food Security Profit making Poverty reduction Poverty reduction Food security Poverty reduction Interest rates per annum 10% 12% to 18% 20% to 34% 12% 24% 24% ** Outreach ( no. of clients) 5,200 380,800 70,000 7,400 617 2,700 Average annual * HH income in Ksh 260,489 227,103 159,130 159,130 99,317 99,317 Per capital income in US Dollar per day 1.4 1.2 0.8 0.7 0.5 0.6 Average loans per client 320,000 42,942 7,215 10,000 10,000 18,153 Insurance on loans No Yes Yes Yes Yes Yes % loaned members*** N/A 21% 38% 30% N/A 30% Unit cost of lending 1 Ksh 0.5 0.22 0.13 0.08 0.09 0.02 Average Savings per client N/A 16,071 19,000 4,077 3,635 5,797 Sustainability Low High Average Average Average High Source of funds Government shareholders shareholders/interest rates/donor shareholders/interest rates Source: Author’s computation; * Annual household income and dollar per day computed from TAMPA household survey, 2004 ** 60% of the total clients, 33
  • 39. The government led model and the emerging bank provide relatively higher loan amount The results show that across these models, the proportion of rural borrowers ranges between 30% and 39%, reinforcing the fact that most households prefer to have access to a saving facility rather than a borrowing facility. This is also supported by Tampa household survey 2004 on agricultural credit, which showed that only 39% of the households tried to obtain any credit. The unit cost of lending ranges between Ksh. 0.02 and Ksh 0.5. AFC lending is the most costly; each shilling loaned out incurs an expense of Ksh 0.5. The community owned models are low cost models. Insurance on loans ensures recovery of loans incase of the death of a beneficiary. Results show that all the financiers with and exception of AFC including the community based models insures the loaned amount, insurance averages at 2% of the loaned amounts. The interest rates vary across the models. AFC has the lowest interest rate of 10% per annum. FSAs have the highest interest rates ranging from 20% to 34% per annum. The interest rates by FSA are set by the shareholders, the interest rates are highest partly because of lack of alternative to other financial institutions, to increase monthly revenue as the FSA attempts to move towards sustainability and finally earned interest is paid as dividends at the end of the year. Where markets and other support services exist, high interest rates do not deter borrowing because there are reduced covariant risks. 3.8.1 Sustainability and Outreach Most of these models have an external source of funding; in most cases the donor has a clear exit strategy. However the issue of financial sustainability remains a big challenge. AFC is mainly supported through a budgetary allocation and in some cases the donor. Given its current form, the corporation has low sustainability and low outreach. However, the implementation of group lending will most likely improve outreach, but the issue of sustainability will be uncertain because it will depend on the ability to recover loaned amount to the registered groups. Figure 3 demonstrates an outreach and sustainability frontier. The community owned models have a high outreach and low sustainability. Some attempts made to move towards sustainability are; piloting of regional management 34
  • 40. companies by FSA, withholding dividends on interest rates by Mbeu savings and credit association. Financial sustainability will require an increase in shareholding membership and improved management. The emerging indigenous banks demonstrate the high outreach and high sustainable model because the operating expenses are sourced mainly from the local shareholders capital and earned interests. The rapid expansion is demand driven. The Donor guarantee–input credit voucher system has high sustainability as evidenced by the fact that the MFI promoting the voucher system has expanded to Bunyala without the donor guarantee. However, outreach is low because in Kenya, the proportion of irrigated land is very low. The development of irrigation scheme would provide and opportunity for the expansion of the voucher system. The Managed Sacco-beach ‘banking’ model has high sustainability because it lends from the voluntary and compulsory savings from local shareholders. Currently, it has low outreach because of the few service points. There is a potential for expansion to cover 12,000 beach bankers. The informal models have high sustainability and high outreach. Figure 3: Outreach and Financial Sustainability Frontier Sustainability frontier Private commercial bank High led model- a case of Community indigenous banks Owned Models Outreach Outreach frontier Low Donor guarantee –input Supply (Credit Voucher System) AFC Low High Sustainability 35
  • 41. 3.9 Future Scenario of Rural Financing This section looks at the future scenario of rural financing. Given this background, most likely, the mainstream banks will concentrate on the niche markets in the urban centers. The emerging indigenous banks will continue to expand in the rural areas. The AFC will most likely to transform itself in order to survive. Wholesale and group lending will enable the corporation to reach more clients reach at lower costs. The MFIs will continue to serve the middle and upper income earners and will be transforming themselves into commercial banks. They will be profit motivated. Their transaction charges will go up as they go national. The rural SACCOs, ROSCAS, self-help groups will continue serving the rural people and will transform themselves into community based micro-credit units. This will most likely reduce unemployment in the rural areas. We are likely to see some form of urban- rural migration as some skilled workers will probably move to the rural areas to work in the community based micro-credit units. The credit guarantee works on limited scale and may not address the needs of the masses in the future 36