
Recomendados
Más contenido relacionado
Similar a SD-ESE-MERGED-PFDS.pdf
Similar a SD-ESE-MERGED-PFDS.pdf (20)
Más de RISHABHJAIN27097
Más de RISHABHJAIN27097 (20)
Último
Último (20)
SD-ESE-MERGED-PFDS.pdf
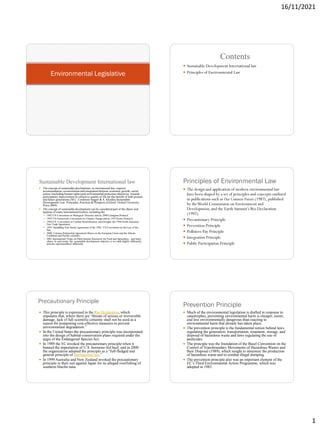
- 1. 16/11/2021 1 Environmental Legislative Contents Sustainable Development International law Principles of Environmental Law Sustainable Development International law The concept of sustainable development, in international law, requires accommodation, reconciliation and integration between economic growth, social justice (including human rights) and environmental protection objectives, towards participatory improvement in collective quality of life for the benefit of both present and future generations.(M.C. Cordonier Segger & A. Khalfan,Sustainable Development Law: Principles, Practices & Prospects (Oxford: Oxford University Press,2004). The concept of sustainable development can be considered part of the object and purpose of many international treaties, including the 1992 UN Convention on Biological Diversity and its 2000 Cartagena Protocol, 1992 UN Framework Convention on Climate Change and its 1997 Kyoto Protocol, 1994 UN Convention to Combat Desertification and Drought ,the 1994 North American Free Trade Agreement, 1995 Straddling Fish Stocks Agreement of the 1982 UN Convention on the Law of the Sea, 2000 Cotonou Partnership Agreement Betwe en the European Union and the African Caribbean and Pacific countries, 2001 International Treaty on Plant Genetic Resources for Food and Agriculture , and many others. In each treaty, the sustainable development objective is wo rded slightly differently, and also operationalised differently. Principles of Environmental Law The design and application of modern environmental law have been shaped by a set of principles and concepts outlined in publications such as Our Common Future (1987), published by theWorld Commission on Environment and Development,and the Earth Summit’s Rio Declaration (1992). Precautionary Principle Prevention Principle Polluters Pay Principle Integration Principle Public Participation Principle Precautionary Principle This principle is expressed in the Rio Declaration, which stipulates that, where there are “threats of serious or irreversible damage, lack of full scientific certainty shall not be used as a reason for postponing cost-effective measures to prevent environmental degradation.” In the United States the precautionary principle was incorporated into the design of habitat-conservation plans required under the aegis of the Endangered Species Act. In 1989 the EC invoked the precautionary principle when it banned the importation of U.S. hormone-fed beef, and in 2000 the organization adopted the principle as a “full-fledged and general principle of international law.” In 1999 Australia and New Zealand invoked the precautionary principle in their suit against Japan for its alleged overfishing of southern bluefin tuna. Prevention Principle Much of the environmental legislation is drafted in response to catastrophes, preventing environmental harm is cheaper, easier, and less environmentally dangerous than reacting to environmental harm that already has taken place. The prevention principle is the fundamental notion behind laws regulating the generation, transportation, treatment, storage, and disposal of hazardous waste and laws regulating the use of pesticides. The principle was the foundation of the Basel Convention on the Control of Transboundary Movements of Hazardous Wastes and their Disposal (1989), which sought to minimize the production of hazardous waste and to combat illegal dumping. The prevention principle also was an important element of the EC‟s Third Environmental Action Programme, which was adopted in 1983.
- 2. 16/11/2021 2 Polluters Pay Principle From the early 1970s the “polluter pays” principle has been a dominant concept in environmental law. Many economists claim that much environmental harm is caused by producers who “externalize” the costs of their activities. For example, factories that emit unfiltered exhaust into the atmosphere or discharge untreated chemicals into a river pay little to dispose of their waste. Instead, the cost of waste disposal in the form of pollution is borne by the entire community. Similarly, the driver of an automobile bears the costs of fuel and maintenance but externalizes the costs associated with the gases emitted from the tailpipe. Accordingly, the purpose of many environmental regulations is to force polluters to bear the real costs of their pollution, though such costs often are difficult to calculate precisely. In theory, such measures encourage producers of pollution to make cleaner products or to use cleaner technologies. Polluters Pay Principle(Continued) The “polluter pays” principle underlies U.S. laws requiring the cleanup of releases of hazardous substances, including oil. One such law, the Oil Pollution Act (1990), was passed in reaction to the spillage of some 11 million gallons (41 million litres) of oil into Prince William Sound in Alaska in 1989. The “polluter pays” principle also guides the policies of the EU and other governments throughout the world. A 1991 ordinance in Germany, for example, held businesses responsible for the costs of recycling or disposing of their products‟packaging, up to the end of the product‟s life cycle; however, the German Federal Constitutional Court struck down the regulation as unconstitutional. Integration Principle Environmental protection requires that due consideration be given to the potential consequences of environmentally fateful decisions. Various jurisdictions (e.g., the United States and the EU) and business organizations (e.g., the U.S. Chamber of Commerce) have integrated environmental considerations into their decision-making processes through environmental-impact-assessment mandates and other provisions. Public Participation Principle Decisions about environmental protection often formally integrate the views of the public. Generally, government decisions to set environmental standards for specific types of pollution, to permit significant environmentally damaging activities, or to preserve significant resources are made only after the impending decision has been formally and publicly announced and the public has been given the opportunity to influence the decision through written comments or hearings. In many countries citizens may challenge in court or before administrative bodies government decisions affecting the environment. These citizen lawsuits have become an important component of environmental decision making at both the national and the international level. Public participation in environmental decision making has been facilitated in Europe and North America by laws that mandate extensive public access to government information on the environment. Similar measures at the international level include the Rio Declaration and the 1998 Århus Convention, which committed the 40 European signatory states to increase the environmental information available to the public and to enhance the public‟s ability to participate in government decisions that affect the environment. Polluters Pay The European Community in its Action Programme on Environment had accepted the „polluter pays‟ principle as a part of its strategy on environmental matters. The principle Was incorporated in Article 130 R (2) of the action programme which reads as follows :- (i) Preventive action is always preferable to remedial action; (ii) Environmental damage should be rectified at source; (iii) The polluter should pay the costs of the measures taken to protect and preserve the environment; (iv) environmental policies should be a component of the European Community‟s other policies.
- 4. Index Introduction Method Purpose
- 5. Introduction Gross Happiness Index (GNH) Index is a multidimensional measure and it is linked with a set of policy and programme screening tools so that it has practical applications. The GNH Index is meant to orient the people and the nation towards happiness, primarily by improving the conditions of not yet-happy people. The policy action, of GNH Index enables the government and others to increase GNH in two ways. It can either increase percentage of people who are happy or decrease the insufficient conditions of people who are not-yet happy. In the way the GNH Index is constructed, there is a greater incentive for the government and others to decrease the insufficiencies of not-yet- happy people. The GNH Index provides an overview of performance across 9 domains of GNH i.e psychological wellbeing, time use, community vitality, cultural diversity, ecological resilience, living standard, health, education, good governance.
- 6. Method The aggregation method is a version of Alkire-Foster method (2007, 2011). The index aggregated out of 33 clustered (grouped) indicators, Each clustered indicator is further composed of several variables. When unpacked, the 33 clustered indicators have 124 variables, the basic building blocks of GNH Index.Weights attached to variables differ, with lighter weights attached to highly subjective variables. A threshold or sufficiency level is applied to each variable.At the level of domains, all the 9 domains are equally weighted as they are all considered to be equally valid for happiness.
- 7. Three cut off points have been used to identify degrees of happiness. Not all people need to be sufficient in each of 124 variables to be happy. People are diverse in the ways and means they can have fulfilling life. 50%, 66%, and 77%. People who have achieved sufficiency in less than 50% are ‘unhappy’, and they comprise only 10.4% of the population. A total of 48.7% of people have sufficiency in 50-65% of domains and are called ‘narrowly happy’. A group of 32.6%, called ‘extensively happy’, have achieved sufficiency in 66-76% – in between 6 and 7 domains. And in the last group, 8.3% of people are identified as‘deeply happy’ because they enjoy sufficiency in 77% or more of weighted indicators – which is the equivalent of 7 or more of the nine domains.
- 8. In order to have one overall index, the GNH cut off was set at 66% of the variables, which is the middle cutoff used above. People can be considered happy when they have sufficiency in 66% of the (weighted) indicators or more – that is, when they were identified as extensively happy or deeply happy. The middle cutoff gives a relatively low score of GNH index is a result of its requirement that a diverse set of conditions and states, represented by 124 variables, must be simultaneously prevalent for a person to be robustly happy. It is a tougher measure because it is not focussed on survival like poverty, but rather on flourishing over a wide array of conditions.
- 9. Purpose of GNH A GNH index would be used in: 1. Setting an alternative framework of development 2. Providing indicators to sectors to guide Development 3.Allocating resources in accordance with targets and GNH screening tools 4. Measuring people’s happiness and well being 5. Measuring progress over time; and 6. Comparing progress across the country.
- 10. By, DR. Vikas B. Varekar VEERMATA JIJABAI TECHNOLOGICAL INSTITUTE 1
- 11. COMPOSITION OF NATIONAL WEALTH Economists consider three components of national wealth: i)Natural capital ii)Human capital iii)Manufactured capital 2
- 12. Contd... Human capital- consists of people’s health, knowledge, skills and motivation, all of which are needed for productive work. Physical/Manufactured capital- physical infrastructure such as buildings, transport and communications. Natural capital- access to key natural resources, such as water, land, clean air, fisheries, forests etc. 3
- 13. Contd... According to World Bank, the most important component is the human resource, i.e., the number of people in country’s labour force and human capital. Physical and natural capital of a country also plays a significant role towards its wealth. 4
- 14. Contd... A country’s level of development determines the roles played by the different components of its national wealth. The dominance of human capital is particularly marked in the most developed countries, where natural capital is calculated to account for just 2–5 percent of aggregate wealth. By contrast, in West Africa—one of the world’s poorest regions—natural capital still prevails over physical capital, and the share of human resources is among the lowest in the world despite a large population. 5
- 15. Fig: composition of national wealth, 1994 6
- 16. ACCUMULATION OF NATIONAL WEALTH: AN INDICATOR OF SUSTAINABLE DEVELOPMENT World Bank defines sustainable development as “a process of managing a portfolio of assets to preserve and enhance the opportunities people face.” The assets that this definition refers to include not just traditionally accounted physical capital, but also natural and human capital. 7
- 17. Contd... Standard measures of wealth accumulation ignore the depletion of, and damage to, natural resources such as forests and oil deposits, along with the human resource invested. To overcome this shortcoming, World Bank had developed a statistical indicator of sustainable development, “genuine domestic saving rate” or “genuine domestic investment rate”. 8
- 18. Contd... This indicator accounts for negative growth resulting from depletion and pollution of natural capital. It also accounts for positive growth due to enhancements in human capital resulting primarily from investments in education and health services. 9
- 19. Fig: calculating the genuine saving rate 10
- 20. Fig: genuine domestic saving rate- estimates for 1998 11
- 21. Contd... Estimates show that many of the most resource- dependent countries, including all the major oil exporters, have low or negative genuine domestic savings. That means that losses of their national wealth caused by depletion of natural capital and damage done by CO2 emissions outweigh the benefits from net domestic saving and education expenditure. The conventional indicators would address such cases as positive economic growth, though such development is considered as unsustainable. 12
- 22. Contd... On the other hand, the groups of East Asian and high- income countries appear to be leading the world in the overall sustainability of their development. For such countries, part of their relative environmental sustainability results from importing energy and mineral resources instead of depleting their own. This highlights a weakness of the indicator, i.e., its focus on country level sustainability, while truly sustainable development can be only global. 13
- 23. THANK YOU 14
- 24. asdf The Millennium Development Goals Report 2015 UNITED NATIONS
- 25. Cover Inside This report is based on a master set of data that has been compiled by the Inter-Agency and Expert Group on MDG Indicators led by the Department of Economic and Social Affairs of the United Nations Secretariat, in response to the wishes of the General Assembly for periodic assessment of progress towards the MDGs. The Group comprises representatives of the international organizations whose activities include the preparation of one or more of the series of statistical indicators that were identified as appropriate for monitoring progress towards the MDGs, as reflected in the list below. A number of national statisticians and outside expert advisers also contributed. ECONOMIC AND SOCIAL COMMISSION FOR ASIA AND THE PACIFIC ECONOMIC AND SOCIAL COMMISSION FOR WESTERN ASIA ECONOMIC COMMISSION FOR AFRICA ECONOMIC COMMISSION FOR EUROPE ECONOMIC COMMISSION FOR LATIN AMERICA AND THE CARIBBEAN FOOD AND AGRICULTURE ORGANIZATION OF THE UNITED NATIONS INTERNATIONAL LABOUR ORGANIZATION INTERNATIONAL MONETARY FUND INTERNATIONAL TELECOMMUNICATION UNION INTERNATIONAL TRADE CENTRE INTER-PARLIAMENTARY UNION JOINT UNITED NATIONS PROGRAMME ON HIV/AIDS ORGANISATION FOR ECONOMIC CO-OPERATION AND DEVELOPMENT SECRETARIAT OF THE PACIFIC COMMUNITY THE WORLD BANK UNITED NATIONS CHILDREN’S FUND UNITED NATIONS CONFERENCE ON TRADE AND DEVELOPMENT UNITED NATIONS DEVELOPMENT PROGRAMME UNITED NATIONS EDUCATIONAL, SCIENTIFIC AND CULTURAL ORGANIZATION UNITED NATIONS ENTITY FOR GENDER EQUALITY AND THE EMPOWERMENT OF WOMEN - UN WOMEN UNITED NATIONS ENVIRONMENT PROGRAMME UNITED NATIONS FRAMEWORK CONVENTION ON CLIMATE CHANGE UNITED NATIONS HIGH COMMISSIONER FOR REFUGEES UNITED NATIONS HUMAN SETTLEMENTS PROGRAMME UNITED NATIONS INDUSTRIAL DEVELOPMENT ORGANIZATION UNITED NATIONS POPULATION FUND WORLD HEALTH ORGANIZATION WORLD TRADE ORGANIZATION
- 26. The Millennium Development Goals Report 2015 asdf United Nations New York, 2015
- 28. Foreword | 3 Foreword The global mobilization behind the Millennium Development Goals has produced the most successful anti-poverty movement in history. The landmark commitment entered into by world leaders in the year 2000—to “spare no effort to free our fellow men, women and children from the abject and dehumanizing conditions of extreme poverty”—was translated into an inspiring framework of eight goals and, then, into wide-ranging practical steps that have enabled people across the world to improve their lives and their future prospects. The MDGs helped to lift more than one billion people out of extreme poverty, to make inroads against hunger, to enable more girls to attend school than ever before and to protect our planet. They generated new and innovative partnerships, galvanized public opinion and showed the immense value of setting ambitious goals. By putting people and their immediate needs at the forefront, the MDGs reshaped decision-making in developed and developing countries alike. Yet for all the remarkable gains, I am keenly aware that inequalities persist and that progress has been uneven. The world’s poor remain overwhelmingly concentrated in some parts of the world. In 2011, nearly 60 per cent of the world’s one billion extremely poor people lived in just five countries. Too many women continue to die during pregnancy or from childbirth-related complications. Progress tends to bypass women and those who are lowest on the economic ladder or are disadvantaged because of their age, disability or ethnicity. Disparities between rural and urban areas remain pronounced. Experiences and evidence from the efforts to achieve the MDGs demonstrate that we know what to do. But further progress will require an unswerving political will, and collective, long-term effort. We need to tackle root causes and do more to integrate the economic, social and environmental dimensions of sustainable development. The emerging post-2015 development agenda, including the set of Sustainable Development Goals, strives to reflect these lessons, build on our successes and put all countries, together, firmly on track towards a more prosperous, sustainable and equitable world. Reflecting on the MDGs and looking ahead to the next fifteen years, there is no question that we can deliver on our shared responsibility to put an end to poverty, leave no one behind and create a world of dignity for all. Ban Ki-moon Secretary-General, United Nations
- 29. 4 | The Millennium Development Goals Report 2015 Overview At the beginning of the new millennium, world leaders gathered at the United Nations to shape a broad vision to fight poverty in its many dimensions. That vision, which was translated into eight Millennium Development Goals (MDGs), has remained the overarching development framework for the world for the past 15 years. As we reach the end of the MDG period, the world community has reason to celebrate. Thanks to concerted global, regional, national and local efforts, the MDGs have saved the lives of millions and improved conditions for many more. The data and analysis presented in this report prove that, with targeted interventions, sound strategies, adequate resources and political will, even the poorest countries can make dramatic and unprecedented progress. The report also acknowledges uneven achievements and shortfalls in many areas. The work is not complete, and it must continue in the new development era. Unprecedented efforts have resulted in profound achievements Goal 1: Eradicate extreme poverty and hunger Extreme poverty rate in developing countries 47% 1990 2015 14% 1990 1,926 million 1999 1,751 million 2015 836 million Global number of extreme poor 47% 1990 2015 14% 1990 1,926 million 1999 1,751 million 2015 836 million • • Extreme poverty has declined significantly over the last two decades. In 1990, nearly half of the population in the developing world lived on less than $1.25 a day; that proportion dropped to 14 per cent in 2015. • • Globally, the number of people living in extreme poverty has declined by more than half, falling from 1.9 billion in 1990 to 836 million in 2015. Most progress has occurred since 2000. • • The number of people in the working middle class—living on more than $4 a day—has almost tripled between 1991 and 2015. This group now makes up half the workforce in the developing regions, up from just 18 per cent in 1991. • • The proportion of undernourished people in the developing regions has fallen by almost half since 1990, from 23.3 per cent in 1990–1992 to 12.9 per cent in 2014–2016. Goal 2: Achieve universal primary education Global out-of-school children of primary school age 2000 2015 100 million 57 million 0 20% 40% 60% 80% 52% 1990 60% 2000 80% 2015 Primary school net enrolment rate in sub-Saharan Africa 2000 2015 100 million 57 million 0 20% 40% 60% 80% 52% 1990 60% 2000 80% 2015 • • The primary school net enrolment rate in the developing regions has reached 91 per cent in 2015, up from 83 per cent in 2000. • • The number of out-of-school children of primary school age worldwide has fallen by almost half, to an estimated 57 million in 2015, down from 100 million in 2000. • • Sub-Saharan Africa has had the best record of improvement in primary education of any region since the MDGs were established. The region achieved a 20 percentage point increase in the net enrolment rate from 2000 to 2015, compared to a gain of 8 percentage points between 1990 and 2000. • • The literacy rate among youth aged 15 to 24 has increased globally from 83 per cent to 91 per cent between 1990 and 2015. The gap between women and men has narrowed.
- 30. Overview | 5 Goal 3: Promote gender equality and empower women Primary school enrolment ratio in Southern Asia 1990 100 74 103 100 2015 90% of countries have more women in parliament since 1995 1990 100 74 103 100 2015 • • Many more girls are now in school compared to 15 years ago. The developing regions as a whole have achieved the target to eliminate gender disparity in primary, secondary and tertiary education. • • In Southern Asia, only 74 girls were enrolled in primary school for every 100 boys in 1990. Today, 103 girls are enrolled for every 100 boys. • • Women now make up 41 per cent of paid workers outside the agricultural sector, an increase from 35 per cent in 1990. • • Between 1991 and 2015, the proportion of women in vulnerable employment as a share of total female employment has declined 13 percentage points. In contrast, vulnerable employment among men fell by 9 percentage points. • • Women have gained ground in parliamentary representation in nearly 90 per cent of the 174 countries with data over the past 20 years. The average proportion of women in parliament has nearly doubled during the same period. Yet still only one in five members are women. Goal 4: Reduce child mortality Global number of deaths of children under five 1990 12.7 million 6 million 2015 0 20% 40% 60% 80% 100% 73% 2000 84% 2013 Global measles vaccine coverage 1990 12.7 million 6 million 2015 0 20% 40% 60% 80% 100% 73% 2000 84% 2013 • • The global under-five mortality rate has declined by more than half, dropping from 90 to 43 deaths per 1,000 live births between 1990 and 2015. • • Despite population growth in the developing regions, the number of deaths of children under five has declined from 12.7 million in 1990 to almost 6 million in 2015 globally. • • Since the early 1990s, the rate of reduction of under-five mortality has more than tripled globally. • • In sub-Saharan Africa, the annual rate of reduction of under-five mortality was over five times faster during 2005–2013 than it was during 1990–1995. • • Measles vaccination helped prevent nearly 15.6 million deaths between 2000 and 2013. The number of globally reported measles cases declined by 67 per cent for the same period. • • About 84 per cent of children worldwide received at least one dose of measles- containing vaccine in 2013, up from 73 per cent in 2000.
- 31. 6 | The Millennium Development Goals Report 2015 Goal 5: Improve maternal HEALTH Global maternal mortality ratio (deaths per 100,000 live births) 50% 60% 70% 80% 2015 1990 59% 71% 1990 380 2000 330 2013 210 Global births attended by skilled health personnel 50% 60% 70% 80% 2014 1990 59% 71% 1990 380 2000 330 2013 210 • • Since 1990, the maternal mortality ratio has declined by 45 per cent worldwide, and most of the reduction has occurred since 2000. • • In Southern Asia, the maternal mortality ratio declined by 64 per cent between 1990 and 2013, and in sub-Saharan Africa it fell by 49 per cent. • • More than 71 per cent of births were assisted by skilled health personnel globally in 2014, an increase from 59 per cent in 1990. • • In Northern Africa, the proportion of pregnant women who received four or more antenatal visits increased from 50 per cent to 89 percent between 1990 and 2014. • • Contraceptive prevalence among women aged 15 to 49, married or in a union, increased from 55 per cent in 1990 worldwide to 64 per cent in 2015. Goal 6: Combat HIV/AIDS, malaria and other diseases Global antiretroviral therapy treatment 0.8 million 2003 ART 13.6 million 2014 ART 900 million Number of insecticide- treated mosquito nets delivered in sub-Saharan Africa, 2004–2014 0.8 million 2003 ART 13.6 million 2014 ART 900 million • • New HIV infections fell by approximately 40 per cent between 2000 and 2013, from an estimated 3.5 million cases to 2.1 million. • • By June 2014, 13.6 million people living with HIV were receiving antiretroviral therapy (ART) globally, an immense increase from just 800,000 in 2003. ART averted 7.6 million deaths from AIDS between 1995 and 2013. • • Over 6.2 million malaria deaths have been averted between 2000 and 2015, primarily of children under five years of age in sub-Saharan Africa. The global malaria incidence rate has fallen by an estimated 37 per cent and the mortality rate by 58 per cent. • • More than 900 million insecticide-treated mosquito nets were delivered to malaria-endemic countries in sub-Saharan Africa between 2004 and 2014. • • Between 2000 and 2013, tuberculosis prevention, diagnosis and treatment interventions saved an estimated 37 million lives. The tuberculosis mortality rate fell by 45 per cent and the prevalence rate by 41 per cent between 1990 and 2013.
- 32. Overview | 7 Goal 7: Ensure environmental sustainability 1.9 billion people have gained access to piped drinking water since 1990 2.3 billion 4.2 billion 1990 2015 98% of ozone-depleting substances eliminated since 1990 2.3 billion 4.2 billion 1990 2015 • • Ozone-depleting substances have been virtually eliminated since 1990, and the ozone layer is expected to recover by the middle of this century. • • Terrestrial and marine protected areas in many regions have increased substantially since 1990. In Latin America and the Caribbean, coverage of terrestrial protected areas rose from 8.8 per cent to 23.4 per cent between 1990 and 2014. • • In 2015, 91 per cent of the global population is using an improved drinking water source, compared to 76 per cent in 1990. • • Of the 2.6 billion people who have gained access to improved drinking water since 1990, 1.9 billion gained access to piped drinking water on premises. Over half of the global population (58 per cent) now enjoys this higher level of service. • • Globally, 147 countries have met the drinking water target, 95 countries have met the sanitation target and 77 countries have met both. • • Worldwide, 2.1 billion people have gained access to improved sanitation. The proportion of people practicing open defecation has fallen almost by half since 1990. • • The proportion of urban population living in slums in the developing regions fell from approximately 39.4 per cent in 2000 to 29.7 per cent in 2014. Goal 8: Develop a global partnership for development Official development assistance $81 billion 2000 $ $135 billion 2014 $ 2000 6% 2015 43% Global Internet penetration $81 billion 1990 $ $135 billion 2014 $ 2000 6% 2015 43% • • Official development assistance from developed countries increased by 66 per cent in real terms between 2000 and 2014, reaching $135.2 billion. • • In 2014, Denmark, Luxembourg, Norway, Sweden and the United Kingdom continued to exceed the United Nations official development assistance target of 0.7 per cent of gross national income. • • In 2014, 79 per cent of imports from developing to developed countries were admitted duty free, up from 65 per cent in 2000. • • The proportion of external debt service to export revenue in developing countries fell from 12 per cent in 2000 to 3 per cent in 2013. • • As of 2015, 95 per cent of the world’s population is covered by a mobile-cellular signal. • • The number of mobile-cellular subscriptions has grown almost tenfold in the last 15 years, from 738 million in 2000 to over 7 billion in 2015. • • Internet penetration has grown from just over 6 per cent of the world’s population in 2000 to 43 per cent in 2015. As a result, 3.2 billion people are linked to a global network of content and applications.
- 33. 8 | The Millennium Development Goals Report 2015 Despite many successes, the poorest and most vulnerable people are being left behind Although significant achievements have been made on many of the MDG targets worldwide, progress has been uneven across regions and countries, leaving significant gaps. Millions of people are being left behind, especially the poorest and those disadvantaged because of their sex, age, disability, ethnicity or geographic location. Targeted efforts will be needed to reach the most vulnerable people. X X Gender inequality persists Women continue to face discrimination in access to work, economic assets and participation in private and public decision-making. Women are also more likely to live in poverty than men. In Latin America and the Caribbean, the ratio of women to men in poor households increased from 108 women for every 100 men in 1997 to 117 women for every 100 men in 2012, despite declining poverty rates for the whole region. Women remain at a disadvantage in the labour market. Globally, about three quarters of working-age men participate in the labour force, compared to only half of working-age women. Women earn 24 per cent less than men globally. In 85 per cent of the 92 countries with data on unemployment rates by level of education for the years 2012–2013, women with advanced education have higher rates of unemployment than men with similar levels of education. Despite continuous progress, today the world still has far to go towards equal gender representation in private and public decision-making. X X Big gaps exist between the poorest and richest households, and between rural and urban areas In the developing regions, children from the poorest 20 per cent of households are more than twice as likely to be stunted as those from the wealthiest 20 per cent. Children in the poorest households are four times as likely to be out of school as those in the richest households. Under-five mortality rates are almost twice as high for children in the poorest households as for children in the richest. In rural areas, only 56 per cent of births are attended by skilled health personnel, compared with 87 per cent in urban areas. About 16 per cent of the rural population do not use improved drinking water sources, compared to 4 per cent of the urban population. About 50 per cent of people living in rural areas lack improved sanitation facilities, compared to only 18 per cent of people in urban areas. X X Climate change and environmental degradation undermine progress achieved, and poor people suffer the most Global emissions of carbon dioxide have increased by over 50 per cent since 1990. Addressing the unabated rise in greenhouse gas emissions and the resulting likely impacts of climate change, such as altered ecosystems, weather extremes and risks to society, remains an urgent, critical challenge for the global community. An estimated 5.2 million hectares of forest were lost in 2010, an area about the size of Costa Rica. Overexploitation of marine fish stocks led to declines in the percentage of stocks within safe biological limits, down from 90 per cent in 1974 to 71 per cent in 2011. Species are declining overall in numbers and distribution. This means they are increasingly threatened with extinction. Water scarcity affects 40 per cent of people in the world and is projected to increase. Poor people’s livelihoods are more directly tied to natural resources, and as they often live in the most vulnerable areas, they suffer the most from environmental degradation. X X Conflicts remain the biggest threat to human development By the end of 2014, conflicts had forced almost 60 million people to abandon their homes—the highest level recorded since the Second World War. If these people were a nation, they would make up the twenty- fourth largest country in the world. Every day, 42,000 people on average are forcibly displaced and compelled to seek protection due to conflicts, almost four times the 2010 number of 11,000. Children accounted for half of the global refugee population under the responsibility of the United Nations High Commissioner for Refugees in 2014. In countries affected by conflict, the proportion of out-of-school children increased from 30 per cent in 1999 to 36 per cent in 2012. Fragile and conflict-affected countries typically have the highest poverty rates. X X Millions of poor people still live in poverty and hunger, without access to basic services Despite enormous progress, even today, about 800 million people still live in extreme poverty and suffer from hunger. Over 160 million children under age five have inadequate height for their age due to insufficient food. Currently, 57 million children of primary school age are not in school. Almost half of global workers are still working in vulnerable conditions, rarely enjoying the benefits associated with decent work. About 16,000 children die each day before celebrating their
- 34. Overview | 9 fifth birthday, mostly from preventable causes. The maternal mortality ratio in the developing regions is 14 times higher than in the developed regions. Just half of pregnant women in the developing regions receive the recommended minimum of four antenatal care visits. Only an estimated 36 per cent of the 31.5 million people living with HIV in the developing regions were receiving ART in 2013. In 2015, one in three people (2.4 billion) still use unimproved sanitation facilities, including 946 million people who still practise open defecation. Today over 880 million people are estimated to be living in slum-like conditions in the developing world’s cities. With global action, these numbers can be turned around. The successes of the MDG agenda prove that global action works. It is the only path to ensure that the new development agenda leaves no one behind The global community stands at a historic crossroads in 2015. As the MDGs are coming to their deadline, the world has the opportunity to build on their successes and momentum, while also embracing new ambitions for the future we want. A bold new agenda is emerging to transform the world to better meet human needs and the requirements of economic transformation, while protecting the environment, ensuring peace and realizing human rights. At the core of this agenda is sustainable development, which must become a living reality for every person on the planet. This is the final MDG report. It documents the 15-year effort to achieve the aspirational goals set out in the Millennium Declaration and highlights the many successes across the globe, but acknowledges the gaps that remain. The experience of the MDGs offers numerous lessons, and they will serve as the springboard for our next steps. Leaders and stakeholders in every nation will work together, redoubling efforts to achieve a truly universal and transformative agenda. This is the only way to ensure a sustainable future and a dignified life for all people everywhere. Wu Hongbo Under-Secretary-General for Economic and Social Affairs
- 35. 10 | The Millennium Development Goals Report 2015 Measure what we treasure: sustainable data for sustainable development As the post-2015 development agenda is being established, strengthening data production and the use of better data in policymaking and monitoring are becoming increasingly recognized as fundamental means for development. The MDG monitoring experience has clearly demonstrated that effective use of data can help to galvanize development efforts, implement successful targeted interventions, track performance and improve accountability. Thus sustainable development demands a data revolution to improve the availability, quality, timeliness and disaggregation of data to support the implementation of the new development agenda at all levels. The monitoring of the MDGs taught us that data are an indispensable element of the development agenda X X What gets measured gets done The MDG framework strengthened the use of robust and reliable data for evidence-based decision-making, as many countries integrated the MDGs into their own national priorities and development strategies. Using reliable data to monitor progress towards the MDGs also allowed governments at national and subnational levels to effectively focus their development policies, programmes and interventions. Data at the local level proved extremely helpful. Subnational monitoring of net enrolment ratios in primary and secondary education revealed large disparities between the arid and semi-arid areas of northern Kenya. In response, the Kenyan government targeted these deprived areas by establishing a specific school feeding programme, low-cost boarding primary schools and mobile schools. In Colombia, data at the subnational level showed sharply uneven rates of progress, which motivated local governments to implement key interventions according to local priorities. The Nariño region, for instance, focused on Goal 3, aiming to reduce the large gender gaps in employment and political participation. In Cundinamarca, the focus was on accelerating progress on Goal 1 in the poorest municipalities. X X Real data improvement occurs when demand and policy support meet The MDGs energized efforts to increase the production and use of development data. Their monitoring requirements drew attention to the need for strengthening statistical capacity and improving statistical methodologies and information systems at both national and international levels. Over time, this increased the availability of more and better data, while improving coordination within national statistical systems and leading to new statistical methodologies. To support MDGs monitoring in the Philippines, the National Statistical Coordination Board (NSCB) was designated as the national custodian of MDG indicators. The Board formulated an MDGs statistical development programme, which enabled data compilation from different sources and formulation of programmes and policies to support the collection, dissemination and improvement of data for policymaking. A community-based monitoring system was also developed to provide data to monitor and evaluate local development plans. Global monitoring of the MDGs improved dramatically, assisted by a close collaboration between international agencies and country experts. Between 2000 and 2015, the number of surveys and censuses in the database of the WHO/UNICEF Joint Monitoring Programme on Water Supply and Sanitation has increased six-fold. Country coverage for a subset of 22 official MDG indicators improved significantly between 2003 and 2014. While in 2003, only 2 per cent of developing countries had at least two data points for 16 or more of the 22 indicators, by 2014 this figure had reached 79 per cent. This reflects the increased capacity of national statistical systems to address monitoring requirements and improvements in data- reporting mechanisms. It also shows the benefits of better access to national sources by international agencies.
- 36. Measure what we treasure: sustainable data for sustainable development | 11 Proportion of countries and territories in the developing regions with at least two data points for 22 selected MDG indicators, 2003, 2006 and 2014 (percentage) 0 10 20 30 40 50 60 70 80 90 100 16–22 11–15 6–10 0–5 2003 19 30 48 2 2006 6 12 19 64 2014 2 6 13 79 Number of indicator series with at least two data points: X X Despite improvement, critical data for development policymaking are still lacking Large data gaps remain in several development areas. Poor data quality, lack of timely data and unavailability of disaggregated data on important dimensions are among the major challenges. As a result, many national and local governments continue to rely on outdated data or data of insufficient quality to make planning and decisions. A World Bank study shows that about half of the 155 countries lack adequate data to monitor poverty and, as a result, the poorest people in these countries often remain invisible. During the 10-year period between 2002 and 2011, as many as 57 countries (37 per cent) had none or only one poverty rate estimate. In sub-Saharan Africa, where poverty is most severe, 61 per cent of countries have no adequate data to monitor poverty trends. Lack of well-functioning civil registration systems with national coverage also results in serious data gaps, especially for vital statistics. According to the UN Inter- agency Group for Child Mortality Estimation, only around 60 countries have such systems; the others rely mostly on household surveys or censuses to estimate child mortality. Better data are needed for the post-2015 development agenda X X Only by counting the uncounted can we reach the unreached High-quality data disaggregated by key dimensions beyond the basics of age and sex, including migrant status, indigenous status, ethnicity and disability among others, are key to making decisions and monitoring progress towards achieving sustainable development for all. Estimating the size and exploring the attributes of small population groups requires large sample sizes or full population counts. National population and housing censuses provide an important data source and sampling frame for estimating the size of vulnerable minority groups. Remarkable progress has been made, for instance, in the availability of detailed data on indigenous peoples in Latin America. In the 2010 census round, 17 of 20 countries in Latin America included questions on indigenous people to provide detailed data for this group. Data on maternal care revealed that around 2000, the proportion of births attended by health professionals was 38 percentage points lower among indigenous women than non-indigenous women in Mexico, and 45 percentage points lower in Peru. The availability of these disaggregated data led to the adoption of more effective interventions to reduce inequality. By 2012, more than 80 per cent of births to indigenous women were attended by health personnel in both countries. Births attended by skilled personnel in Mexico and Peru, by indigenous status, selected years (percentage) 0 10 20 30 40 50 60 70 80 90 100 Non-indigenous women Indigenous women Mexico 2003 57 95 2012 81 99 Peru 2000 22 67 2012 83 92
- 37. 12 | The Millennium Development Goals Report 2015 X X Real-time data are needed to deliver better decisions faster In today’s rapidly changing world, real-time information is needed to prepare and respond to economic, political, natural and health crises. However, most development data have a time lag of two to three years. Recent innovations are helping to circumvent this problem. For example, UNICEF and partners have used text messaging (SMS) technology to facilitate real-time collection and sharing of information about the Ebola outbreak. In Liberia, hundreds of health workers have used mHero (Health Worker Electronic Response and Outreach) and in Guinea and Sierra Leone, thousands of young people are using U-Report. This real- time information has helped rapidly locate new cases, determined what supplies are needed and disseminated lifesaving messages. X X Geospatial data can support monitoring in many aspects of development, from health care to natural resource management Knowing where people and things are and their relationship to each other is essential for informed decision-making. Comprehensive location-based information is helping Governments to develop strategic priorities, make decisions, and measure and monitor outcomes. Once the geospatial data are created, they can be used many times to support a multiplicity of applications. A geodetic reference frame allows precise observations and ‘positioning’ of anything on the Earth and can be used for many social, economic and environmental purposes, such as precision agriculture and monitoring changes in sea level rise. For example, geospatial information was used to support health care and design social intervention measures during the chikungunya virus (chick-V) outbreak across the Caribbean. In Trinidad and Tobago, geospatial applications for smart phones assisted the Ministry of Health to identify the location of infected persons and use the information to contain the outbreak. Strong political commitment and significantly increased resources will be needed to meet the data demand for the new development agenda X X Strengthening statistical capacity is the foundation for monitoring progress of the new development agenda To improve the availability, reliability, timeliness and accessibility of data to support the post-2015 development agenda, sustainable investments are needed in statistical capacity at all levels, especially the national level. The scaling-up of national statistical capacities and the strengthening and modernization of statistical systems will require ensuring effective institutional arrangements and internal coordination, sustainable human resources, sustainable financial resources (internal and external) and technical cooperation. National statistical offices should have a clear mandate to lead the coordination among national agencies involved and to become the data hub for monitoring. For instance, improving a country’s civil registration and vital statistics system requires strong commitment from the government and long-term efforts in strengthening administrative infrastructure. Progress in the past 20 years has been very slow, but a few countries have made great strides. In South Africa, for example, 85 per cent of births in 2012 were registered compared to 56 per cent of births in 2003. In Thailand, thanks to efforts begun in 1996, more than 95 per cent of births and deaths are now registered. X X New technology is changing the way data are collected and disseminated New information and communication technologies provide unprecedented opportunities for data collection, analysis and dissemination. Today, 95 per cent of the global population is covered by a cellular network, while mobile- cellular subscriptions have grown to over 7 billion. Internet penetration has increased to 43 per cent of the world’s population, linking 3.2 billion people to a global network of content and applications. New data collection technologies, such as Computer-Assisted Personal Interviewing (CAPI) and mobile text surveys (SMS), and new data sources, such as social media posts, online search records and mobile phone call records, allow faster data collection and provide near real-time information. The 2010 Brazilian Census introduced several innovations in its operation. Digital census mapping was developed and integrated with the National Address File, which made the census data collection more efficient and more accurate. Field operations through CAPI devices equipped with a Global Positioning System receiver allowed better monitoring of the field operation and real-time data editing.
- 38. Measure what we treasure: sustainable data for sustainable development | 13 To cover difficult-to-reach populations, Brazil also used Internet data collection as a complementary system. However, new data sources and new data collection technologies must be carefully applied to avoid a reporting bias favouring people who are wealthier, more educated, young and male. The use of these innovative tools might also favour those who have greater means to access technology, thus widening the gap between the “data poor” and the “data rich”. X X Global standards and an integrated statistics system are key elements for effective monitoring International standards are important for building national statistical capacity. One of the Fundamental Principles of Official Statistics states that “the use by statistical agencies in each country of international concepts, classifications and methods promotes the consistency and efficiency of statistical systems at all official levels“. The Secretary- General’s Independent Expert Advisory Group on the Data Revolution for Sustainable Development also highlighted in its report the need for a “Global consensus on data” to adopt principles concerning legal, technical, privacy, geospatial and statistical standards that facilitate openness and information exchange while promoting and protecting human rights. Measuring sustainability is a highly technical task that requires capturing complex economic, societal and environmental interactions. Therefore, an integrated framework of indicators is needed to cover these three dimensions cohesively. Integration benefits not only data users, but also data producers and providers by reducing the respondents’ burden, the likelihood of errors and the long- term costs. Harnessing the benefits of statistical integration requires investment in the adoption of statistical standards, developing and re-engineering of statistical production processes, and changing institutional arrangements. X X Promoting open, easily accessible data and data literacy is key for effective use of data for development decision-making Data for development are public goods and should be made available to the public in open formats. Open data supports government transparency and accountability, enables the use of collective intelligence to make smarter policy decisions, increases citizen engagement and promotes government efficiency and effectiveness. Besides data, information on definitions, data quality, methods used in collecting data and other important metadata also need to be made widely available. In addition to opening up data, great efforts need to be made to release data in machine- readable formats and to provide free visualization and analysis tools. With an increasing volume of data available, people will also need the skills to use and interpret them correctly. Governments, international organizations and other stakeholders should support implementation of data literacy programmes, provide e-learning opportunities and include data literacy as a part of school curriculum. X X Together we can measure what we treasure Data, as the basis for evidence-based decision-making and accountability, are a crucial pillar of the post-2015 development agenda. The necessary data revolution is a joint responsibility of governments, international and regional organizations, the private sector and civil society. Building a new partnership will be essential to ensure that data are available to inform the post-2015 development agenda and support development decision-making for the next 15 years.
- 39. 14 | The Millennium Development Goals Report 2015 Goal 1 Eradicate extreme poverty and hunger Target 1.A Halve, between 1990 and 2015, the proportion ofpeople whose income is less than $1 a day The extreme poverty rate has dropped significantly in most developing regions 66% 57 Proportion of people living on less than $1.25 a day, 1990, 2011 and 2015 (percentage) Note: Sufficient country data are not available for Oceania. 0 10 20 30 40 50 60 70 80 90 100 World Developing regions Developing regions (excluding China) Northern Africa Western Asia Caucasus and Central Asia Latin America and the Caribbean Eastern Asia (China only) South-Eastern Asia Southern Asia (excluding India) Southern Asia Sub-Saharan Africa 1990 2011 2015 projection Percentage change between 1990 and 2015 2015 target 57 47 52 23 53 20 46 12 61 6 13 5 8 4 5 5 2 2 41 22 47 18 36 15 41 17 14 7 4 4 2 3 1 18 14 12 28% 73% 84% 94% 66% 77% 46% 81% 57% 69% 68% X X More than 1 billion people have been lifted out of extreme poverty since 1990. X X Despite progress, almost half of the world’s employed people work in vulnerable conditions. X X The proportion of undernourished people in the developing regions has fallen by almost half since 1990. X X One in seven children worldwide are underweight, down from one in four in 1990. X X By the end of 2014, conflicts had forced almost 60 million people to abandon their homes. Key facts
- 40. Goal 1: Eradicate extreme poverty and hunger | 15 Global poverty has declined significantly over the past two decades. The MDG target of reducing by half the proportion of people living in extreme poverty was achieved five years ago, ahead of the 2015 deadline. The latest estimates show that the proportion of people living on less than $1.25 a day globally fell from 36 per cent in 1990 to 15 per cent in 2011. Projections indicate that the global extreme poverty rate has fallen further, to 12 per cent, as of 2015. The poverty rate in the developing regions has plummeted, from 47 per cent in 1990 to 14 per cent in 2015, a drop of more than two thirds. By 2011, all developing regions except sub-Saharan Africa had met the target of halving the proportion of people who live in extreme poverty (Oceania has insufficient data). The world’s most populous countries, China and India, played a central role in the global reduction of poverty. As a result of progress in China, the extreme poverty rate in Eastern Asia has dropped from 61 per cent in 1990 to only 4 per cent in 2015. Southern Asia’s progress is almost as impressive—a decline from 52 per cent to 17 per cent for the same period—and its rate of reduction has accelerated since 2008. In contrast, sub-Saharan Africa’s poverty rate did not fall below its 1990 level until after 2002. Even though the decline of poverty has accelerated in the past decade, the region continues to lag behind. More than 40 per cent of the population in sub-Saharan Africa still lives in extreme poverty in 2015. In Western Asia, the extreme poverty rate is expected to increase between 2011 and 2015. The number of people living in extreme poverty has declined by more than half since 1990 Number of people living on less than $1.25 a day worldwide, 1990¬2015 (millions) 0 200 400 600 800 1,000 1,200 1,400 1,600 1,800 2,000 2015 (projection) 2011 2008 2005 2002 1999 1996 1993 1990 1,926 1,939 1,754 1,751 1,632 1,371 1,255 1,011 836 The absolute number of people living in extreme poverty globally fell from 1.9 billion in 1990 to 1 billion in 2011. Estimates suggest that another 175 million people have been lifted out of extreme poverty as of 2015. Thus, the number of people worldwide living on less than $1.25 a day has also been reduced by half from its 1990 level. The world’s extremely poor people are distributed very unevenly across regions and countries. The overwhelming majority of people living on less than $1.25 a day reside in two regions—Southern Asia and sub-Saharan Africa—and they account for about 80 per cent of the global total of extremely poor people. Nearly 60 per cent of the world’s 1 billion extremely poor people lived in just five countries in 2011: India, Nigeria, China, Bangladesh and the Democratic Republic of the Congo (ranked from high to low).
- 41. 16 | The Millennium Development Goals Report 2015 Women face a greater risk of living inpoverty Ratio of women to men of working age (20 to 59) in the lowest wealth quintile of all households, selected developing countries, 2000¬2013 Notes: This indicator is weighted by the ratio of females to males aged 20–59 in all households to reflect the fact that women may be overrepresented in the entire population. It uses the wealth asset index in the Demographic and Health Surveys and Multiple Indicator Cluster Surveys as a proxy measure for poverty. Values above 103 indicate that women are overrepresented in the lowest wealth quintile while values below 97 indicate that men are overrepresented in the lowest wealth quintile. Values between 97 and 103 indicate parity. 70 80 90 100 110 120 130 0 15 30 45 60 75 In 41 countries, women are more likely than men to live in poor households In 17 countries, women are equally likely as men to live in poor households In 17 countries, women are less likely than men to live in poor households Among the 1 billion people who were still living in extreme poverty worldwide in 2011, it is unknown how many were women and girls. In part this is because measures of poverty rely on income or consumption data collected at the household level, rather than at the individual level. This makes it difficult to differentiate poverty rates within households, and hence to understand gender differences in the incidence, severity and impact of poverty. A recent study used a wealth asset index as a proxy for household poverty to compare the percentage of women and men aged 20–59 who live in the lowest wealth quintile of all households. Using this measure, the study found that women are more likely to live in poverty in 41 out of 75 countries with data. Further analysis indicates that in countries where women are overrepresented in the lowest wealth quintile of households, the households are more likely to be headed by women or to have no male adults. This suggests a greater risk of poverty among separated women, widows and single mothers, including self-reported heads of household without a male partner. Using conventional national poverty lines, another study found that in Latin America and the Caribbean, the ratio of women to men in poor households increased from 108 women for every 100 men in 1997 to 117 women to every 100 men in 2012. This upward trend is all the more concerning because it took place in the context of declining poverty rates for the whole region. Many factors contribute to women’s heightened vulnerability to poverty. These include unequal access to paid work, lower earnings, lack of social protection and limited access to assets, including land and property. Even where women are equally as likely to live in poor households as men, they are more likely to be deprived in other important areas of well-being, such as education. Understanding the characteristics of the world’s poorest people and the reasons for their deprivation is crucial in determining how best to target and eradicate poverty. It is clear that greater efforts are needed to produce high- quality poverty and gender statistics if we are to monitor progress effectively in eradicating extreme poverty for all people everywhere.
- 42. Goal 1: Eradicate extreme poverty and hunger | 17 Target 1.B Achieve full and productive employment and decent work for all, including women and young people Employment opportunities are being outpaced by the growing labour force Employment-to-population ratio, 1991 and 2015 (percentage) 0 10 20 30 40 50 60 70 80 90 100 Developed regions Developing regions Oceania Eastern Asia South-Eastern Asia Sub-Saharan Africa Latin America and the Caribbean Caucasus and Central Asia Southern Asia Western Asia Northern Africa 1991 2015 projection 41 47 58 57 63 67 58 74 67 64 57 56 61 68 68 67 65 62 60 53 46 43 As the global economy has entered a new period combining slower growth, widening inequalities and turbulence, employment is not expanding fast enough to keep up with the growing labour force. The global employment-to-population ratio—the proportion of the working-age population that is employed—has fallen from 62 per cent in 1991 to 60 per cent in 2015, with an especially significant downturn during the global economic crisis of 2008/2009. According to the International Labour Organization, more than 204 million people are unemployed in 2015. This is over 34 million more than before the start of the economic crisis and 53 million more than in 1991. Employment opportunities have diminished in both the developing and the developed regions. The employment- to-population ratio in the developing regions has fallen by 3.3 percentage points from 1991 to 2015, while in the developed regions it has declined by 1 percentage point. The largest declines are found in Eastern Asia and Southern Asia, which have experienced drops in the employment-to-population ratio of 6.7 and 4.6 percentage points, respectively. The employment situation has improved slightly in sub-Saharan Africa, but progress in livelihoods has been offset by persistently high underemployment and informal employment, as well as low labour productivity. Youth, especially young women, continue to be disproportionately affected by limited employment opportunities and unemployment. Only four in ten young women and men aged 15–24 are employed in 2015, compared with five in ten in 1991. This represents a fall of more than 10 percentage points. While the drop is partially a result of young people staying longer in school, still about 74 million young people are looking for a job in 2015. Globally, the youth unemployment rate is almost three times higher than the rate for adults. In 2015, the situation is most acute in Northern Africa and Western Asia, where the proportion of young people that is employed is only half of that of the entire working-age population.
- 43. 18 | The Millennium Development Goals Report 2015 The proportion of workers living inextreme poverty has fallen sharply Proportion of employed people living on less than $1.25 a day, 1991 and 2015 (percentage) 0 10 20 30 40 50 60 70 80 90 100 Developing regions Western Asia Northern Africa Caucasus and Central Asia Latin America and the Caribbean Eastern Asia South-Eastern Asia Southern Asia Oceania Sub-Saharan Africa 1991 2015 projection 57 51 53 50 68 8 5 5 52 1 1 1 2 2 11 3 7 17 18 36 The number of workers living in extreme poverty has declined dramatically over the past 25 years, despite the global economic crisis. In 1991, close to half of the workers in the developing regions were living with their families on less than $1.25 per person per day. This rate has dropped to 11 per cent in 2015, corresponding to a two-thirds decline in the number of extremely poor workers, from 900 million in 1991 to 300 million in 2015. However, progress across regions has been uneven. In 2015, 80 per cent of the working poor reside in sub- Saharan Africa and Southern Asia. The working middle class makes up almost half the workforce in the developing world Employment by economic class in the developing regions, 1991 and 2015 (percentage of total employment) 0 20 40 60 80 100 Developed middle class and above (above $13) Developing middle class (between $4 and $13) Near poor (between $2 and $4) Moderately poor (between $1.25 and $2) Extremely poor (less than $1.25) 2015 projection 11 13 35 25 16 1991 5 49 19 14 13 Based on the five economic classes defined by the International Labour Organization, the number of people in the working middle classes—living on more than $4 a day—has almost tripled between 1991 and 2015. People in this group now make up almost half the workforce in the developing regions, up from 18 per cent in 1991. Yet, that means that half of workers and their families still live on less than $4 a day. Few are covered by social protection systems, and they face the constant risk of slipping back into poverty. Much work needs to be done to raise productivity, promote sustainable structural transformation and expand social protection systems for the poorest and most vulnerable workers and their families.
- 44. Goal 1: Eradicate extreme poverty and hunger | 19 Despite progress, almost half of the world’s employed people are still working invulnerable conditions Number and proportion of own-account and contributing family workers in total employment, 1991¬2015 1,200 1,250 1,300 1,350 1,400 1,450 1,500 2015 (projection) 2011 2007 2003 1999 1995 1991 40 42 44 46 48 50 52 54 56 58 60 Left axis: number of workers in vulnerable employment Right axis: proportion of workers in vulnerable employment Millions Percentage The proportion of workers in vulnerable employment— defined as the share of own-account work and contributing family employment in total employment— has continued to decline in all regions. The most significant progress has been made in Eastern Asia, where the proportion of people in vulnerable employment has dropped from 71.2 per cent in 1991 to 39.6 per cent in 2015. Globally, however, 45 per cent of all workers are still working in vulnerable conditions. These workers rarely have the benefits associated with decent work. Sub-Saharan Africa and Southern Asia account for more than half of the world’s vulnerable employment, with three out of four workers falling in this category. The number of workers in vulnerable employment has increased by 25 million since 2008, because of the increasing number of people entering the labour market and limited opportunities for paid employment. Currently there are 1.45 billion workers in vulnerable employment worldwide.
- 45. 20 | The Millennium Development Goals Report 2015 Target 1.C Halve, between 1990 and 2015, the proportion of people who suffer from hunger Progress on ending hunger has been significant despite the challenging global environment Number and proportion of undernourished people in the developing regions, from 1990¬1992 to 2014¬2016 0 5 10 15 20 25 0 200 400 600 800 1,000 1,200 2 0 1 4 ¬ 1 6 ( p r o j e c t i o n ) 2 0 1 1 ¬ 1 3 2 0 0 8 ¬ 1 0 2 0 0 5 ¬ 0 7 2 0 0 2 ¬ 0 4 1 9 9 9 ¬ 0 1 1 9 9 6 ¬ 9 8 1 9 9 3 ¬ 9 5 1 9 9 0 ¬ 9 2 23.3 22.1 19.7 18.3 18.3 17.3 15.0 13.7 12.9 991 991 926 902 940 927 843 793 780 Percentage Millions Left axis: number of undernourished people Right axis: proportion of undernourished people Right axis: 2015 target Current estimates suggest that about 795 million people are undernourished globally. This means that nearly one in nine individuals do not have enough to eat. The vast majority of them (780 million people) live in the developing regions. However, projections indicate a drop of almost half in the proportion of undernourished people in the developing regions, from 23.3 per cent in 1990–1992 to 12.9 per cent in 2014–2016. This is very close to the MDG hunger target. Rapid progress during the 1990s was followed by a slower decline in hunger in the first five years of the new millennium and then a rebound starting around 2008. The projections for the most recent period mark a new phase of slower progress. Progress in reducing hunger has been significant despite the challenging global environment over the last decade. Obstacles have included volatile commodity prices, higher food and energy prices, rising unemployment and economic recessions in the late 1990s and in 2008/2009. Frequent extreme weather events and natural disasters have also taken a considerable toll on lives and livelihoods, and eventually on progress towards global food security. In a growing number of countries, political instability and civil strife have aggravated the effects of natural disasters, resulting in numerous and significant humanitarian crises. These developments have slowed progress in reducing food insecurity in some of the most vulnerable countries and regions of the world.
- 46. Goal 1: Eradicate extreme poverty and hunger | 21 Marked differences in hunger prevalence persist across regions Proportion of undernourished people, 1990¬1992 and 2014¬2016 (percentage) 0 5 10 15 20 25 30 35 40 Developing regions Caucasus and Central Asia Western Asia South-Eastern Asia Eastern Asia Oceania Southern Asia Caribbean Sub-Saharan Africa Latin America Northern Africa 1990¬92 2014¬16 projection 2015 target 33 23 23 23 14 14 14 10 8 8 7 6 16 16 24 27 31 20 10 <5 <5 <5 13 The rate of hunger reduction varies widely by region. The Caucasus and Central Asia, Eastern Asia, Latin America and South-Eastern Asia have reached the hunger target, due mainly to rapid economic growth in the past two decades. China alone accounts for almost two thirds of the total reduction in the number of undernourished people in the developing regions since 1990. Northern Africa is close to eradicating severe food insecurity, having attained an overall level below 5 per cent. In contrast, the pace of reduction in the Caribbean, Oceania, Southern Asia and sub-Saharan Africa has been too slow to achieve the target. Southern Asia faces the greatest hunger burden, with about 281 million undernourished people. Progress in Oceania has been slow because of heavy dependence on food imports by the small islands that constitute the majority of countries in that region. Food security in this region is also hampered by natural and human-caused disasters, which often result in volatile prices and sudden and unpredictable changes in the availability of important staple foods. In sub-Saharan Africa, projections for the 2014–2016 period indicate a rate of undernourishment of almost 23 per cent. While the hunger rate has fallen, the number of undernourished people has increased by 44 million since 1990, reflecting the region’s high population growth rate. The situation varies widely across the subregions. Northern, Southern and Western Africa have already met or are close to meeting the target. But in Central Africa progress has been hampered by rapid population growth and environmental fragility as well as economic and political upheaval. The number of undernourished people in the subregion has doubled since 1990. In Western Asia, a starkly different pattern emerges. Despite a relatively low number of undernourished people and fast progress in reducing food insecurity in several countries, projections indicate that the prevalence of undernourishment will rise by 32 per cent between 1990–1992 and 2014–2016 due to war, civil unrest and a rapidly growing number of refugees.
- 47. 22 | The Millennium Development Goals Report 2015 Prevalence of underweight children continues to decline but not fast enough for all regions to reach the target Proportion of children under age five who are moderately or severely underweight, 1990 and 2015 (percentage) * 1990 baseline data for Caucasus and Central Asia refer to 1995 and 2015 target is half of the 1995 rate. Note: The trend analysis was based on harmonized estimates on child malnutrition from the United Nations Children’s Fund, the World Health Organization and the World Bank. 1990 2015 projection 2015 target 95 per cent confidence intervals 0 10 20 30 40 50 60 70 80 90 100 Southern Asia Sub-Saharan Africa Oceania South-Eastern Asia Western Asia Caucasus and Central Asia* Northern Africa Latin America and Caribbean World Eastern Asia 50 28 29 20 18 19 31 16 14 4 9 4 10 4 15 2 7 2 25 14 The proportion of children under age five who are underweight has been cut almost in half between 1990 and 2015, according to global projections, and it is possible that the target has been achieved. Yet over 90 million children under age five—one in seven children worldwide—remain underweight. Being underweight puts children at greater risk of dying from common infections, increases the frequency and severity of such infections and contributes to delayed recovery. Poor nutrition in the first 1,000 days of life is also associated with impaired cognitive ability and reduced school and work performance. Two regions account for nearly 90 per cent of all underweight children in 2015—half live in Southern Asia and one third in sub-Saharan Africa. Eastern Asia and Latin America and the Caribbean have clearly met the target. Projections indicate that the Caucasus and Central Asia, Northern Africa, South- Eastern Asia and Western Asia likely have met the target too. While Southern Asia has the highest underweight prevalence, with approximately one in three children still affected in 2015, the region has experienced the largest absolute decrease since 1990, a 22 percentage-point drop. In sub-Saharan Africa the underweight rate has fallen by only one third since 1990. However, due to the region’s growing population, the number of underweight children has actually risen. One in four children under five worldwide have stunted growth, but stunting is declining Stunting—defined as inadequate height for age—is a better measure than underweight of the cumulative effects of undernutrition and infection during the critical 1,000-day period from pregnancy to the child’s second birthday. Stunting is also more common than underweight, affecting approximately one in four children under five, or 161 million children worldwide in 2013. This chronic form of undernutrition puts these children at risk of diminished cognitive and physical development. The number of stunted children has fallen in all regions except sub-Saharan Africa, where the numbers increased by about one third between 1990 and 2013. Children from the poorest 20 per cent of the population are more than twice as likely to be stunted as those from the wealthiest quintile. Stunting and other forms of malnutrition can be reduced through proven interventions. These include improving maternal nutrition, especially before, during and immediately after pregnancy; early and exclusive breastfeeding; and timely introduction of safe, appropriate and high-quality complementary food for infants, accompanied by appropriate micronutrient interventions.
- 48. Goal 1: Eradicate extreme poverty and hunger | 23 Conflicts have forced almost 60 million people from their homes Number of forcibly displaced persons, 2000¬2014 (millions) 0 10 20 30 40 50 60 2014 2012 2010 2008 2006 2004 2002 2000 Internally displaced persons Total number of forcibly displaced persons Refugees and asylum seekers 38 41 40 39 42 44 45 60 In 2014, the world witnessed conflicts, violence and human rights violations that resulted in the massive displacement of people, either within or outside their home countries. During the year, an average of 42,000 people each day were forced to abandon their homes and seek protection due to conflicts, such as those in Iraq, Nigeria, Pakistan, South Sudan, the Democratic Republic of the Congo, the Syrian Arab Republic and Ukraine. This is almost four times the figure of 11,000 people only four years earlier. By the end of 2014, almost 60 million people had been forcibly displaced worldwide, the highest level recorded since the Second World War. If these people were a nation, they would make up the twenty-fourth largest country in the world. Roughly one third of them were refugees or asylum seekers, including 14.4 million individuals under the responsibility of the United Nations High Commissioner for Refugees (UNHCR) and 5.1 million Palestinian refugees registered with the United Nations Relief and Works Agency for Palestine Refugees in the Near East. In addition, close to 1.8 million individuals were waiting for a decision on asylum applications by the end of 2014. The global figure of displaced people also includes more than 38 million people displaced within the borders of their own countries. Nine out of ten refugees under the UNHCR mandate are located in the developing regions. This compares to seven out of ten a decade ago. The top three source countries of refugees at the end of 2014 were the Syrian Arab Republic (3.9 million), Afghanistan (2.6 million) and Somalia (1.1 million). Together they accounted for more than half of all refugees under the responsibility of UNHCR. Based on available evidence, children accounted for half of the global refugee population under the UNHCR mandate in 2014, the highest proportion in 10 years. Over the past decade, the number of refugee children has been growing intermittently, from a low of 41 per cent in 2009. This increase is principally driven by the growing number of Afghan, Somali and Syrian refugee children. Eradicating poverty and hunger is central to the post-2015 development agenda Although the MDG targets of halving the proportion of people living in extreme poverty and hunger have been met or almost met, the world is still far from reaching the MDG goal of eradicating extreme poverty and hunger. In 2015, an estimated 825 million people still live in extreme poverty and 800 million still suffer from hunger. Eradicating poverty and hunger remains at the core of the post-2015 development agenda. Eliminating the remaining extreme poverty and hunger will be challenging. Many of the people suffering the most live in fragile contexts and remote areas. Access to good schools, health care, electricity, safe water and other critical services remains elusive for many people, and it is frequently determined by socioeconomic status, gender, ethnicity or geography. For those who have been able to climb out of poverty, progress is often fragile and temporary; economic shocks, food insecurity and climate change threaten to rob them of their hard-won gains. The post-2015 development agenda will pick up where the MDGs left off. The remaining gaps must be filled in order to eradicate poverty and hunger and promote sustained and inclusive economic growth, allowing people everywhere to thrive.
- 49. 24 | The Millennium Development Goals Report 2015 Goal 2 Achieve universal primary education Target 2.A Ensure that, by 2015, children everywhere, boys and girls alike, will be able to complete a full course of primary schooling Across the world, tremendous progress has been made since 2000 in enrolling children in primary school Adjusted net enrolment rate* in primary education, 1990, 2000 and 2015 (percentage) 1990 0 20 40 80 100 2000 2015 projection 60 Latin America and the Caribbean 87 94 94 Sub-Saharan Africa 52 60 80 South-Eastern Asia 94 93 93 Caucasus and Central Asia 95 95 Southern Asia 95 75 80 Western Asia 95 84 86 Oceania 95 69 Eastern Asia 97 96 97 Northern Africa 99 90 80 Developed regions 96 97 96 Developing regions 80 83 91 * Adjusted net enrolment rate is defined as the number of pupils of the official age for primary education enrolled either in primary or secondary school, expressed as a percentage of the total population in that age group. Note: 2000 figure for Oceania is not available. 1990 figure for Caucasus and Central Asia is not available. X X The primary school net enrolment rate in the developing regions has reached an estimated 91 per cent in 2015, up from 83 per cent in 2000. X X The number of out-of-school children of primary school age worldwide has fallen by almost half, to an estimated 57 million in 2015, from 100 million in 2000. X X Between 1990 and 2012, the number of children enrolled in primary school in sub-Saharan Africa more than doubled, from 62 to 149 million. X X In the developing regions, children in the poorest households are four times as likely to be out of school as those in the richest households. X X The literacy rate among youth aged 15 to 24 has increased globally from 83 per cent to 91 per cent between 1990 and 2015. Key facts
- 50. Goal 2: Achieve universal primary education | 25 Considerable progress has been made in expanding primary education enrolment since 1990, particularly since the adoption of the MDGs in 2000. Yet in some developing countries many children of primary education age do not attend school, and many children who begin primary school do not complete it. Progress has been erratic since 1990. Between 1990 and 2000, the enrolment rate in the developing regions increased from 80 per cent to just 83 per cent. After 2000, improvement accelerated, and the adjusted net enrolment rate in primary education reached 90 per cent in 2007. After 2007, progress stalled. The enrolment rate has not increased significantly, and projections based on the extrapolation of trends between 2007 and 2012 indicate that nearly one in ten primary-school-age children remain out of school in 2015. A threshold of at least 97 per cent is frequently used to determine whether universal enrolment has been attained. Based on this threshold, enrolment in primary education is now universal or nearly universal in Eastern Asia and Northern Africa. The target is close to being reached in all regions except sub-Saharan Africa. Sub-Saharan Africa faces daunting challenges. These include rapid growth of the primary-school-age population (which has increased 86 per cent between 1990 and 2015), high levels of poverty, armed conflicts and other emergencies. However, sub-Saharan Africa has made the greatest progress in primary school enrolment among all developing regions. Its enrolment rate grew from 52 per cent in 1990 to 78 per cent in 2012. In absolute numbers the region’s enrolment more than doubled over this period, from 62 million children to 149 million. The number of out-of-school children has been cut almost in half since 2000 Number of out-of-school children of primary school age, selected regions, 1990¬2015 (millions) 0 20 40 60 80 100 120 1990 1995 2000 2015 (Projection) 2005 2010 103.9 100.6 41.3 38.2 99.8 97.5 43.7 33.8 57.8 55.2 32.7 9.8 56.7 53.6 32.8 9.1 World Developing regions Sub-Saharan Africa Southern Asia The global number of out-of-school children has fallen considerably since 1990, although the pace of improvement has been insufficient to achieve universal primary enrolment by 2015. Currently, 57 million children of primary school age are estimated to be out of school, down from 100 million in 2000. Of these, 33 million are in sub-Saharan Africa, and more than half (55 per cent) are girls. According to 2012 estimates, 43 per cent of out-of- school children globally will never go to school. However, regional disparities are large. In Southern Asia, an estimated 57 per cent of out-of-school children will never go to school, while in sub-Saharan Africa the proportion is 50 per cent. Gender is also an important factor. Almost half of out-of-school girls (48 per cent) are unlikely to ever go to school, compared to 37 per cent of boys. On the other hand, boys are more likely to leave school early. In countries affected by conflict, the proportion of out- of-school children increased from 30 per cent in 1999 to 36 per cent in 2012. This worrying trend is particularly strong in Northern Africa (where the share increased from 28 per cent to 49 per cent) and Southern Asia (from 21 per cent to 42 per cent). In many cases, these estimates do not capture relatively recent outbreaks
- 51. 26 | The Millennium Development Goals Report 2015 of conflict. For example, in Western Asia the ongoing conflict in the Syrian Arab Republic has had a devastating impact on children’s education. Data from the Syrian Ministry of Education indicate that enrolment rates fell by 34 percentage points for grades 1 to 12 in the school year ending in 2013. Among Syrian refugee children of primary and lower secondary school age (6 to 14 years) in Lebanon, the enrolment rate is estimated to be around 12 per cent. Large disparities remain in primary school enrolment, and the poorest and most disadvantaged children bear the heaviest burden Household wealth remains an important determinant of a child’s likelihood of attending school. For instance, 2008–2012 survey data from 63 developing countries show that children in the poorest households were four times as likely to be out of school as children in the richest households. More specifically, 21.9 per cent of primary-school-age children in the poorest quintile were out of school, compared to 5.5 per cent in the richest quintile. The 2008–2012 survey data also show that disparities between urban and rural locations persist across countries. The average out-of-school rate in rural areas was twice as high (16 per cent) as the rate in urban areas (8 per cent). However, some countries have made significant progress in enrolling the most marginalized children. Recent studies indicate, for example, that only four in ten girls from poor, rural households in the Democratic Republic of the Congo were in school in 2001, but by 2013 nearly seven in ten were enrolled. Disability is another major impediment to accessing education. In India, for instance, more than one third of children and adolescents aged 6 to 13 who live with disabilities are out of school. Yet the country has made remarkable efforts to make education more inclusive, such as through the Right to Education Act and allocation of funding for school infrastructure and teacher training. More children are completing primary school in lower-income countries Completion rate in primary education, low- and middle-income countries, 1992¬2015 (percentage) Low income Lower middle income Upper middle income Low and middle income 0 20 30 40 80 90 100 1992 1999 2015 (Projection) 2008 70 60 50 10 89 70 65 43 95 77 73 47 96 82 81 57 96 85 84 64 Note: The age group for which the completion rate is reported differs by country according to the official age of entry into the last grade of primary school, but it corresponds roughly to ages 14 to 16 (three to five years above the official primary-school-leaving age). The analysis is based on 72 countries representing 86 per cent of the population of low- and middle-income countries. In low- and middle-income countries, survey data show that the proportion of adolescents aged about 14 to 16 years who had finished primary school increased from 70 per cent in the early 1990s to 81 per cent in 2008, and is projected to reach 84 per cent in 2015. However, this means that in 2015 one in every six adolescents in those countries—almost 100 million adolescents—are still not completing primary school. Equally worrisome are wide disparities between poor and rich children in completing primary education. According to 2007–2013 survey data from 73 developing countries, adolescents from the poorest households were more than five times as likely not to complete primary school as children in the richest households. More specifically, 34.4 per cent of adolescents in the poorest quintile did not complete primary school, compared to 6.5 per cent in the richest quintile.
- 52. Goal 2: Achieve universal primary education | 27 The gender gap in youth literacy has fallen since 1990, and a greater proportion of all youth can read and write Literacy rate among youth aged 15 to 24 by sex and region, 1990, 2000 and 2015 (percentage) 40 50 60 70 80 90 100 Sub-Saharan Africa Oceania Southern Asia Northern Africa Western Asia South-Eastern Asia Latin America and the Caribbean Eastern Asia Caucasus and Central Asia Female Male 1990 2000 2015 Projection Since the 1990s, global progress in youth and adult literacy has been slow but steady, and the gap between women and men has narrowed. The literacy rate among youth aged 15 to 24 increased globally from 83 per cent in 1990 to 89 per cent in 2010. This improvement was largely a result of increasing attendance in primary and secondary school among younger generations. According to projections based on historical trends, 91 per cent of youth are expected to be able to read and write by the end of 2015. Youth literacy rates are estimated to be 93 per cent for young men and 90 per cent for young women. This still leaves an estimated 103 million illiterate youth in 2015, which is 22 million fewer than in 2010. Northern Africa and Southern Asia have shown the greatest improvement in youth literacy, especially among young women. Over the past two decades, sub-Saharan Africa has also achieved a large increase in youth literacy. However, a smaller proportion of its young women and men are able to read and write than in any other region. The unfinished work on education must rank high on the post-2015 development agenda Despite enormous progress during the past 15 years, achieving universal primary education will require renewed attention in the post-2015 era, just as the global community seeks to extend the scope to universal secondary education. Drawing on lessons learned from the MDGs, interventions will have to be tailored to the needs of specific groups of children—particularly girls, children belonging to minorities and nomadic communities, children engaged in child labour and children living with disabilities, in conflict situations or in urban slums. Investing in the quality of education and ensuring a sustainable source of funding are also essential. Stagnation in education progress has profound consequences for the children and adolescents who cannot go to school. As the world looks beyond 2015, it is crucial to reflect on and address the root causes of limited progress in youth literacy in some parts of the world. It is also necessary to explore new approaches to directly assess whether children have mastered the skills they are taught and whether they are being taught the skills they need in the twenty-first century.
- 53. 28 | The Millennium Development Goals Report 2015 Goal 3 Promote gender equality and empower women Target 3.A Eliminate gender disparity in primary and secondary education, preferably by 2005, and in all levels of education no later than 2015 A majority of regions have reached gender parity in primary education, but disparities persist at higher levels 0.4 0.6 0.8 1.2 1.4 1.0 Gender parity index* for gross enrolment ratios in primary, secondary and tertiary education in developing regions, 1990, 2000 and 2015 2015 2000 1990 Developing regions 2015 2000 1990 Southern Asia 2015 2000 1990 South-Eastern Asia 2015 2000 1990 Eastern Asia 2015 2000 1990 Caucasus and Central Asia 2015 2000 1990 Latin America and the Caribbean 2015 2000 1990 Northern Africa 2015 2000 1990 Western Asia 2015 2000 1990 Sub-Saharan Africa 2015 2000 1990 Oceania Secondary Primary Tertiary 2015 Target = Gender parity index between 0.97 and 1.03 * The gender parity index is defined as the ratio of the female gross enrolment ratio to the male gross enrolment ratio for each level of education. Notes: Data for 2015 are projections. Data for 1990 for the Caucasus and Central Asia refer to 1993. Projections for 2015 for primary and tertiary education in Oceania are not available. For primary education, 2012 data are used. X X About two thirds of countries in the developing regions have achieved gender parity in primary education. X X Globally, about three quarters of working-age men participate in the labour force, compared to half of working-age women. X X Today, women make up 41 per cent of paid workers outside of agriculture, an increase from 35 per cent in 1990. X X The average proportion of women in parliament has nearly doubled over the past 20 years, but still only one in five members are women. Key facts
- 54. Goal 3: Promote gender equality and empower women | 29 The education of women and girls has a positive multiplier effect on progress across all development areas. Driven by national and international efforts and the MDG campaign, many more girls are now in school compared with 15 years ago. Gender disparity has narrowed substantially at all levels of education since 2000. The developing regions as a whole have achieved the target to eliminate gender disparity at all levels of education, with a gender parity index of 0.98 in primary and secondary education and 1.01 in tertiary education in 2015 (the accepted measure of gender parity is between 0.97 and 1.03). However, significant differences remain across regions and countries, as disparities favouring either sex can cancel each other out when aggregated. The greatest improvements have been made in primary education. Today, five of the nine developing regions have achieved parity: the Caucasus and Central Asia, Eastern Asia, Latin America and the Caribbean, South-Eastern Asia and Southern Asia. The most substantial progress has been made in Southern Asia, where the gender parity index has increased from 0.74—the lowest starting point of all regions in 1990—to 1.03 in 2015. The gap between girls and boys has also narrowed considerably in North Africa, sub-Saharan Africa and Western Asia. Overall, 64 per cent of countries in the developing regions reporting data by sex had achieved gender parity in primary education in 2012. More than half of the countries with gender disparity in primary education in 2012 (56 per cent) were in sub-Saharan Africa. In secondary education, gender parity has been achieved in 2015 in the Caucasus and Central Asia, Eastern Asia, Northern Africa, South-Eastern Asia and Southern Asia. In Oceania, sub-Saharan Africa and Western Asia, girls remain at a disadvantage, while in Latin America and the Caribbean, boys are at a disadvantage. Gender parity in secondary education had been achieved in 36 per cent of countries with available data in the developing regions in 2012. The largest gender disparities in enrolment ratios are found in tertiary education, with only one developing region, Western Asia, achieving the target. The most extreme disparities are those at the expense of women in sub-Saharan Africa and Southern Asia and at the expense of men in Eastern Asia, Northern Africa and Latin America and the Caribbean. Only 4 per cent of countries with available data in the developing regions had achieved the target for tertiary education in 2012. Distribution of countries* in the developing regions by status of gender parity target achievement in primary, secondary and tertiary education, 2000 and 2012 (percentage) 0 20 40 60 80 100 Target reached Target not reached (disparities against females) Target not reached (disparities against males) * Based on available data for 164 countries or territories for primary education, 148 countries or territories for secondary education, and 122 countries or territories for tertiary education. 2000 45 52 4 2012 29 64 7 Primary education 2000 35 39 26 2012 30 34 36 Secondary education 2000 40 57 3 2012 31 65 4 Tertiary education
- 55. 30 | The Millennium Development Goals Report 2015 Women’s access to paid employment continues to expand, but remains low insome regions Share of women in wage employment in the non-agricultural sector, 1990, 2000 and 2015 (percentage) Southern Asia 17 14 21 Northern Africa 19 19 19 Western Asia 17 21 15 Sub-Saharan Africa 24 28 34 Oceania 39 33 36 South-Eastern Asia 39 35 37 Eastern Asia 38 40 43 Caucasus and Central Asia 43 43 43 44 Latin America and the Caribbean 38 42 45 Developed regions 45 46 48 World 35 38 41 0 10 20 30 40 50 1990 2000 2015 projection Over the last 25 years, women’s share of wage employment has continued to grow, though at a slow pace. The proportion of women in paid employment outside the agriculture sector has increased from 35 per cent in 1990 to 41 per cent in 2015. Over the period 1991–2015, the proportion of women in vulnerable employment (being a contributing family worker or an own-account worker) as a share of total female employment has declined 13 percentage points, from 59 per cent to 46 per cent. In contrast, vulnerable employment among men has fallen by 9 percentage points, from 53 per cent to 44 per cent. Women remain at a disadvantage in the labour market Men Women Distribution of working-age women and men (aged 15 and above) by labour force participation and employed women and men by status in employment, 2015 (percentage) Working-age women and men Employed women and men 0 20 40 60 80 100 Men Women 0 20 40 60 80 100 50 23 4 3 47 72 18 7 29 37 2 4 52 52 Unemployed Employed Economically inactive Own-account workers Contributing family workers Employers Wage and salaried workers Note: Data for 2015 are projections. Percentages in charts may not always add to 100 because of rounding. Despite notable gains by women, significant gaps remain between women and men in the labour market. Women are still less likely to participate in the labour force than men. As of 2015, about 50 per cent of all working-age women (aged 15 and above) are in the labour force, compared to 77 per cent of men. Despite their progress in education, women face a more difficult transition to paid work and receive lower earnings than men. Globally women earn 24 per cent less than men, with the largest disparities found in Southern Asia (33 per cent) and sub-Saharan Africa (30 per cent). Of 92 countries with data on unemployment rates by level of education for 2012–2013, in 78 countries women with advanced education have higher rates of unemployment than men with similar levels of education. Female participation in the labour force remains especially low in Northern Africa, Southern Asia and Western Asia, where women’s participation rate is one quarter to one third of men’s rate. Barriers to women’s employment include household responsibilities and cultural constraints. These factors contribute to limiting women’s earnings. Women are more likely than men to work as contributing family workers, who have little or no financial security or social benefits. In 2015, the proportion of employed women working as contributing family workers is 18 per cent, compared to 7 per cent of employed men. Women are less likely to work as own-account workers.