Magnetic resonance spectroscopy
•Descargar como PPTX, PDF•
12 recomendaciones•1,404 vistas

MR Spectroscopy Basic physics of spectroscopy uses and diagnostic value

Recomendados
Más contenido relacionado
La actualidad más candente
La actualidad más candente (20)
Similar a Magnetic resonance spectroscopy
Similar a Magnetic resonance spectroscopy (20)
Más de Rahman Ud Din
Último
Último (20)
Magnetic resonance spectroscopy
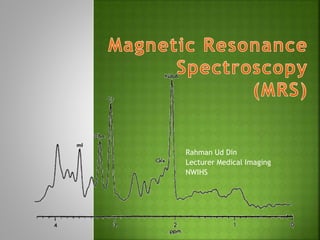
- 1. Rahman Ud Din Lecturer Medical Imaging NWIHS
- 2. MRS an exciting application of MRI Non-invasive technique Used to assess various metabolites or biochemicals from the body tissues This metabolites information used to diagnose, monitor and follow-up diseases 1H, 13C, 19F, 23Na and 31P (theoretical MRS can be done with) 1H & 31P (mostly clinical used MRS) We will discuss 1H spectroscopy
- 3. For the brain in particular, MRS has been a powerful research tool and provide additional clinical information for several disease such as brain tumors, metabolic disorders, and systemic diseases
- 4. Principles are same as MRI But few differences are In MRI, images are reconstructed from all protons in the tissue, water and fats dominate only Contrary, MRS detect small metabolites of clinical interest (resonate of frequency b/w water and fats) Small metabolites are detected when large signal are suppressed
- 5. How are small metabolites from the tissue detected? Chemical shift Chemical environment or electron cloud around protons Protons in water, fat and other compound precess at different rate Such change in frequency is called chemical shift Frequency of p+ in metabolites=chemical shift=position of metabolites peaks Measured in ppm Chemical shift is proportional to B°, need high Tesla MRI Can be performed on 0.5T or above 1.5T or above required for spectral separation & ↑SNR
- 6. Magnetic Field Homogeneity MR field must be homogeneous MRS require more homogeneous field than MRI because smaller chemical shift needs to detect In inhomogeneous field, smaller chemical shifts can be misinterpreted and incorrect concentration may be recorded Homogeneity required for MRI is about 0.5 ppm where for MRS it is about 0.1 ppm The process of making the magnetic field homogeneous is called ???!!!!! Shimming
- 7. No Frequency Encoding Gradient in MRS Similar to MRI, localisation is done by slice selection and phase encoding gradients The frequency encoding gradient is not used in MRS to preserve optimal homogeneity and chemical shift information The spin-spin or J-coupling Spins (p+) with a small difference of precessional frequency, for example spins within a molecule, interact with each other This is facilitated by electrons around a nuclei This spin-spin interaction modifies the resonant frequency of the spins involved in it J-coupling causes fusion of peaks on spectral map e.g. doublet of lactate at 1.3ppm
- 10. In early days, localisation done on surface coil Area covered by surface coil was VOI From VOI metabolites information obtained In current practice, four methods used STEAM PRESS ISIS and CSI (MRSI) First three are single voxel MRS tech: CSI used for multivoxel MRS technique
- 11. STEAM Stimulated Echo Acquisition Method VOI excited by 90 degree pulses in three orthogonal planes Echo stimulated signal is weak STEAM used for short TE(20-30 ms) spectroscopy PRESS Point Resolved Spectroscopy One 90 degree pulse and two 180 degree pulses are applied along three orthogonal planes The signal is strong with better SNR, PRESS used for long TE (135, 270 ms) spectroscopy
- 12. ISIS Image Selected In vivo Spectroscopy Three frequency selective inversion pulses applied In the presence of the orthogonal gradients Fourth non-invasive pulse is used for the observation of signal ISIS is used in 31P spectroscopy CSI Chemical Shift Imaging Multivoxel Spectroscopy Large area divided into multiple voxels Also called MRSI (imaging and spectroscopy) Localisation is done by phase encoding in one, two or three directions (1D, 2D or 3D spectro..)
- 13. Patient positioning Global Shimming Acquisition of MR images for localisation Selection of MRS measurement and parameters Improved SNR at long TR TEs 20-30 ms, 135-145 ms and 270 ms TEs longer than 135 ms, peaks of major metabolites i.e. Ch, Cr, NAA and lactate visible Other metabolites peaks are suppressed (short T2) Selection of VOI SVS (single voxel spectro) local or diffuse diseases CSI used large lesion
- 14. Local Shimming Optimisation of homogeneity over selected VOI Good shim results in narrower metabolite peaks Better spectral resolution Good SNR Full width at half height of H2O used as an indicator of shim A local shim of 4-10 Hz is desirable Water suppression Water peak is suppressed so that smaller metabolite peaks are visible Water peak suppression is done by CHESS (chemical shift selective spectroscopy) tech
- 15. MRS data collection Modern machine in use, SVS takes 3-6 minutes and CSI takes up to 12 minutes for data acquisition Data processing and display Acquired data is processed to get spectrum and spectral maps Zero point of spectrum is set in the software itself by frequency of a particular compound called Tetramethysilane (TMS) Interpretation Area under peak of any metabolite is directly proportional to the number of spins Absolute values for each varies with age and population Interpretation based on ratios of metabolites and comparison with normal side
- 17. NAA: N-Acetylaspartate Peak position: 2.02 ppm There is some contribution from NAAG and glutamate to the NAA peak It is a neuronal marker and any insult to the brain causing neuronal loss or degeneration causes reduction in NAA It is absent in tissues/lesions with no neurons e.g. metastasis and meningioma NAA is reduced in: hypoxia, infraction, Alzheimer’s, herpes, encephalitis, hydrocephalus, Alexander’s disease, epilepsy, some neoplasms, stroke, NPH, close head trauma, NAA increased in: Canavan’s disease
- 18. Cr: Creatine Peak position: 3.0 ppm. Second peak at 3.94 ppm Cr peak creatine, CrPO4, GABA (Gamma- aminobutyric acid), Lysine and glutathione Cr serves as high energy phosphate and as a buffer in ATP/ADP reservoir. Increase in amount with age Cr increased in: hypometabolic states and in trauma Cr reduced in: hypermetabolic states, hypoxia, stroke and some tumor Cr remain stable in many disease hence serves as reference or control peak for the comparison
- 19. Cho: Choline Peak position: 3.22 ppm Choline is phospholipids of the cell membrane Precursor of acetyl choline and phosphatidylcholine Indicator of cell membrane integrity Cho increases with increased cell membrane synthesis and increased cell turnover Cho is increased in: chronic hypoxia, epilepsy, Alzheimer’s, gliomas and some other tumors, trauma, infraction, hyperosmolar states, diabetes mellitus Cho is reduced in: hepatic encephalopathy and stroke
- 20. ml: Myo-inositol Peak position: 3.56 ppm, second peak at 4.1 ppm MI acts as an osmolyte and is marker of gliosis Involved in hormone sensitive neuroreception and is precursor of glucuronic acid It is the dominent peak in newborn babies and decrease with age MI is increased in: Alzheimer’s, frontal lobe dementias, diabetes and hyperosmolar states MI decreased in: hepatic and hypoxic encephalopathy, stroke, tumor, osmotic pontine myelinolysis and hyponatremia
- 21. Lac: Lactate Peak position: 1.3 pm Doublet Inverted at TE of 135 ms with PRESS, upright at other TEs on PRESS and at all the TEs with STEAM sequences Not seen in normal brain spectrum Elevated in hypoxia, tumor, mitochondrial encephalopathy, intracranial hemorrahage, stroke, hypoventilation, Canavan’s disease, Alexander’s disease and hydrocephalus
- 22. Glx: Glutamate (Glu) and Glutamine (Gln) Peak position: 2-2.45 ppm for beta and gamma Glx Second peak of alpha Glx at 3.6-3.8 ppm Glu is excitatory neurotransmitter and GABA is product of Glu It has role in detoxification and regulation of neurotransmitter activities Glx peak is elevated in head injury, hepatic encephalopathy and hypoxia
- 23. Lipids Peak position: 0.9, 1.3, 1.5 ppm Not seen in normal brain spectrum Seen in acute destruction of myelin Increased in high grade tumors (reflects necrosis), stroke and MS lesions Aminoacids Alanine (at 1.3-1.4 ppm), Valine (0.9 ppm) and leucine (3.6 ppm) Usually multiplets visualised at short TE Inverted at 135 ms Alanine is seen in the meningioma whereas valine and leucine are marker of abcess
- 24. Glucose When present, seen next to Cho peak on its left side May increases in diabetes, parenteral feeding and hepatic encephalopathy GABA Peak position: 1.9 and 2.3 ppm Used for monitoring of vigabatrin therapy given in children with myoclonic jerks