
Recomendados
Más contenido relacionado
La actualidad más candente
La actualidad más candente (20)
Similar a Practical Research 2 Week 5-6 Data Presentation and Interpretation
Similar a Practical Research 2 Week 5-6 Data Presentation and Interpretation (20)
Más de RexealKylaMaeAbrasal
Más de RexealKylaMaeAbrasal (9)
Último
Último (20)
Practical Research 2 Week 5-6 Data Presentation and Interpretation
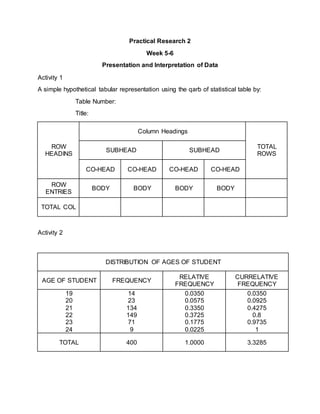
- 1. Practical Research 2 Week 5-6 Presentation and Interpretation of Data Activity 1 A simple hypothetical tabular representation using the qarb of statistical table by: Table Number: Title: ROW HEADINS Column Headings TOTAL ROWS SUBHEAD SUBHEAD CO-HEAD CO-HEAD CO-HEAD CO-HEAD ROW ENTRIES BODY BODY BODY BODY TOTAL COL Activity 2 DISTRIBUTION OF AGES OF STUDENT AGE OF STUDENT FREQUENCY RELATIVE FREQUENCY CURRELATIVE FREQUENCY 19 20 21 22 23 24 14 23 134 149 71 9 0.0350 0.0575 0.3350 0.3725 0.1775 0.0225 0.0350 0.0925 0.4275 0.8 0.9735 1 TOTAL 400 1.0000 3.3285
- 2. Activity 3 2010 2005 2000 1995 1990 1985 2,100 2,150 2,400 2,560 2,700 2,925 Activity 4 19 20 21 22 23 24 14 23 134 149 71 8
- 3. Activity 5 ICT HE ABM 37-PASSED 5-REMEDIAL 11- FAIL 8 - FAIL 10-Remedial 25-PASSED 33-PASSED 27-FAIL
- 4. Statistical Techniques (Part I) Activity 1 1. DESCRIPTIVE STATISTICS 2. INFERENTIAL STATISTICS 3. DESCRIPTIVE STATISTICS 4. INFERENTIAL STATISTICS 5. DESCRIPTIVE STATISTICS 6. DESCRIPTIVE STATISTICS 7. INFERENTIAL STATISTICS 8. INFERENTIAL STATISTICS 9. INFERENTIAL STATISTICS 10.INFERENTIAL STATISTICS Activity 2 Louis was a cautious clinician, which had a significant impact on the quality of his study. This procedure's certainty, in his opinion, was limited to severe cases of infection. Louis used the time of the initial bloodletting to determine the length of the illness and the incidence of mortality. Louis was aware that patients who bled later in the course of their illness were likely to have already experienced the worst part of their illness and, as a result, must have had a realistic prediction. Recognizing that this bias would have favored delayed bleeding, he produced detailed analyses of the severity of signs between those who bled early and those who bled late, but he was unable to detect any differences. Louis concluded that bloodletting had beneficial effects based on these findings, but only for specific evidence. Louis also realized that large bleeding was preferable than restricted bleeding, despite the fact that he didn't have any quantitative data to back it up. Louis aided the 'numerical technique,' or the idea that diverse and legitimate medical understandings might be derived from a collection of clinical data. Louis was concerned about the validity of group comparisons and the attention integrity upon which they were based, as well as the logical density of his conclusions. As a result, he stated, "Nothing like true medicine is feasible without the aid of statistics." Activity 3 1. Nominal 2. Ordinal 3. Nominal 4. Interval 5. Ratio
- 5. Activity 4 The level of measurement refers to how each variable is measured qualitatively or quantitatively, as well as the precision with which each variable is measured. Nominal, ordinal, and interval/ratio variables are the four levels of measurement, with nominal being the least precise and informative and interval/ratio variable being the most precise and informative. If you have a choice, go with an interval/ratio variable because it allows you more flexibility and options when it comes to selecting a statistical technique. The four major forms of measurement have the following hierarchy, with the ratio scale being the highest or strongest level of measurement and nominal the lowest or weakest type of measurement. Nominal provides the least amount of detail, ordinal provides the next highest amount of detail, and interval and ratio provide the most amount of detail. In a nominal level variable, values are grouped into categories that have no meaningful order. Activity 5 ELECTRICAL SKILLS FREQUENCY Prepare operational plans 53 Electronic equipment maintenance 50 Build and operate computer systems 48 Direct construction activities and equipment upkeep 47 Apply linear systems theory and analysis 44 Circuit design 43 Develop electrical schematics 37 Data collection and analysis 33 PART II ELECTRICAL SKILLS FREQUENCY Prepare operational plans 53 Electronic equipment maintenance 50 Build and operate computer systems 48 Direct construction activities and equipment upkeep 47 Apply linear systems theory and analysis 44 Circuit design 43 Develop electrical schematics 37 Data collection and analysis 33
- 6. ELECTRICAL SKILLS FREQUENCY Prepare operational plans 53 Electronic equipment maintenance 50 Build and operate computer systems 48 Direct construction activities and equipment upkeep 47 Apply linear systems theory and analysis 44 Circuit design 43 Develop electrical schematics 37 Data collection and analysis 33 PART III 1. I can use 6 of those electrical skills in the selections. 2. Yes, it is possible 3. Ratio 4. Use the mean to describe the sample with a single value that represents the center of the data. Many statistical analyses use the mean as a standard measure of the center of the distribution of the data. The median and the mean both measure central tendency.