
Recomendados
Más contenido relacionado
La actualidad más candente
La actualidad más candente (20)
Destacado
Destacado (20)
Similar a PROJECT REPORT
Similar a PROJECT REPORT (20)
PROJECT REPORT
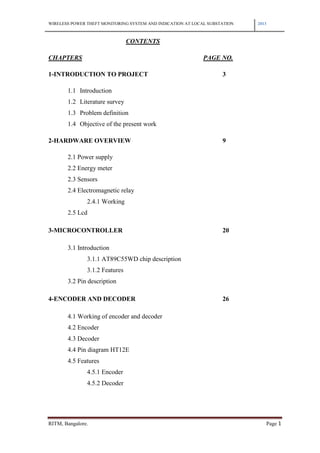
- 1. WIRELESS POWER THEFT MONITORING SYSTEM AND INDICATION AT LOCAL SUBSTATION 2013 RITM, Bangalore. Page 1 CONTENTS CHAPTERS PAGE NO. 1-INTRODUCTION TO PROJECT 3 1.1 Introduction 1.2 Literature survey 1.3 Problem definition 1.4 Objective of the present work 2-HARDWARE OVERVIEW 9 2.1 Power supply 2.2 Energy meter 2.3 Sensors 2.4 Electromagnetic relay 2.4.1 Working 2.5 Lcd 3-MICROCONTROLLER 20 3.1 Introduction 3.1.1 AT89C55WD chip description 3.1.2 Features 3.2 Pin description 4-ENCODER AND DECODER 26 4.1 Working of encoder and decoder 4.2 Encoder 4.3 Decoder 4.4 Pin diagram HT12E 4.5 Features 4.5.1 Encoder 4.5.2 Decoder
- 2. WIRELESS POWER THEFT MONITORING SYSTEM AND INDICATION AT LOCAL SUBSTATION 2013 RITM, Bangalore. Page 2 5-RADIO FREQUENCY TRANSMITTER & RECEIVER 32 5.1 Block diagram and explanation 5.2 Pin diagram 5.3 Pin description 5.3.1 RF transmitter 5.3.2 RF receiver 6-SOFTWARE USED AND CODINGS 37 6.1 Introduction to embedded systems 6.1.1 Embedded hardware 6.1.2 Embedded software 6.2 Introduction to kiel µ vision 3 6.2.1 Features 6.2.2 Benefits 6.3 C-programming for microcontroller 6.3.1 Consumer side 6.3.2 Substation side 6.4 Flash magic 6.5 Flow chart 7-WORKING OF THE SYSTEM 62 7.1 Block diagram and explanation 7.2 Circuit diagram 7.3 Operation of the Model 7.3.1 Consumer side 7.3.2 Substation side 8-RESULTS AND DISCUSSIONS 71 9-ADVANTAGES AND DISADVANTAGES 74 10-CONCLUSION AND FUTURE SCOPE 76 REFERENCES & BIBLIOGRAPHY 78
- 3. WIRELESS POWER THEFT MONITORING SYSTEM AND INDICATION AT LOCAL SUBSTATION 2013 RITM, Bangalore. Page 3 CHAPTER- 1 INTRODUCTION
- 4. WIRELESS POWER THEFT MONITORING SYSTEM AND INDICATION AT LOCAL SUBSTATION 2013 RITM, Bangalore. Page 4 1.1 INTRODUCTION Utility companies have estimated that electricity theft costs them over a billion US dollars in annual revenues. The purpose of this work is to provide an algorithm for the design of electricity theft monitoring system which allows violators to be detected at a remote location. It begins with the analysis of losses in electrical power systems. The bulk of these losses are caused by electricity theft, rather than other possibilities such as poor maintenance and calculation and accounting mistakes, though some power systems may suffer from both. Other aspects discussed include the various forms of theft practices, methodology for detection of theft, generating the theft case algorithm using the backtracking algorithm method and communicating these data from the consumer premises to the substation using Radio Frequency Communication. Appropriate conclusions and recommendations were given from the information gathered. According to a research, electricity theft can be in the form of fraud (meter tampering), stealing (illegal connections), billing irregularities, and unpaid bills. The evidence of the extent of electricity theft in a sample of 102 countries between 1980 and 2000 shows that theft is increasing in most regions of the world. The financial impacts of theft are reduced income from the sale of electricity and the necessity to charge more to consumers.[1] Electricity theft is closely related to governance indicators where higher levels are recorded in countries without effective accountability, political instability, low government effectiveness and high levels of corruption. Merely generating more power is not enough to meet the present day requirements. Power consumption and losses have to be closely monitored so that the generated power is utilized in a most efficient manner. Electrical energy theft ranges between 3 - 30% in our country. This illegal electricity usage may indirectly affect the economical status of our country. Also the planning of national energy may be difficult in case of unrecorded energy usage. [1] One of the major problems faced by the energy suppliers like KSEB is the illegal usage of electricity. Electricity theft is a social crime, so it has to be completely
- 5. WIRELESS POWER THEFT MONITORING SYSTEM AND INDICATION AT LOCAL SUBSTATION 2013 RITM, Bangalore. Page 5 eliminated. This project is named ‘Wireless Power Theft Monitoring System' is focusing on how to detect and monitor the Electricity Theft at a remote KSEB location. The proposed system prevents the illegal usage of electricity. At this point of technological development the problem of illegal usage of electricity can be solved electronically. Here we use Radio frequency (RF) Technology for wireless communication. This project is aimed at developing a system for detection of theft and backtracking the consumer premises where theft is being carried at the local substation using radio-frequency technology. 1.2 LITERATURE SURVEY The man has been and being zeal of finding new technologies in various fields. Electricity is also one technology where man has developed and canonizing it. The planet Earth is experiencing the impact of the new millennium. At this juncture, when we look back at the centuries that have gone by, one can only appreciate what engineering and technology have contributed to this world. Right from the start, man has been trying to invent newer things to satisfy his physiological needs. In earlier day’s food, clothes and shelter were said to be the basic needs of human life. Now the trend has been changed i.e., Electricity has also become a day to day necessity of life. Electricity theft is at the center of focus all over the world but electricity theft in India has a significant effect on the Indian economy, as this figure is considerably high. The loss due to power theft, as per experts say, are currently 29 % of the total generation, which equals to Rs 45,000 crores in the year 2009-10. According to experts, if not for power theft over a decade now, India could have built two mega power plants of around 4,000 MW capacities every year. Power loss due to theft in 2003-04 was 32.86% and increased to 34.78% in 2006- 07. In 2009-10, it stood at 28.44% but currently the figure is again 29%. It is as high as 51% in Jharkhand, 45% in Madhya Pradesh, 33% in Karnataka and 40% in Bihar. [5]
- 6. WIRELESS POWER THEFT MONITORING SYSTEM AND INDICATION AT LOCAL SUBSTATION 2013 RITM, Bangalore. Page 6 So in order to overcome the revenue loss due to power theft in our country, we have made a small attempt through this project. In this project we have used RF technology, which has very high power frequency. 1.3 PROBLEM DEFINITION: Ineffective and inefficient present methods of detecting and preventing. Power theft causes a revenue loss along with damage to personal and public property. Large amount of power shortage is caused due to power theft. One of the challenges in stopping power theft is the difficulty in detecting power theft. In particular it is difficult to find the exact location where power theft is occurring. Measurement of parameters like power line current and power line voltage has not been available in a satisfactory way to optimize power network management.
- 7. WIRELESS POWER THEFT MONITORING SYSTEM AND INDICATION AT LOCAL SUBSTATION 2013 RITM, Bangalore. Page 7 1.4 PROJECT OVERVIEW Fig 1.4: block diagram 1.4.1 Hardware requirements 1. Energy meter 2. Microcontroller module 3. Sensors & Relays 4. Rf module 5. Power supply system 6. Load 1.4.2 Software requirements 1. Keil µVision3 2. Flash magic In this project, there are two sections i) a transmitter sections placed at the consumer premises and ii)a receiver section placed at the local substation as shown above Both of the sections are designed by the 8052 micro-controller. Transmitter Section: Sensor- There are two sensors- Meter Pulse Sensor- Its senses if there is any problem in the meter recordings. Line Sensor- Its senses if any tampering has been done with the lines of the energy meter. For designing the sensors we are using a device name Optocoupler.
- 8. WIRELESS POWER THEFT MONITORING SYSTEM AND INDICATION AT LOCAL SUBSTATION 2013 RITM, Bangalore. Page 8 Microcontroller- The microcontroller we are using is P89V51RD2 manufactured by the Philips Company. Relay Driver- Its helps in operating the relay when the microcontroller gives the signal and converts the 5V of the microcontroller to 12V which is required by the relay to operate. Transmitter- It transmits the data encoded by the encoder to the substation unit. Receiver- It intercepts the radio waves transmitted by the transmitter and send it to the decoder.
- 9. WIRELESS POWER THEFT MONITORING SYSTEM AND INDICATION AT LOCAL SUBSTATION 2013 RITM, Bangalore. Page 9 CHAPTER- 2 HARDWARE OVERVIEW
- 10. WIRELESS POWER THEFT MONITORING SYSTEM AND INDICATION AT LOCAL SUBSTATION 2013 RITM, Bangalore. Page 10 2.1 POWER SUPPLY In this project, various power supply voltages are required for different components to work. These requirements of voltages are supplied by the power supply circuit shown below. Fig 2.1: Power Supply A D.C. power supply which maintains the output voltage constant irrespective of a.c. mains fluctuations or load variations is known as regulated D.C. power supply. It is also referred as full-wave regulated power supply as it uses four diodes in bridge fashion with a step down transformer.[7] This laboratory power supply offers excellent line and load regulation and output voltages of +5V & +12V at output currents upto one ampere. 1. Step-down Transformer: The transformer rating is 230V AC at Primary and 12-0- 12V/1Amperes across secondary winding. This transformer has a capability to deliver a current of 1 Ampere, which is more than enough to drive an electronic circuit or varying load. The 12V AC appearing across the secondary is the RMS value of the waveform and the peak value would be 12*1.414=16.8 volts. This value limits our choice of rectifier diode as 1N4007[6], which is having a rating of more than 16V. 2. Rectifier Stage: During each cycle of operation only two of the four diodes conduct while the other two remains non-conducting. During the positive half cycle of the secondary voltage, the diodes D1 and D3 are forward biased and conduct and the diodes D2 and D4 are reversed biased. While during the negative half cycle of operation the
- 11. WIRELESS POWER THEFT MONITORING SYSTEM AND INDICATION AT LOCAL SUBSTATION 2013 RITM, Bangalore. Page 11 diodes D2 and D4 are forward biased and operate and the diodes D1 and D3 are reversed biased and does not conduct. The rectifier stage is used to convert a.c to d.c. 3. Filter Stage: Here capacitor C5 is used for filtering purpose and connected across the rectifier output. It filters the a.c. components present in the rectified D.C. and gives steady D.C. voltage i.e. pure dc without any distortions. As the rectifier voltage increases, it charges the capacitor and also supplies current to the load. When the capacitor is charged to the peak value of the rectifier voltage, rectifier voltage starts to decrease. As the next voltage peak immediately recharges the capacitor, the discharge period is of very small duration. Due to this continuous charge-discharge-recharge cycle very little ripple is observed in the filtered output. The output voltage is higher as it remains substantially near the peak value of rectifier output voltage. This phenomenon is also experienced in other form as: the shunt capacitor offers a low reactance path to the a.c. components of current and open circuit to d.c. component. During positive half cycle the capacitor stores energy in the form of electrostatic field. During negative half cycle, the filter capacitor releases stored energy to the load. 2.2 ENERGY METER Energy meter is a device that measures the amount of electric energy consumed by a residence, business, or an electrically powered device. Energy meters are typically calibrated in billing units, the most common one being the kilowatt hour (kWh). Energy meters operate by continuously measuring the instantaneous voltage (volts) and current (amperes) and finding the product of these to give instantaneous electrical power (watts) which is then integrated against time to give energy used (joules, kilowatt-hours etc.). Meters for smaller services (such as small residential customers) can be connected directly in-line between source and customer. For larger loads, more than about 200 ampere of load, current transformers are used, so that the meter can be located other than in line with the service conductors. The meters fall into two basic categories, electromechanical and electronic. The electromechanical induction meter operates by counting the revolutions of an aluminium disc which is made to rotate at a speed proportional to the power. The number of revolutions is thus proportional to the energy usage.
- 12. WIRELESS POWER THEFT MONITORING SYSTEM AND INDICATION AT LOCAL SUBSTATION 2013 RITM, Bangalore. Page 12 Electronic meters display the energy used on an LCD or LED display. In addition to measuring energy used, electronic meters can also record other parameters of the load and supply such as maximum demand, power factor and reactive power used etc. 2.3 SENSORS In this project two types of sensors have been used Meter Pulse Sensor- Meter pulse sensor is used to sense if the pulses generated by the energy meter are generated at the equal intervals of time with respect to the current through line sensors and also checks if the pulses are being generated whenever the current is flowing. Fig 2.3.1: Meter pulse sensor Line Sensor- Line Pulse sensor is used to sense if the current from the output of the energy meter is flowing properly, to sense if the current limit exceeds its threshold value and to identify if any of the wire has been disconnected from the energy meter. Fig 2.3.2: Line sensor
- 13. WIRELESS POWER THEFT MONITORING SYSTEM AND INDICATION AT LOCAL SUBSTATION 2013 RITM, Bangalore. Page 13 For both the sensors a device called an Optocoupler (MCT2E) is used. Fig 2.3.3: An optocoupler circuit An optocoupler is essentially an optical transmitter and an optical receiver connected by a non-conductive barrier. It uses a beam of light to transfer energy from one circuit element to another, and it can handle incoming voltages of up to 7500V. The barrier that separates the two side of the optocoupler is made from a transparent glass or plastic polymer that does not conduct electricity but does conduct light. The actual physical device of the optocoupler is usually encased in a dark, non- conductive casing. It is attached into the electric circuit through small metal teeth and has holes on either end of the small cabinet for wire connections to pass through. Optocouplers typically come in a small 6-pin or 8-pin IC package, but are essentially a combination of two distinct devices: an optical transmitter, typically a gallium arsenide LED (light-emitting diode) and an optical receiver such as a phototransistor or light-triggered diac. The two are separated by a transparent barrier which blocks any electrical current flow between the two, but does allow the passage of light. 2.4 ELECTROMAGNETIC RELAY A relay is an electrically operated switch. Current flowing through the coil of the relay creates a magnetic field which attracts a lever and changes the switch contacts. Relays allow one circuit to switch a second circuit which can be completely separate from the first. For example a low voltage battery circuit can use a relay to switch a 230V AC mains circuit. There is no electrical connection inside the relay between the two circuits; the link is magnetic and mechanical.
- 14. WIRELESS POWER THEFT MONITORING SYSTEM AND INDICATION AT LOCAL SUBSTATION 2013 RITM, Bangalore. Page 14 Fig 2.4.1: Internal diagram of relay Figure 2.4.2: Circuit diagram 2.4.1 WORKING The relay's switch connections are usually labeled COM, NC and NO: COM = Common, always connected. It is the moving part of the switch. NC = Normally Closed, COM is connected to this when the relay coil is on. NO = Normally Open, COM is connected to this when the relay coil is off. When the control signal is low, the pole is between the common (COM) and the normally connected points. But when the control signal goes high, current flows through
- 15. WIRELESS POWER THEFT MONITORING SYSTEM AND INDICATION AT LOCAL SUBSTATION 2013 RITM, Bangalore. Page 15 the coils of the relay, thus making it an electro magnet. Due to this electromagnetic effect the pole is pulled towards the normally open (NO) point. Thus we see that there is closed path for the current to flow. Hence the device turns on. The device remains in this state until the control signal to the relay is high. The coils which provide the magnetic flux to operate a relay are available for operations on a variety of voltages between 5V and 115V DC and 12V-250V AC at currents between 5mA and 100mA typical specifications for a low voltage relay suitable for switching a mains connected load are as follows: Contract rating: 5A, 30V DC/250 AC Coil rating: 12V (from 10.9V to 19.5V) Coil resistance: 205 ohm Electrical life: 200,000 operations (at full rated load) Mechanical life: 10 million operations. 2.5 LCD (Liquid Crystal Display) The term liquid crystal display (LCD) refers to fact that these components have a crystalline arrange of molecules, yet they flow like liquid. The construction of a crystal liquid display contains two glass plates with a liquid crystal fluid in between. The back plate is coated with thin transparent layer of conductive material, where as front plate has a photo etched conductive coating with seven segment pattern. LCD is a display technology that uses liquid crystal that flows like liquid and bends light. The more the molecules are twisted, the better will be the contrast and viewing angle. There are two modes in LCD 8-bit mode and 4-bit mode, we have used 4-bit mode in our project.
- 16. WIRELESS POWER THEFT MONITORING SYSTEM AND INDICATION AT LOCAL SUBSTATION 2013 RITM, Bangalore. Page 16 Fig 2.5.1: LCD Features This LCD has 14 pins, an optional backlight and a simple parallel bus interface for easy communication. +5v DC supply from pin VDD This module operates in 8-bit mode and 4-bit mode. It contains eight data lines (D0-D7), three control lines (E, R/W & RS) and three power lines (VSS, VDD & VEE). Enable (E) pin is to latch information present to its data pins. Read/write(R/W) pin used to write and read information to LCD display. Register select (RS) decide either to send commands or data to LCD display. Using VEE pin contrast of display can be adjusted.
- 17. WIRELESS POWER THEFT MONITORING SYSTEM AND INDICATION AT LOCAL SUBSTATION 2013 RITM, Bangalore. Page 17 Fig 2.5.2 Pin diagram Pin no Name Function 1 Vss Ground 2 Vdd +ve supply 3 Vee Contrast 4 RS Register Select 5 R/W Read/Write 6 E Enable 7 D0 Data bit0 8 D1 Data bit1 9 D2 Data bit2 10 D3 Data bit3 11 D4 Data bit4 12 D5 Data bit5 13 D6 Data bit6 14 D7 Data bit7 Table 2.5.1: Pin description
- 18. WIRELESS POWER THEFT MONITORING SYSTEM AND INDICATION AT LOCAL SUBSTATION 2013 RITM, Bangalore. Page 18 RS- Register Select: There are 2 very important registers in LCD; the Command Code register and the Data Register. If RS=0, the Code register is selected, allowing user to send command If RS=1, the Data register is selected allowing to send data that has to be displayed. RW- ReadWrite: RW input allows the user to write information to LCD or read information from it. How do we read data from LCD? The data that is being currently displayed will be stored in a buffer memory DDRAM. This data could be read if necessary. If RW=1, then set for Reading RW=0, then set for Writing E- Enable: The enable Pin is used by the LCD to latch information at its data pins. When data is supplied to data pins, a high to low pulse must be applied to this pin in order for the LCD to latch the data present in the data pins. E=1 then 0, set the LCD a Toggle The following table gives description about different commands to program LCD. COMMAND DESCRIPTION CODE Clear Display Clears the display and returns the cursor to the home position (address 0) 01h Return Home Returns the cursor to the home position (address 0). Also returns a shifted display to the home position. DD RAM contents remain unchanged. 02h Entry Mode Set (These are performed during data write/read.) Decrement cursor + No display shift 04h Decrement cursor + Display shift 05h Increment cursor + No display shift 06h Increment cursor + Display shift 07h Display ON/OFF Display Cursor Blink of the
- 19. WIRELESS POWER THEFT MONITORING SYSTEM AND INDICATION AT LOCAL SUBSTATION 2013 RITM, Bangalore. Page 19 Control character at the cursor position Display OFF Cursor OFF OFF 08h ON 09h Cursor ON OFF 0Ah ON 0Bh Display ON Cursor OFF OFF 0Ch ON 0Dh Cursor ON OFF 0Eh ON 0Fh Cursor & Display Shift (DD RAM contents remain unchanged.) Decrement cursor + No display shift 10h Increment cursor + No display shift 14h Display shift left + No cursor movement 18h Display shift right + No cursor movement 1Ch Function Set 4 bit data + 1 line display + 5x7 dots/char 20h 4 bit data + 1 line display + 5x10 dots/char 24h 4 bit data + 2 line display + 5x7 dots/char 28h 4 bit data + 2 line display + 5x10 dots/char 2Ch 8 bit data + 1 line display + 5x7 dots/char 30h 8 bit data + 1 line display + 5x10 dots/char 34h 8 bit data + 2 line display + 5x7 dots/char 38h 8 bit data + 2 line display + 5x10 dots/char 3Ch Set CG RAM Address Sets the CG RAM address (00h to 3Fh). CG RAM data can be read or altered after making this setting. 40h to 7Fh Set DD RAM Address Sets the DD RAM address (00h to 7Fh). Data may be written or read after making this setting. 80h to FFh Table 2.5.2: Commands to program LCD
- 20. WIRELESS POWER THEFT MONITORING SYSTEM AND INDICATION AT LOCAL SUBSTATION 2013 RITM, Bangalore. Page 20 CHAPTER- 3 MICROCONTOLLER
- 21. WIRELESS POWER THEFT MONITORING SYSTEM AND INDICATION AT LOCAL SUBSTATION 2013 RITM, Bangalore. Page 21 3.1 INTRODUCTION Microcontroller is a central processing unit of a general purpose digital computer. The by-product of microprocessor development was the microcontroller. Microcontroller incorporates all the features that are found in microprocessor. However, it has also added features to make a complete microcomputer system on its own. The microcontroller has on-chip (built-in) peripheral devices. These on-chip peripherals make it possible to have a single-chip microcomputer system There few more advantages of built-in pepipherals: Built –in pepipherals have smaller access times hence speed is more Hardware reduces due to single –chip microcomputer system Less hardware reduces PCB size and increases reliability of the system The prime use of microcontroller is to control the operation of a machine using a fixed program that is stored in ROM and that does not change over the life time of the system. The design approach of the microcontroller mirrors that of the microprocessor make a single design that can be used in as many application as possible in order to sell, hopefully, as many as possible. The microcontroller design uses a much more limited set of single and double byte instructions that are used to move code and data from the internal memory to the ALU 8 bit controller 16 bits address line 8 bits data line 128 bytes RAM 4 Kbytes ROM 16 bit timers divided into two 8bit timers UART(Universal Asynchronous Receiver Transmitter) 4 ports
- 22. WIRELESS POWER THEFT MONITORING SYSTEM AND INDICATION AT LOCAL SUBSTATION 2013 RITM, Bangalore. Page 22 Fig 3.1 :Block diagram of 8051 Micro-controller 3.1.1 AT89C55WD chip description The AT89C55WD is a low-power, high-performance CMOS 8-bit microcontroller with 20K bytes of Flash programmable read only memory and 256 bytes of RAM. The device is manufactured using Atmel’s high-density non-volatile memory technology and is compatible with the industry standard 80C51 and 80C52 instruction set and pin out. The on-chip Flash allows the program memory to be user programmed by a conventional non-volatile memory programmer. By combining a versatile 8-bit CPU with Flash on a monolithic chip, the Atmel AT89C55WD is a powerful microcomputer which provides a highly flexible and cost effective solution to many embedded control applications. 3.1.2 FEATURES The AT89C55WD provides the following standard features: 20K bytes of Flash, 256 bytes of RAM, 32 I/O lines, three 16-bit timer/counters, a six-vector, two-level interrupt architecture, a full-duplex serial port, on-chip oscillator, and clock circuitry. In addition, the AT89C55WD is designed with static logic for operation down to zero
- 23. WIRELESS POWER THEFT MONITORING SYSTEM AND INDICATION AT LOCAL SUBSTATION 2013 RITM, Bangalore. Page 23 frequency and supports two software selectable power saving modes. The Idle Mode stops the CPU while allowing the RAM, timer/counters, serial port, and interrupt system to continue functioning. The Power-down Mode saves the RAM contents but freezes the oscillator, disabling all other chip functions until the next external interrupt or hardware reset. 3.2 PIN DESCRIPTION Fig 3.2: 8051 Micro-controller pin diagram Port 0: Port 0 is an 8-bit open drain bi-directional I/O port. Port 0 pins that have ‘1’s written to them float, and in this state can be used as high-impedance inputs. Port 0 is also the multiplexed low-order address and data bus during accesses to external code and data memory. In this application, it uses strong internal pull-ups when transitioning to ‘1’s. Port 0 also receives the code bytes during the external host mode programming, and outputs the code bytes during the external host mode verification. External pull-ups are required during program verification or as a general purpose I/O port. Port 1: Port 1 is an 8-bit bi-directional I/O port with internal pull-ups. The Port 1 pins are pulled high by the internal pull-ups when ‘1’s are written to them and can be used as inputs in this state. As inputs, Port 1 pins that are externally pulled LOW will source
- 24. WIRELESS POWER THEFT MONITORING SYSTEM AND INDICATION AT LOCAL SUBSTATION 2013 RITM, Bangalore. Page 24 current (IIL) because of the internal pull-ups. P1.5, P1.6, P1.7 have high current drive of 16 mA. Port 1 also receives the low-order address bytes during the external host mode Programming and verification. Port 2: Port 2 is an 8-bit bi-directional I/O port with internal pull-ups. Port 2 pins are pulled HIGH by the internal pull-ups when ‘1’s are written to them and can be used as inputs in this state. As inputs, Port 2 pins that are externally pulled LOW will source current (IIL) Because of the internal pull-ups. Port 2 sends the high-order address byte during fetches from external program memory and during accesses to external Data Memory that use 16- bit address (MOVX@DPTR). In this application, it uses strong internal pull-ups when Transitioning to ‘1’s. Port 2 also receives some control signals and a partial of high-order address bits during the external host mode programming and verification. Port 3: Port 3 is an 8-bit bidirectional I/O port with internal pull-ups. Port 3 pins are pulled HIGH by the internal pull-ups when ‘1’s are written to them and can be used as inputs in this state. As inputs, Port 3 pins that are externally pulled LOW will source current (IIL) because of the internal pull-ups. Port 3 also receives some control signals and a partial of high-order address bits during the external host mode programming and verification. Program Store Enable: PSEN is the read strobe for external program memory. When the device is executing from internal program memory, PSEN is inactive (HIGH). When the device is executing code from external program memory, PSEN is activated twice each machine cycle, except that two PSEN activations are skipped during each access to external data memory. A forced HIGH-to-LOW input transition on the PSEN pin while the RST input is continually held HIGH for more than 10 machine cycles will cause the device to enter external host mode programming. Reset: While the oscillator is running, a HIGH logic state on this pin for two machine cycles will reset the device. If the PSEN pin is driven by a HIGH-to-LOW input transition while the RST input pin is held HIGH, the device will enter the external host mode, otherwise the device will enter the normal operation mode.
- 25. WIRELESS POWER THEFT MONITORING SYSTEM AND INDICATION AT LOCAL SUBSTATION 2013 RITM, Bangalore. Page 25 External Access Enable: EA must be connected to VSS in order to enable the device to fetch code from the external program memory. EA must be strapped to VDD for internal program execution. However, Security lock level 4 will disable EA, and program execution is only possible from internal program memory. The EA pin can tolerate a high voltage of 12 V. Address Latch Enable: ALE is the output signal for latching the low byte of the address during an access to external memory. This pin is also the programming pulse input (PROG) for flash programming. Normally the ALE is emitted at a constant rate of 1¤6 the crystal. Frequency and can be used for external timing and clocking. One ALE pulse is skipped during each access to external data memory. However, if AO is set to ‘1’, ALE is disabled. NC: No Connect XTAL 1(Crystal 1): Input to the inverting oscillator amplifier and Input to the internal clock generator circuits. XTAL2 (Crystal 2): Output from the inverting oscillator amplifier. VDD: Power supply VSS: Ground.
- 26. WIRELESS POWER THEFT MONITORING SYSTEM AND INDICATION AT LOCAL SUBSTATION 2013 RITM, Bangalore. Page 26 CHAPTER- 7 ENCODER AND DECODER
- 27. WIRELESS POWER THEFT MONITORING SYSTEM AND INDICATION AT LOCAL SUBSTATION 2013 RITM, Bangalore. Page 27 4.1 Working of encoder and decoder Fig 4.1: Shows the working of HT12E The RF module is often used along with a pair of encoder/decoder. The encoder is used for encoding parallel data for transmission feed while reception is decoded by a decoder, HT12E- HT12D, HT640-HT648, etc. are some commonly used encoder/decoder pair ICs.
- 28. WIRELESS POWER THEFT MONITORING SYSTEM AND INDICATION AT LOCAL SUBSTATION 2013 RITM, Bangalore. Page 28 4.2 Encoder Fig 4.2: Circuit of HT12E as an Encoder Encoders are software programs that are used for compressing information. Often, the function of an encoder will also allow for the conversion of data from one format to another. While there are several types of programs that accomplish this for text data, the encoder is usually associated with audio and video. The encoder being used in this project is HT12E, it is used in order to transmit data from the consumer premises to the substation through radio frequency technology. In this project, the encoder HT12E gets the information from the microcontroller and converts it into a radio wave signal of frequency 433.92MHz and sends it to the transmitter antennae.
- 29. WIRELESS POWER THEFT MONITORING SYSTEM AND INDICATION AT LOCAL SUBSTATION 2013 RITM, Bangalore. Page 29 4.3 Decoder Fig 4.3: Circuit 0f HT12D as a Decoder A decoder is a device which does the reverse operation of an encoder, undoing the encoding so that the original information can be retrieved. The same method used to encode is usually just reversed in order to decode. It is a combinational circuit that converts binary information from n input lines to a maximum of 2n unique output lines The decoder being used in this project is HT12D, it is used to receive the RF waves and convert them in the form of the original data and sends it to the microcontroller at the substation premises.
- 30. WIRELESS POWER THEFT MONITORING SYSTEM AND INDICATION AT LOCAL SUBSTATION 2013 RITM, Bangalore. Page 30 4.4 Pin Diagram of HT12E Fig 4.4: Pin diagram of HT12E 4.5 Features 4.5.1 Encoder 18 PIN DIP Operating Voltage : 2.4V ~ 12V Low Power and High Noise Immunity CMOS Technology Low Standby Current and Minimum Transmission Word Built-in Oscillator needs only 5% Resistor Easy Interface with and RF or an Infrared transmission medium Minimal External Components
- 31. WIRELESS POWER THEFT MONITORING SYSTEM AND INDICATION AT LOCAL SUBSTATION 2013 RITM, Bangalore. Page 31 4.5.2 Decoder 18 PIN DIP, Operating Voltage : 2.4V ~ 12.0V Low Power and High Noise Immunity, CMOS Technology Low Stand by Current, Trinary address setting Capable of Decoding 12 bits of Information 8 ~ 12 Address Pins and 0 ~ 4 Data Pins Received Data are checked 2 times, Built in Oscillator needs only 5% resistor VT goes high during a valid transmission Easy Interface with an RF of IR transmission medium Minimal External Components
- 32. WIRELESS POWER THEFT MONITORING SYSTEM AND INDICATION AT LOCAL SUBSTATION 2013 RITM, Bangalore. Page 32 CHAPTER-5 RADIO FREQUENCY TRANSMITTER & RECEIVER
- 33. WIRELESS POWER THEFT MONITORING SYSTEM AND INDICATION AT LOCAL SUBSTATION 2013 RITM, Bangalore. Page 33 5.1 BLOCK DIAGRAM AND EXPLANATION Fig 5.1: Data transmission & reception RF refers to radio frequency, the mode of communication for wireless technologies of all kinds, including cordless phones, radar, ham radio, GPS, and radio and television broadcasts.RF technology is so much a part of our lives we scarcely notice it for its ubiquity. From baby monitors to cell phones, Bluetooth® to remote control toys, RF waves are all around us. RFwaves are electromagnetic waves which propagate at the speed of light, or 186,000 miles per second (300,000 km/s). The frequencies of RF waves, however, are slower than those of visible light, making RF waves invisible to the human eye.
- 34. WIRELESS POWER THEFT MONITORING SYSTEM AND INDICATION AT LOCAL SUBSTATION 2013 RITM, Bangalore. Page 34 A RF module comprises of an RF Transmitter and an RF Receiver. The transmitter/receiver (Tx/Rx) pair operates at a frequency of 434 MHz. An RF transmitter receives serial data and transmits it wirelessly through RF through its antenna connected at pin4. The transmission occurs at the rate of 1Kbps - 10Kbps.The transmitted data is received by an RF receiver operating at the same frequency as that of the transmitter. 5.2 Pin diagram of rf transmitter and receiver module Fig 5.2 Pin Diagram of RF transmitter/receiver
- 35. WIRELESS POWER THEFT MONITORING SYSTEM AND INDICATION AT LOCAL SUBSTATION 2013 RITM, Bangalore. Page 35 5.3 Pin Description: 5.3.1 RF Transmitter Pin No Function Name 1 Ground (0V) Ground 2 Serial data input pin Data 3 Supply voltage; 5V Vcc 4 Antenna output pin ANT Table 5.3.1: Pin description 5.3.2 RF Receiver Pin No Function Name 1 Ground (0V) Ground 2 Serial data output pin Data 3 Linear output pin; not connected NC 4 Supply voltage; 5V Vcc 5 Supply voltage; 5V Vcc 6 Ground (0V) Ground 7 Ground (0V) Ground 8 Antenna input pin ANT Table 5.3.2: Pin description The encoder-decoder pair supports 4 bit parallel data. The circuit has two parts transmitter and the receiver. In the transmitter part we are using HT12E for encoding data from parallel to serial. The serial output from the encoder is fed to the data IN of the RF transmitter. Four switches namely SW0, SW1, SW2, SW3 are used to input data to the decoder. These switches are push button switches with active low states. (I.e. when you press it, the data input will be ‘0’ and in the released state data input will be ‘1’. The default state is ‘1’).
- 36. WIRELESS POWER THEFT MONITORING SYSTEM AND INDICATION AT LOCAL SUBSTATION 2013 RITM, Bangalore. Page 36 At the receiver section we are having RF receiver and HT12D decoder IC. The serial data from the receiver is fed into to the serial input of the decoder. The parallel data is displayed with the help of LED’s.
- 37. WIRELESS POWER THEFT MONITORING SYSTEM AND INDICATION AT LOCAL SUBSTATION 2013 RITM, Bangalore. Page 37 CHAPTER- 6 SOFTWARE USED AND CODINGS
- 38. WIRELESS POWER THEFT MONITORING SYSTEM AND INDICATION AT LOCAL SUBSTATION 2013 RITM, Bangalore. Page 38 6.1 Introduction to Embedded systems Embedded systems have tremendously grown in recent years, not only in their popularity but also in their complexity; gadgets are increasingly becoming intelligent and autonomous. Refrigerators, air conditioners, automobiles, mobile phones etc, are some of the common examples of device with built in intelligence. These devices function based on operating and environmental parameters. The intelligence of smart device resides in embedded systems. An embedded system, in general, incorporates hardware, operating systems, low level software binding the operating system and peripheral devices, and communication software to enable the system to perform the pre-defined function, an embedded system performs a single, well defined task, is tightly contained, in reactive and computes results in real time. Let us take the detail look at these features of embedded systems: Single functioned: An embedded system executes a specific program repeatedly, for example pager is always pager. In contrast a desktop system executes variety of program like spread sheets, word processor, etc. however, there are exceptions wherein. An embedded systems program is updated with newer program versions. Cell phones are examples of being updated in such a manner. Tightly constrained: All computing systems have constraints on design metrics but those on embedded systems can be especially tight, a design metric is a measure of a systems implementation which is a measure of systems implementations which include cost size, performance and power. Reactive and real time: many embedded systems must continually react to the changes in the systems and must compute certain results in the real time without delay.
- 39. WIRELESS POWER THEFT MONITORING SYSTEM AND INDICATION AT LOCAL SUBSTATION 2013 RITM, Bangalore. Page 39 6.1.1 Embedded hardware: An embedded hardware need a microcontroller and all kind of microcontroller used in them are quite varied. A list of some of some of them familiar are zilog z8 family, Intel 8051/808188/x86 families. Motorola 68k family and power pc family. 6.1.2 Embedded software: The software for the embedded systems is called firmware. The firmware will be written in assembly languages for time or resources critical operations or using higher languages like c or embedded c. the software will be simulates using microde simulators for the target processor. Since they are supposed to perform only specific tasks these programs are stored in read only memory (ROM’s).
- 40. WIRELESS POWER THEFT MONITORING SYSTEM AND INDICATION AT LOCAL SUBSTATION 2013 RITM, Bangalore. Page 40 6.2 Introduction to Keil µVision3 Fig 6.2: Keil µVision3 Main window The µVision3 IDE is a Windows-based software development platform that combines a robust editor, project manager, and makes facility. µVision3 integrates all tools including the C compiler, macro assembler, linker/locator, and HEX file generator. The µVision3 IDE offers numerous features and advantages that help you quickly and successfully develop embedded applications. They are easy to use and are guaranteed to help you achieve your design goals. 6.2.1 Features 1. The µVision3 Simulator is the only debugger that completely simulates all on-chip peripherals. 2. Simulation capabilities may be expanded using the Advanced Simulation Interface (ASI).
- 41. WIRELESS POWER THEFT MONITORING SYSTEM AND INDICATION AT LOCAL SUBSTATION 2013 RITM, Bangalore. Page 41 3. µVision3 incorporates project manager, editor, and debugger in a single environment. 4. The µVision3 Device Database automatically configures the development tools for the target microcontroller. 5. The µVision3 IDE integrates additional third-party tools like VCS, CASE, and FLASH/Device Programming. 6. The ULINK USB-JTAG Adapter supports both debugging and flash programming with configurable algorithm files. 7. Identical Target Debugger and Simulator User Interface. 8. The Code Coverage feature of the µVision3 Simulator provides statistical analysis of your program’s execution. 6.2.2 Benefits 1. Write and test application code before production hardware is available. Investigate different hardware configurations to optimize the hardware design. 2. Sophisticated systems can be accurately simulated by adding your own peripheral drivers. 3. Safety-critical systems can be thoroughly tested and validated. Execution analysis reports can be viewed and printed for certification requirements. 4. Accelerates application development. While editing, you may configure debugger features. While debugging, you may make source code modifications. 5. Quickly access development tools and third-party tools. All configuration details are saved in the µVision3 project. 6. The same tool can be used for debugging and programming. No extra configuration time required. 7. Shortens your learning curve. 8. Mistakes in tool settings are practically eliminated and tool configuration time is minimized.
- 42. WIRELESS POWER THEFT MONITORING SYSTEM AND INDICATION AT LOCAL SUBSTATION 2013 RITM, Bangalore. Page 42 The µVision3 screen provides you with a menu bar for command entry, a tool bar where you can rapidly select command buttons, and windows for source files, dialog boxes, and information displays. µVision3 lets you simultaneously open and view multiple source files. µVision3 has two operating modes: 1. Build Mode: Allows you to translate all the application files and to generate executable programs. The features of the Build Mode are described under Creating Applications. 2. Debug Mode: Provides you with a powerful debugger for testing your application. The debug mode is described in Testing Programs. In both operating modes you may use the source editor of µVision3 to modify your source code. The debug mode adds additional windows and stores an own screen layout.
- 43. WIRELESS POWER THEFT MONITORING SYSTEM AND INDICATION AT LOCAL SUBSTATION 2013 RITM, Bangalore. Page 43 6.3 C PROGRAMMING FOR MICROCONTROLLER 6.3.1Consumer side #include"Variable.h" #include"adc8591.h" void main(void) { CUT_OFF = LOW; DATA_IP = HIGH; for(gucloop=0; gucloop<=15; gucloop++) ucMeterDisplay[gucloop] = 0x20; LCD_INIT(); Prep_lcd_Write_Data("Energy Meter",LINE1_ADDR, "Theft Cntrl System", LINE2_ADDR); MSDelay(200 ); serial_Init(); Prep_lcd_Write_Data("Energy Meter",LINE1_ADDR, "Theft Cntrl System", LINE2_ADDR); bcd_units = Data_read_24C32(UNIT_LOC); hex_unit = byte_bcd_to_hex_conversion(bcd_units); ucPrePaidUnits = hex_unit; bcd_units = Data_read_24C32(PULSE_LOC); //read pulses hex_unit = byte_bcd_to_hex_conversion(bcd_units); ucUnitPulse = hex_unit; CUT_OFF = HIGH; while(1) { ADC_Value(); byte_hex_to_bcd_conversion(ucPrePaidUnits);
- 44. WIRELESS POWER THEFT MONITORING SYSTEM AND INDICATION AT LOCAL SUBSTATION 2013 RITM, Bangalore. Page 44 ucMeterDisplay[1] = ucbcd100; ucMeterDisplay[2] = ucbcd10; ucMeterDisplay[3] = ucbcd1; ucMeterDisplay[4] = ' '; ucMeterDisplay[5] = ' '; ucMeterDisplay[6] = ' '; ucMeterDisplay[7] = ' '; ucMeterDisplay[8] = ':'; ucMeterDisplay[9] = ' '; ucMeterDisplay[10] = ' '; ucMeterDisplay[11] = ' '; byte_hex_to_bcd_conversion(ucUnitPulse); ucMeterDisplay[12] = ucbcd100; ucMeterDisplay[13] = ucbcd10; ucMeterDisplay[14] = ucbcd1; Prep_lcd_Write_Data_lcd("UNIT : Pulse",LINE1_ADDR, &ucMeterDisplay[0], LINE2_ADDR); } while(1); } void timer_Interrupt(void) interrupt 1 //10MS TIMER INTERRUPT { static unsigned int idata ucpulseCount=10; TR0 = 0; TL0 = RELOADLOW0; TH0 = RELOADHI0; TR0 = 1; if(DATA_IP == 0) { ucpulseCount--; if(ucpulseCount == 0) { ucpulseCount = 10; ucUnitPulse++;
- 45. WIRELESS POWER THEFT MONITORING SYSTEM AND INDICATION AT LOCAL SUBSTATION 2013 RITM, Bangalore. Page 45 Data_Write_24C32(PULSE_LOC,ucUnitPulse); if((ucUnitPulse % PULSE) == 0) { ucPrePaidUnits++; ucUnitPulse = 0; Data_Write_24C32(UNIT_LOC,ucUnitPulse); } } } } void serial_Init(void) { unsigned char int_temp = 0; ////////////////////// Timer 0 10 ms init ////////////////////////// IE = 0; TR0 = 0; TL0 = RELOADLOW0; TH0 = RELOADHI0; int_temp = TMOD; int_temp |= 0X01; TMOD = int_temp; TR0 = 1; int_temp = IE; int_temp |= 0x02; IE = int_temp; TF0 = 0; int_temp = IE; int_temp |= 0x80; IE = int_temp; //////////// Timer 1 serial init with 2400 baud rate ///////////////// int_temp = PCON; int_temp |= 0x80; PCON = int_temp; TMOD |= 0x20;
- 46. WIRELESS POWER THEFT MONITORING SYSTEM AND INDICATION AT LOCAL SUBSTATION 2013 RITM, Bangalore. Page 46 TH1=0xFA; // 9600 Baudrate SCON=0x50; TR1 = 1; TI = 1; RI=0; ES = 1; PS=1; } void MSDelay(unsigned int delay) { unsigned int i,j; for(i=0;i<delay;i++) for(j=0;j<2000;j++); } void MSDelay_lcd(unsigned int delay) { unsigned int i; for(i=0;i<delay;i++); } void serial(void) interrupt 4 { unsigned char temp_char; if(TI) { TI = 0; } else if(RI) { temp_char = SBUF; RI = 0; } } void byte_hex_to_bcd_conversion(unsigned char tmp_hex_value)
- 47. WIRELESS POWER THEFT MONITORING SYSTEM AND INDICATION AT LOCAL SUBSTATION 2013 RITM, Bangalore. Page 47 { int hex_value = (int)tmp_hex_value; unsigned char hex_wt; /* variable to store the weights of hex no */ ucbcd100 = ucbcd10 = ucbcd1 = 0; hex_wt = 0x64; /* hex digit 3 weight value */ while(1) { hex_value -= hex_wt; if(hex_value<0) break; ucbcd100++; } ucbcd100 = ucbcd100 + 0x30; hex_value += hex_wt; hex_wt = 0xA; /* hex digit 2 weight value */ while(1) { hex_value -= hex_wt; if(hex_value<0) break; ucbcd10++; } ucbcd10 = ucbcd10 + 0x30; hex_value += hex_wt; // i2cbcd=((ucbcd10<<4)|hex_value); ucbcd1 = hex_value+0x30; } void LCD_INIT(void) { write_instr_bit(0x38);//8-bit data -2-line display MSDelay(10); write_instr_bit(0x0e);//cursor on MSDelay(10); write_instr_bit(0x01);//clear display
- 48. WIRELESS POWER THEFT MONITORING SYSTEM AND INDICATION AT LOCAL SUBSTATION 2013 RITM, Bangalore. Page 48 MSDelay(10); write_instr_bit(0x06);//increment cursor MSDelay(10); } void write_instr_bit(unsigned char value) { LCD_DATA=value; REG_SELECT=0; LCD_CS=1; MSDelay(1); LCD_CS=0; } void Prep_lcd_Write_Data(unsigned char *line1, unsigned char Line1Addr, unsigned char *line2, unsigned char Line2Addr) { unsigned char i; write_instr_bit(0x01);//clear display MSDelay_lcd(1); write_instr_bit(Line1Addr); for(i=0; line1[i] !=NULL_00; i++) { LCD_DATA=line1[i]; REG_SELECT=1; LCD_CS=1; MSDelay_lcd(5); LCD_CS=0; } write_instr_bit(Line2Addr); for(i=0; line2[i] !=NULL_00; i++) { LCD_DATA=line2[i]; REG_SELECT=1; LCD_CS=1; MSDelay_lcd(5);
- 49. WIRELESS POWER THEFT MONITORING SYSTEM AND INDICATION AT LOCAL SUBSTATION 2013 RITM, Bangalore. Page 49 LCD_CS=0; } } void Prep_lcd_Write_Data_lcd(unsigned char *line1, unsigned char Line1Addr, unsigned char *line2, unsigned char Line2Addr) { unsigned char i; write_instr_bit(Line1Addr); for(i=0; line1[i] !=NULL_00; i++) { LCD_DATA=line1[i]; REG_SELECT=1; LCD_CS=1; MSDelay_lcd(5); LCD_CS=0; } write_instr_bit(Line2Addr); for(i=0; line2[i] !=NULL_00; i++) { LCD_DATA=line2[i]; REG_SELECT=1; LCD_CS=1; MSDelay_lcd(5); LCD_CS=0; } } unsigned char byte_bcd_to_hex_conversion(unsigned char bcd_value) { return((((bcd_value & 0xF0) >> 4) * 10) + (bcd_value & 0x0F)); } unsigned char Data_read_24C32(unsigned int data_addr) { unsigned char address_lower_byte=0,address_msb_byte=0x00,ok=0,hex_val=0; CLOCK_SCL = LOW;
- 50. WIRELESS POWER THEFT MONITORING SYSTEM AND INDICATION AT LOCAL SUBSTATION 2013 RITM, Bangalore. Page 50 CLOCK_SDA = HIGH; CLOCK_SCL = HIGH; CLOCK_SDA = LOW; CLOCK_SCL = LOW; data_write(WRITE_CONTROL_BYTE); eeprom_ack(); address_msb_byte=(data_addr&0X0f00)>>8; address_lower_byte=(data_addr&0X00ff); data_write(address_msb_byte); eeprom_ack(); data_write(address_lower_byte); eeprom_ack(); CLOCK_SCL = HIGH; CLOCK_SDA = HIGH; CLOCK_SDA = LOW; data_write(READ_CONTROL_BYTE); eeprom_ack(); hex_val=0x20; hex_val=data_read(); eeprom_ack(); CLOCK_SDA = LOW; CLOCK_SCL = HIGH; CLOCK_SDA = HIGH; return(hex_val); } unsigned char data_read() { unsigned char i; unsigned char uctemp=0; CLOCK_SCL = LOW; for(i=0; i<8; i++) { CLOCK_SCL = HIGH; uctemp <<= 1;
- 51. WIRELESS POWER THEFT MONITORING SYSTEM AND INDICATION AT LOCAL SUBSTATION 2013 RITM, Bangalore. Page 51 uctemp |= CLOCK_SDA; CLOCK_SCL = LOW; } // Soft_Delay_Service(10); return(uctemp); } void data_write(unsigned char data_to_write) { unsigned char i; for(i=0; i<8; i++) { CLOCK_SCL = LOW; CLOCK_SDA = (data_to_write & BIT_D7)? 1 : 0; CLOCK_SCL = HIGH; CLOCK_SCL = LOW; CLOCK_SCL = LOW; data_to_write<<=1; } } void eeprom_ack(void) { unsigned char index; CLOCK_SCL = HIGH; index = CLOCK_SDA; CLOCK_SCL = LOW; CLOCK_SDA= HIGH; } void Data_Write_24C32(unsigned int data_addr,unsigned char data_data) { unsigned char address_lower_byte=0,address_msb_byte=0x00,ok=0;//,i; CLOCK_SCL = LOW; CLOCK_SDA = HIGH; CLOCK_SCL = HIGH; CLOCK_SDA = LOW;
- 52. WIRELESS POWER THEFT MONITORING SYSTEM AND INDICATION AT LOCAL SUBSTATION 2013 RITM, Bangalore. Page 52 CLOCK_SCL = LOW; data_write(WRITE_CONTROL_BYTE); eeprom_ack(); address_msb_byte=(data_addr&0X0f00)>>8; address_lower_byte=(data_addr&0X00ff); data_write(address_msb_byte); eeprom_ack(); data_write(address_lower_byte); eeprom_ack(); //for(i=0;i<10;i++) //{ data_write(data_data); eeprom_ack(); // } CLOCK_SDA = LOW; CLOCK_SCL = HIGH; CLOCK_SDA = HIGH; } void ADC_Value(void) { i2c_read(0x9E,0x41,&d[0]); //read ADC RESULT from channel 0 PUT 0X43 i2c_read(0x9E,0x42,&d[1]); //read ADC RESULT from channel 1 PUT 0X44 if((d[0] == 255)) { CUT_OFF = LOW; Prep_lcd_Write_Data(" Theft ",LINE1_ADDR," Detected ", LINE2_ADDR); MSDelay(50); if(!ONE) { SBUF = 'A'; MSDelay(50);
- 53. WIRELESS POWER THEFT MONITORING SYSTEM AND INDICATION AT LOCAL SUBSTATION 2013 RITM, Bangalore. Page 53 } if(!TWO) { SBUF = 'B'; MSDelay(50); } if(!THREE) { SBUF = 'C'; MSDelay(50); } if(!FOUR) { SBUF = 'D'; MSDelay(50); } } i2c_read(0x9E,0x43,&d[2]); //read ADC RESULT from channel 2 PUT 0X45 i2c_read(0x9E,0x44,&d[3]); //read ADC RESULT from channel 3 PUT 0X46 } void TxdCommandToModem(unsigned char *s) { while(*s!=NULL_00) { SBUF = *s; MSDelay(1); s++; } MSDelay(10); }
- 54. WIRELESS POWER THEFT MONITORING SYSTEM AND INDICATION AT LOCAL SUBSTATION 2013 RITM, Bangalore. Page 54 6.3.2 Substation side microcontroller program #include<reg52.h> #include"variable.h" void main(void) { LCD_INIT(); BUZZER = 0; serial_Init(); Prep_lcd_Write_Data("Theft Control",LINE1_ADDR, "Monitoring System", LINE2_ADDR); MSDelay(50); while(1) { if(SBUF == 'A') gbunit_flag1 = 1; if(SBUF == 'B') gbunit_flag2 = 1; if(SBUF == 'C') gbunit_flag3 = 1; if(SBUF == 'D') gbunit_flag4 = 1; if(gbunit_flag1) { BUZZER = 1; gbunit_flag1 = 0; Prep_lcd_Write_Data("#64 Vijayanagar",LINE1_ADDR, "Bangalore", LINE2_ADDR); TxdCommandToModem("#64 Vijayanagar Bangalorern"); MSDelay(50); BUZZER = 0; MSDelay(50); } else if(gbunit_flag2)
- 55. WIRELESS POWER THEFT MONITORING SYSTEM AND INDICATION AT LOCAL SUBSTATION 2013 RITM, Bangalore. Page 55 { BUZZER = 1; gbunit_flag2 = 0; Prep_lcd_Write_Data("#165 Jayanagar",LINE1_ADDR, "Bangalore", LINE2_ADDR); TxdCommandToModem("#165 Jayanagar Bangalorern"); MSDelay(50); BUZZER = 0; MSDelay(50); } else if(gbunit_flag3) { BUZZER = 1; gbunit_flag3 = 0; Prep_lcd_Write_Data("#1036 J.P Nagar",LINE1_ADDR, "Bangalore", LINE2_ADDR); TxdCommandToModem("#1036 J. P Nagar Bangalorern"); MSDelay(50); BUZZER = 0; MSDelay(50); } else if(gbunit_flag4) { BUZZER = 1; gbunit_flag4 = 0; Prep_lcd_Write_Data("#3 Yelahaka ",LINE1_ADDR, "Bangalore", LINE2_ADDR); TxdCommandToModem("#3 Yelahaka Bangalorern"); MSDelay(50); BUZZER = 0; MSDelay(50);
- 56. WIRELESS POWER THEFT MONITORING SYSTEM AND INDICATION AT LOCAL SUBSTATION 2013 RITM, Bangalore. Page 56 } else { BUZZER = 0; } } while(1); } //serial init with 9600 baud void serial_Init(void) { IE = 0; //disabling interrupts TR0 = 0; //starting all the timer should be off by TR1 = 0; // clearing timer flags:tr0,tr1,tf0. TF0 = 0; ET0 = 0; //enabling timer 0 interrupt PCON = 0x80; //doubling the baud rate TMOD |= 0x21; //select timer1 in mod2 & timer0 in mod0 TH1 = 0xFA; // initialise the timer1 value for baud rate with 9600 SCON = 0x50; // 8-bit UART & run enable TR1 = 1; // timer1 on TI = 0; RI = 0; ES = 1; //Enable seriel interrupt PS = 1; //Higher pririty to seriel interupt EA = 1; //Enable ALL Interrupt } //serial interrupt handling void serial(void) interrupt 4 { unsigned char temp_char; if(TI) {
- 57. WIRELESS POWER THEFT MONITORING SYSTEM AND INDICATION AT LOCAL SUBSTATION 2013 RITM, Bangalore. Page 57 TI = 0; } else if(RI) { temp_char = SBUF; RI = 0; } } void TxdCommandToModem(unsigned char *s) { while(*s!=NULL_00) { SBUF = *s; MSDelay(1); s++; } MSDelay(10); } void LCD_INIT(void) { write_instr_bit(0x38);//8-bit data -2-line display MSDelay(10); write_instr_bit(0x0e);//cursor on MSDelay(10); write_instr_bit(0x01);//clear display MSDelay(10); write_instr_bit(0x06);//increment cursor MSDelay(10); } //func to send commands to lcd void write_instr_bit(unsigned char value) { LCD_DATA=value;
- 58. WIRELESS POWER THEFT MONITORING SYSTEM AND INDICATION AT LOCAL SUBSTATION 2013 RITM, Bangalore. Page 58 REG_SELECT=0; LCD_CS=1; MSDelay(1); LCD_CS=0; } void Prep_lcd_Write_Data(unsigned char *line1, unsigned char Line1Addr, unsigned char *line2, unsigned char Line2Addr) { unsigned char i; write_instr_bit(0x01);//clear display MSDelay_lcd(1); write_instr_bit(Line1Addr);//to display in line one or the cursor moves to initial position of line one for(i=0;((line1[i]!=NULL_00) && (i<16)); i++) { LCD_DATA = line1[i]; REG_SELECT=1; LCD_CS=1; MSDelay_lcd(5); LCD_CS=0; } write_instr_bit(Line2Addr);//to display in line two or the cursor moves to initial position of line two for(i=0; ((line2[i]!=NULL_00) && (i<16)); i++) { LCD_DATA = line2[i]; REG_SELECT=1; LCD_CS=1; MSDelay_lcd(5); LCD_CS=0; } } //to create some delay void MSDelay(unsigned int delay)
- 59. WIRELESS POWER THEFT MONITORING SYSTEM AND INDICATION AT LOCAL SUBSTATION 2013 RITM, Bangalore. Page 59 { unsigned int i,j; for(i=0;i<delay;i++) for(j=0;j<1200;j++); } void MSDelay_lcd(unsigned int delay) { unsigned int i; for(i=0;i<delay;i++); }
- 60. WIRELESS POWER THEFT MONITORING SYSTEM AND INDICATION AT LOCAL SUBSTATION 2013 RITM, Bangalore. Page 60 6.4 FLASH MAGIC Flash Magic is Windows software from the Embedded Systems Academy that provides access to all ISP features like programming, reading and erasing the flash memory, setting the baud rate. It provides a clear and simple user interface. Below is the screenshot of the main window of Flash Magic. Fig 6.4.1: Flash magic main window 1. Select the desired COM port, baud rate, desired device and the oscillator frequency. 2. Erase the desired memory block. This is optional. 3. Load the HEX file generated from KEIL software. 4. Select Verify after programming option. 5. Click on Start. Once started the progress information and a progress bar will be displayed at the bottom of the main window.
- 61. WIRELESS POWER THEFT MONITORING SYSTEM AND INDICATION AT LOCAL SUBSTATION 2013 RITM, Bangalore. Page 61 6.5 Flowchart:
- 62. WIRELESS POWER THEFT MONITORING SYSTEM AND INDICATION AT LOCAL SUBSTATION 2013 RITM, Bangalore. Page 62 CHAPTER- 7 WORKING OF THE SYSTEM
- 63. WIRELESS POWER THEFT MONITORING SYSTEM AND INDICATION AT LOCAL SUBSTATION 2013 RITM, Bangalore. Page 63 7.1 Block diagram and explanation Fig 7.1: Block Diagram Power Supply: The power supply in normal terms is used to energise the circuit. The input to the power supply block in the block diagram is 230V, 50Hz ac. The rectifier used here is a bridge rectifier. Which is a highly efficient rectifier, it is used to convert AC into DC. The output of the rectifier is DC but it is not free from distortions. To remove the distortions, we have used a capacitive filter. This makes the output distortion less DC. The output of the power supply is 12 volts which is directly given to the relay to operate and other is output is given to the voltage regulator LN7805 which further regulates the voltage to 5 volts which is suitable for the microcontroller to operate. Microcontroller: Microcontroller is used to control the operation and to control other devices. The micro-controller used here is P89V51RD2. It is manufactured by Philips. The microcontroller works by 5volts. Its features are:
- 64. WIRELESS POWER THEFT MONITORING SYSTEM AND INDICATION AT LOCAL SUBSTATION 2013 RITM, Bangalore. Page 64 8 bit controller 16 bits address line 8 bits data line 128 bytes RAM 4 Kbytes ROM 16 bit timers divided into two 8bit timers UART(Universal Asynchronous Receiver Transmitter 4 ports LCD (Liquid Crystal Display): LCD is a display technology that uses liquid crystal that flows like liquid and bends light. The more the molecules are twisted, the better will be the contrast and viewing angle. There are two modes in LCD 8-bit mode and 4-bit mode, we have used 4-bit mode in our project. Serial Converter: The CPU uses 12v logic where as the microcontroller works on 5v logic. For conversion purpose, a serial converter RS232 is used. RS 232 is used in order to avoid the signal from becoming weak. Line Sensor and Meter Pulse Sensor: Line Pulse sensor is used to sense if the current from the output of the energy meter is flowing properly, to sense if the current limit exceeds its threshold value and if any of the wire is disconnected from the energy meter. Meter pulse sensor is used to sense if the pulses generated by the energy meter are generated at the same interval of time with respect to the current through line sensors and also if the pulses are generating whenever the current is flowing. For both the sensors we have used a device called an Optocoupler (MCT2E). An optocoupler is essentially an optical transmitter and an optical receiver connected by a non-conductive barrier. It uses a beam of light to transfer energy from one circuit element to another, and it can handle incoming voltages of up to 7500V. The
- 65. WIRELESS POWER THEFT MONITORING SYSTEM AND INDICATION AT LOCAL SUBSTATION 2013 RITM, Bangalore. Page 65 barrier that separates the two side of the optocoupler is made from a transparent glass or plastic polymer that does not conduct electricity but does conduct light. The actual physical device of the optocoupler is usually encased in a dark, non- conductive casing. It is attached into the electric circuit through small metal teeth and has holes on either end of the small cabinet for wire connections to pass through. Relay: In this project Electromagnetic relays are being used, they are constructed with electrical, magnetic and mechanical components, have an operating coil and various contacts and are very robust and reliable. The relay used in our project has one Normally Open and one Normally closed terminals. Personal Computer: It is connected to the receiver end at the local substation. Connected serially to the microcontroller of the receiver section at the substation which locates the exact house or premises where power theft is being carried out.
- 66. WIRELESS POWER THEFT MONITORING SYSTEM AND INDICATION AT LOCAL SUBSTATION 2013 RITM, Bangalore. Page 66 7.2 Circuit diagrams Fig 7.2: Circuit Diagram of the Transmitter Section
- 67. WIRELESS POWER THEFT MONITORING SYSTEM AND INDICATION AT LOCAL SUBSTATION 2013 RITM, Bangalore. Page 67 Fig 7.3: Circuit Diagram of the Receiver Section
- 68. WIRELESS POWER THEFT MONITORING SYSTEM AND INDICATION AT LOCAL SUBSTATION 2013 RITM, Bangalore. Page 68 7.3 Operation of the model There are two parts in this project, Consumer Side Substation side In our project we are using RF technology to communicate between the two parts of this project for data transmission. 7.3.1 CONSUMER SIDE: Fig 7.3.1: consumer side model There are various kinds of energy meters available but we are using a digital energy meter as now a day’s all the old type of meters have been replaced by the digital type of energy meters. The energy meters has four ports of which two ports are connected to the supply from the substation (one is phase and another is neutral) and two ports are for supplying the power to the loads at the consumer premises. The neutral terminals of both the input and the output sides are shorted inside the meter.
- 69. WIRELESS POWER THEFT MONITORING SYSTEM AND INDICATION AT LOCAL SUBSTATION 2013 RITM, Bangalore. Page 69 The input to the LED of the optocoupler for the meter pulse sensor is given from the calibration terminal of the energy meter and the output of the phototransistor of the optocoupler circuit is connected to the microcontroller. For the line pulse sensor the input to the optocoupler circuit is given by the phase of the input to the energy meter and the neutral of the energy meter and the output from the optocoupler is given to the microcontroller. The microcontroller receives the data from the sensors and sends it to the encoder where the data is converted into radio waves of 433.92MHz and transmitted by the transmitter. The supply from the substation is passed to the consumer side through the energy meter in order to record the power being used, the meter pulse sensor receives a pulse after one full digit rotation from the digital energy meter and LED glows green. The line sensor detects the abnormalities in the current flow and also if any terminal of the energy meter is disconnected. If the sensors doesn’t receive the pulses after a specific period of time the LED turns red and the data is given to the microcontroller which in turn transmits the data through the transmitter.
- 70. WIRELESS POWER THEFT MONITORING SYSTEM AND INDICATION AT LOCAL SUBSTATION 2013 RITM, Bangalore. Page 70 7.3.2 SUBSTATION SIDE: Fig 7.3.2: Substation side model The radio waves sent by the consumer module is received by the receiver and it is decoded by the decoder in its original form of data and is then sent to the microcontroller. If there has been any tampering or discrepancies done with the meter by the consumer the buzzer gives an alarm and the exact location at which the power theft is being carried out is shown on the personal computer at the substation, so that the person at the substation can go and have a check.
- 71. WIRELESS POWER THEFT MONITORING SYSTEM AND INDICATION AT LOCAL SUBSTATION 2013 RITM, Bangalore. Page 71 CHAPTER- 8 RESULTS AND DISCUSSIONS
- 72. WIRELESS POWER THEFT MONITORING SYSTEM AND INDICATION AT LOCAL SUBSTATION 2013 RITM, Bangalore. Page 72 8. RESULTS AND DISCUSSIONS In this project we are dealing with two types of meter tampering. They are 1. Fiddling with the meter lines which are sensed by the Line sensor. 2. Disconnecting the internal parts of the meter in order to avoid meter recordings which can be sensed by the Meter Pulse Sensor. The energy meter input takes in the 230 volts from the supply and from its output one line is given to a 12-0-12 volts step-down transformer which steps down the voltage to 12volts and then it is converted into pure dc voltage by the help of full wave bridge rectifier and a capacitive filter which is further given to the relay as the relay has an operating voltage of 12 volts. The other line from the output of the energy meter is directly given to the load that is a bulb in our model. The output from the bridge rectifier is also given to the voltage regulator LN7805 for regulating the voltage to 5 volts which is suitable for the microcontroller to operate. An encoder-decoder is used for converting the data into the radio wave and again reconverting the radio waves into the original form of data. In this project, the message for properly working energy meters or any tampering being done with is displayed on the computer at the substation with the help of Hyper Terminal Software for the person operating, to keep a check. It also gives the exact location where the power theft is being carried out if any. When the energy meter works normally i.e. no tampering has been done with it then the message displayed by the computer in the Hyper Terminal window shows as follows with each pulse getting generated by the meter pulse sensor: In this project, we have designed the model to detect two types of discrepancies: when any of the lines are removed from the meter terminal due to tampering being done to the meter the line sensors senses it and it sends the data to the microcontroller which is then with the help of encoder HT12E is transmitter by the transmitter unit from the consumer premises, which is intercepted by the receiver at the substation and further
- 73. WIRELESS POWER THEFT MONITORING SYSTEM AND INDICATION AT LOCAL SUBSTATION 2013 RITM, Bangalore. Page 73 decoded by HT12D for the microcontroller to ring an alarm by the buzzer and demonstrate the exact location of power theft on the computer at the substation. When the inner circuit of the energy meter is disconnected from the input and output of the energy meter in order to avoid the recordings of the meter readings the meter pulse sensor detects it and it is sent to the microcontroller and further displayed on the substation computer. In order to reset the system a reset button in both the transmitter and receiver module is provided which could be pressed in order to start a fresh.
- 74. WIRELESS POWER THEFT MONITORING SYSTEM AND INDICATION AT LOCAL SUBSTATION 2013 RITM, Bangalore. Page 74 CHAPTER-9 ADVANTAGES AND DISADVANTAGES
- 75. WIRELESS POWER THEFT MONITORING SYSTEM AND INDICATION AT LOCAL SUBSTATION 2013 RITM, Bangalore. Page 75 9.1 ADVANTAGES • Easy installation. • It is easy to identify the exact place where power theft is going on. • Economical and less maintenance. • We can implement this method in industrial and domestic applications. 9.2 DISADVANTAGES • Interruption of the power supply at the load during the operation. • It needs an additional power circuit for the operation of the Micro-Controller at every individual house.
- 76. WIRELESS POWER THEFT MONITORING SYSTEM AND INDICATION AT LOCAL SUBSTATION 2013 RITM, Bangalore. Page 76 CHAPTER -10 CONCLUSION AND FUTURE SCOPE
- 77. WIRELESS POWER THEFT MONITORING SYSTEM AND INDICATION AT LOCAL SUBSTATION 2013 RITM, Bangalore. Page 77 10.1 CONCLUSION In order to overcome the revenue losses due to power theft in our country, we have made a small attempt through this project. By this work we can conclude that the power theft can be effectively curbed, ‘Wireless Power Theft Monitoring System At The Local Substation', proves useful to the people who use it and helps in eliminating illegal usage of electricity by working reliably and satisfactorily, thus saving the revenue loss to the electricity supplying authority in future which incur due to power theft. 10.2 SCOPE FOR FUTURE DEVELOPMENT Fig 10.2: Block diagram for power theft monitoring and billing system This project can be further developed by adding an automatic billing system which would display the amount of power consumed by each consumer at the substation which would further reduce the labour cost and time. In order to have automatic billing system, the 4 bit RF module has to be replaced by an 8 bit RF module and an EPROM (Erasable programmable read only memory) has to be added at the substation end for the display of the units consumed by each consumer.
- 78. WIRELESS POWER THEFT MONITORING SYSTEM AND INDICATION AT LOCAL SUBSTATION 2013 RITM, Bangalore. Page 78 REFERENCES 1. Publication of Little Lion Scientific R&D, Islamabad Pakistan, Journal of theoretical and Applies Information Technology,30th April 2011 2. http://ieeexplore.ieee.org/Xplore/login.jsp?url=http%3A%2F%2Fieeexplore.ieee.o rg%2Fiel5%2F4918025%2F4918026%2F04918176.pdf%3Farnumber%3D49181 76&authDecision=-203 3. http://ieeexplore.ieee.org/Xplore/login.jsp?url=http%3A%2F%2Fieeexplore.ieee.o rg%2Fiel5%2F4035454%2F4078480%2F04078503.pdf%3Farnumber%3D40785 03&authDecision=-203 4. T. B. Smith, “Electricity Theft: a Comparative Analysis”, Energy Policy, Volume 32, Issue 18, December 2008; 2003, pp. 2067 – 2076. 5. http://www.financialexpress.com/news/a-strategy-to-cut-mounting-power- losses/554513/0 BIBLIOGRAPHY 1. For microcontroller 8051 we have referred the text book by Mohammed Ali Mazidi and Janice Gillispie Mazidi, “The 8051 Microcontroller and Embedded System” Pearson Education,2003 2. Kenneth J Ayala, “The 8051 Microcontroller Architecture, Programming and Applications”, 2nd edition, Penram International,1996. 3. Publication of Little Lion Scientific R&D, Islamabad Pakistan, Journal of theoretical and Applies Information Technology,30th April 2011 4. www.datasheets.com 5. Uday A. Bakshi & Mayuresh V. Bakshi, “Switchgear and Protection” Technical Publications, February 2011 6. David A Bell, “Operational Amplifiers and Linear IC’s”,PHI 2008 7. Robert L.Boylestad and Louis Nashelsky, “Electronic Devices and Circuit Theory”,Pearson Education,9th Edition.