Xpert HR webinar
•Descargar como PPTX, PDF•
0 recomendaciones•367 vistas

HR analytics - from data to insights. Slides from XpertHR event June 2016

Recomendados
Recomendados
Más contenido relacionado
La actualidad más candente
La actualidad más candente (20)
Destacado
Destacado (14)
Similar a Xpert HR webinar
Similar a Xpert HR webinar (20)
Último
Último (20)
Xpert HR webinar
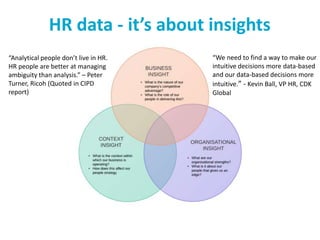
- 1. HR data - it’s about insights “We need to find a way to make our intuitive decisions more data-based and our data-based decisions more intuitive.” - Kevin Ball, VP HR, CDK Global “Analytical people don’t live in HR. HR people are better at managing ambiguity than analysis.” – Peter Turner, Ricoh (Quoted in CIPD report)
- 2. But “the people analytics revolution is gaining speed…in 2016 we see a major leap forward in capabilities” A lot more being said than done
- 3. From data to insights • Data: Coded values collected from business processes, raw facts, eg headcount and revenues (ambient data – stuff just lying around). • Metrics: Measurement created by combining data, eg revenue per FTE. • Analysis and information: Compared to what? Since when? Eg Has our revenue per FTE gone up or down? How does that compare with our competitors? • Intelligence: What else do we know? Eg Do we have a lot of non-revenue generating employees due to recent investment? How does this compare to our competitors? • Insight: Whole story, eg our revenue per FTE is still ahead of our competitors, even after our increased research headcount.
- 4. 3 levels of analytics • Level 1 - basic analytics: The use of descriptive data to illustrate a particular aspect of HR. This covers most of the standard reports from the HRIS, for example, headcount, turnover, absence rates and age profiles. • Level 2 - using multidimensional data: Combining different data sets, or types of data to investigate relationships between them. This involves cross referencing HR data with information from other systems, for example looking at the relationship between absence and financial or sales performance. • Level 3 - predictive analysis: Using data to predict future trends or to anticipate events and scenarios. For example, forecasting attrition rates or modeling future remuneration costs. Some organisations claim to have used HR analytics to identify probable leavers and predict future team performance.
- 5. Data Metrics Information/Analysis Intelligence Insight From data to insights Number of successful calls Number of staff in each location Supervisor development scores Training investment Successful calls per employee Aggregate scores by location Average supervisor rating How do locations compare? How has this changed? What is difference between performance of supervisors? Business circumstances? Seasonal effects? What else was going on? Where we invested in supervisor development, team performance improved Quantitative Quantitative & qualitative Is our supervisor development working?
- 6. Getting started Focus on business priorities: • To achieve our business goals, what information will we need over the next 3 years? • What is the CEO interested in? • What stories do we want to be able to tell the exec team? • How does the company make its money and how will these measures help? One version of the truth: • Single point of data entry for all people data • Integrate with other systems • Clean your data • Agree common coding with other functions • HRIS becomes source for all people data on other systems
- 7. Getting started Build your skills: • Data and analytics team • Critical thinking skills • Ability to understand patterns in data - what it is telling us and what it is not • Consultancy skills - people who can understand the business, get HR and can do data Work with other functions: • IT • Finance • Marketing Just start! • Download some data, mess about with it, see what you find
- 8. Poll – what do you measure? 1. Absence 2. Workforce costs 3. Employee turnover and retention 4. Workforce productivity 5. Cost of the HR function 6. Employee engagement 7. Remuneration relative to market 8. Metrics that link people management to financial performance 9. None
- 9. What do organisations measure? Source: Partnering for performance – EY
- 10. Working with finance “CFOs and CHROs at high-performing companies collaborate better and differently” Source: Partnering for performance – EY
- 11. Example metrics Workforce profile: • Heads and FTE • Age and length of service • Type, eg sales/operations/development/support • Grade and span of control Performance and productivity: • Revenue per FTE • Human Capital ROI • Human Capital Value Added (HCVA) • Absence • Performance ratings relative to business performance Reward: • Total reward as % of revenue • Compa ratios • Percentage of employees paid above or below market rate Talent: • Capability gaps • % new hires at mid-performance point by first review • Succession risk - % of key roles with no clear successor • Replacement impact (difference between reward of new hires and those who have left over same period)
- 14. 4 ways to show changing profile Source: Institute for Government Source: National Audit Office
Notas del editor
- “The team didn’t start with fancy forecasting algorithms or advanced predictive tools. Instead, the team began by understanding the people problems that needed to be addressed and the organizational context.” – Google Re:work
- Does supervisor assessment match business performance? HR data from development centres and appraisal cross referenced with call handling data (Yes) What’s the relationship between sales and training investment? Data from HR development system and sales system (Those that invested more sold more) Do we have “problem business units”? Calls to the HR service centre, absence data and data on project over-runs (Yes, there were problem areas)