Richard Silberstein_Water and carbon fluxes from a Banksia woodland at the Gingin OzFlux site in WA
•
1 recomendación•738 vistas

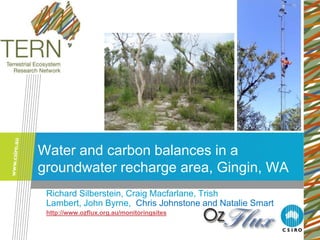
The document discusses a study measuring water and carbon balances in a native bush ecosystem located in a groundwater recharge area in Gingin, Western Australia. Instruments were installed to monitor soil moisture, water table levels, and carbon and water fluxes. The goal is to understand the water usage and carbon balance of the native vegetation and contribute to sustainable management of the local ecosystem and groundwater resources.

Recomendados
Más contenido relacionado
Destacado
Destacado (14)
Similar a Richard Silberstein_Water and carbon fluxes from a Banksia woodland at the Gingin OzFlux site in WA
Similar a Richard Silberstein_Water and carbon fluxes from a Banksia woodland at the Gingin OzFlux site in WA (12)
Más de TERN Australia
Más de TERN Australia (20)
Richard Silberstein_Water and carbon fluxes from a Banksia woodland at the Gingin OzFlux site in WA
- 1. Water and carbon balances in a groundwater recharge area, Gingin, WA Richard Silberstein, Craig Macfarlane, Trish Lambert, John Byrne, Chris Johnstone and Natalie Smart http://www.ozflux.org.au/monitoringsites
- 2. Ecosystem response to stress Duration of talk (min) 0 10 20 Apparent duration of talk (min) Water and carbon balances, Gingin, WA – Silberstein, TERN Symposium, February, 2013
- 3. Ecosystem response to stress Duration of talk (min) 0 10 20 Apparent duration of talk (min) Water and carbon balances, Gingin, WA – Silberstein, TERN Symposium, February, 2013
- 4. Ecosystem response to stress Duration of talk (min) 0 10 20 Apparent duration of talk (min) Water and carbon balances, Gingin, WA – Silberstein, TERN Symposium, February, 2013
- 5. Ecosystem response to stress Duration of talk (min) 0 10 20 Graph of Flux data Apparent duration of talk (min) Water and carbon balances, Gingin, WA – Silberstein, TERN Symposium, February, 2013
- 6. Ecosystem response to stress Duration of talk (min) 0 10 20 Graph of Flux data Apparent duration of talk (min) Water and carbon balances, Gingin, WA – Silberstein, TERN Symposium, February, 2013
- 7. Why Gingin? South-west Western Australia has had a major climate shift since the early 1970s About 1deg rise in mean temperature in the 20th Century 1 Temperature anomaly (°C) ... 0.5 0 -0.5 -1 -1.5 1910 1920 1930 1940 1950 1960 1970 1980 1990 2000 Water and carbon balances, Gingin, WA – Silberstein, TERN Symposium, February, 2013
- 8. And a major reduction in rainfall since the early 1970s About 1deg rise in mean temperatureprevious20th Century Last quarter century winter rain as % of in the 75 years ase cre De Water and carbon balances, Gingin, WA – Silberstein, TERN Symposium, February, 2013
- 9. The last year of above “average” (circa. 100yrs) rainfall was 1974 2400 Total Annual Rainfall at Annual Total 2200 Yearly rainfall at Jarrahdale 1911 to 1974 (ave 1251mm) Jarrahdale (mm) 2000 1975 to 2010 (ave 1042mm) 1800 1991 to 2000 (ave 1077mm) 1600 2001 to 2010 (ave 978mm) 1400 1200 1000 800 600 400 1968 1971 1974 1977 1980 1983 1986 1989 1992 1995 1998 2001 2004 2007 2010 1911 1914 1917 1920 1923 1926 1929 1932 1935 1938 1941 1944 1947 1950 1953 1956 1959 1962 1965 Note: A year is taken as May to April (Data courtesy of the Water Corporation) Water and carbon balances, Gingin, WA – Silberstein, TERN Symposium, February, 2013
- 10. Resulting in reduced inflow into Perth dams in the last 30 years 2400 Total Annual Rainfall at Annual Total 2200 Yearly rainfall at Jarrahdale 1911 to 1974 (ave 1251mm) Jarrahdale (mm) 2000 16% 1975 to 2010 (ave 1042mm) 1800 reduction 1991 to 2000 (ave 1077mm) 1600 2001 to 2010 (ave 978mm) 1400 1200 1000 800 600 400 1000 Yearly Streamflow for Major Surface Water Sources - IWSS 1968 1971 1974 1977 1980 1983 1986 1989 1992 1995 1998 2001 2004 2007 2010 1911 1914 1917 1920 1923 1926 1929 1932 1935 1938 1941 1944 1947 1950 1953 1956 1959 1962 1965 900 Annual Total 800 Note: A year is taken as May to April (Data courtesy of the Water Corporation) 1911 to 1974 av (338 GL) Total Annual Inflow to Perth 700 1975 to 2010 (ave 148GL) 600 55% 1991 to 2000 (ave 192GL) reduction 500 2001 to2010 (ave 83GL) Dams (GL) 400 300 200 100 0 1968 1971 1974 1977 1980 1983 1986 1989 1992 1995 1998 2001 2004 2007 2010 1911 1914 1917 1920 1923 1926 1929 1932 1935 1938 1941 1944 1947 1950 1953 1956 1959 1962 1965 Note: A year is taken as May to April Water and carbon balances, Gingin, WA – Silberstein, TERN Symposium, February, 2013
- 11. Local Issues • Drying forest soils, reducing stream flow periods, threatening aquatic ecosystems • South-west WA renowned for biodiversity; • Changing forest structure (thinning or thickening), ecosystem function • Coastal sandplain woodland is the major cover on the recharge area for Perth’s most important water resource; • Increased reliance on groundwater (5% to 75% from 1970 to 2010) and now 25% desalinated seawater soon to rise to 50% • Decline in aquifer storage at 50GL/yr ~ $1b NPV (based on sea-water desalination) Water and carbon balances, Gingin, WA – Silberstein, TERN Symposium, February, 2013
- 12. The Gingin site is in the recharge area 70km north of Perth CBD Flux station Water and carbon balances, Gingin, WA – Silberstein, TERN Symposium, February, 2013
- 13. The region is subject to fire and other stresses Water and carbon balances, Gingin, WA – Silberstein, TERN Symposium, February, 2013
- 14. Site selected with Noongar approval … Water and carbon balances, Gingin, WA – Silberstein, TERN Symposium, February, 2013
- 15. The site is chosen to understand the water use and carbon balance of the native bush, and (hopefully) contribute to sustainable management of Gnangara ecosystem and groundwater Area (km2) mm GL/yr Input rainfall 2194 750 1646 Land use Evaporative Water Use Native Bush 1048 600 629 Pines 225 850 200 Wetlands 12 800 10 Water and carbon balances, Gingin, WA – Silberstein, TERN Symposium, February, 2013
- 16. It has a conveniently located long-term piezometer of the Dept of Water Recharge following Wildfire, 1986 Water and carbon balances, Gingin, WA – Silberstein, TERN Symposium, February, 2013
- 17. Instruments All the usual, plus Digital cameras monitoring phenology Soil moisture: TDR to 2m, neutron probes CosmOz moisture sensor Watertable level, salinity, pH, CFCs ”Nested” piezometers Water and carbon balances, Gingin, WA – Silberstein, TERN Symposium, February, 2013
- 18. Not the SKA ... But The CosmOz uses cosmic rays for soil moisture giving average moisture content to about 80cm, over a radius of about 200m Water and carbon balances, Gingin, WA – Silberstein, TERN Symposium, February, 2013
- 19. CosmOz soil moisture 10 50 Rain TDR 9 CosmOz TDR (Top 30cm) Calibration 8 CosmOz (Top 45cm) Calibration 40 Volumetric Moisture (%) 7 Rainfall (mm) 6 30 5 4 20 3 2 10 1 0 0 May-11 Jul-11 Aug-11 Oct-11 Dec-11 Mar-12 May-12 Jul-12 Aug-12 Oct-12 Dec-12 Water and carbon balances, Gingin, WA – Silberstein, TERN Symposium, February, 2013
- 20. Water and carbon fluxes at Gingin 25 LE 20 Fa MJ/m2/day 15 10 5 0 15 Oct-11 Dec-11 Feb-12 Apr-12 Jun-12 Aug-12 10 5 Carbon 0 MJ/m2/day Oct-11 -5 Dec-11 Feb-12 Apr-12 Jun-12 Aug-12 -10 -15 -20 -25 -30 Water and carbon balances, Gingin, WA – Silberstein, TERN Symposium, February, 2013
- 21. Carbon flux vs evaporation 1600 1400 1200 Carbon flux (g/m2) 1000 Carbon vs Evap'n 800 600 400 200 0 0 100 200 300 400 500 600 700 800 Cumulative Evapotranspiration (mm) Water and carbon balances, Gingin, WA – Silberstein, TERN Symposium, February, 2013
- 22. Carbon flux vs evaporation 1600 40 1400 35 1200 30 Carbon flux (g/m2) 1000 25 Rainfall (mm) Carbon vs Evap'n Carbon vs Evap'n Daily rain 800 20 600 15 400 10 200 5 0 0 0 100 200 300 400 500 600 700 800 Cumulative Evapotranspiration (mm) Water and carbon balances, Gingin, WA – Silberstein, TERN Symposium, February, 2013
- 23. Carbon flux vs evaporation 1600 40 70 Carbon vs Evap'n 1400 Daily rain 35 60 Moisture (CosmOz) 1200 30 50 Carbon flux (g/m2) 1000 25 Rainfall (mm) Carbon vs Evap'n Carbon vs Evap'n 40 Daily rain 800 20 30 600 15 20 400 10 200 10 5 0 0 0 100 200 300 400 500 600 700 800 Cumulative Evapotranspiration (mm) Water and carbon balances, Gingin, WA – Silberstein, TERN Symposium, February, 2013
- 24. Cumulative Carbon and latent heat fluxes 500 -400 450 -350 400 -300 350 -250 300 MJ/m2 g C/m2 250 -200 Fe_wpl 200 -150 Fc_wpl 150 -100 100 -50 50 0 0 23/12/11 2/1/12 12/1/12 22/1/12 1/2/12 11/2/12 21/2/12 2/3/12 12/3/12 22/3/12 1/4/12 Water and carbon balances, Gingin, WA – Silberstein, TERN Symposium, February, 2013
- 25. Next steps: Putting this together with a model - CMRSET (Evapotranspiration Guerschman et al, 2009) 2007 2009 2008 2010 Burned area Water and carbon balances, Gingin, WA – Silberstein, TERN Symposium, February, 2013
- 26. Next steps: Putting this together with a model - Recharge (following Guerschman et al, 2009) 2007 2009 2008 2010 Burned area Water and carbon balances, Gingin, WA – Silberstein, TERN Symposium, February, 2013
- 27. Next steps: Putting this together with a model Model SLST – Tom Van Niel Water and carbon balances, Gingin, WA – Silberstein, TERN Symposium, February, 2013
- 28. Next steps: Putting this together with a model and finding what’s wrong Model SLST – Tom Van Niel Water and carbon balances, Gingin, WA – Silberstein, TERN Symposium, February, 2013
- 29. Next steps: Putting this together with a model Model SLST – Tom Van Niel Water and carbon balances, Gingin, WA – Silberstein, TERN Symposium, February, 2013
- 30. Next steps: Putting this together with a model and finding what’s wrong Model SLST – Tom Van Niel Water and carbon balances, Gingin, WA – Silberstein, TERN Symposium, February, 2013
- 31. Status: • Gnangara COSMOz running since May 2011 OzFlux station ~running since October, 2011 • What next? • Tie in with remote sensing, analyse flux data, • Test remote sensing ET algorithms • Improve estimate of recharge • Modelling recharge, evaporation and carbon flux • ... Water and carbon balances, Gingin, WA – Silberstein, TERN Symposium, February, 2013
- 32. Acknowledgements • Ray Leuning and Helen Cleugh for inspiration, leadership and advice • Peter Isaac (TERN) for data processing support • Trish Lambert, Craig Macfarlane, John Byrne, Chris Johnstone, Natalie Smart for the hard work • Dave McJannet and Aaron Hawdon for CosmOz • TERN Water and carbon balances, Gingin, WA – Silberstein, TERN Symposium, February, 2013
- 33. Do come and visit Water and carbon balances, Gingin, WA – Silberstein, TERN Symposium, February, 2013
- 34. Thank you – Any questions? CSIRO Land and Water Richard Silberstein Phone: 08 9333 6000 Email: Richard.Silberstein@csiro.au Web: http://www.csiro.au/people/Richard.Silberstein.html Contact Us Phone: 1300 363 400 or +61 3 9545 2176 Email: enquiries@csiro.au Web: www.csiro.au Water and carbon balances, Gingin, WA – Silberstein, TERN Symposium, February, 2013