Global Value Equity Portfolio (March 2011)
•
1 recomendación•488 vistas

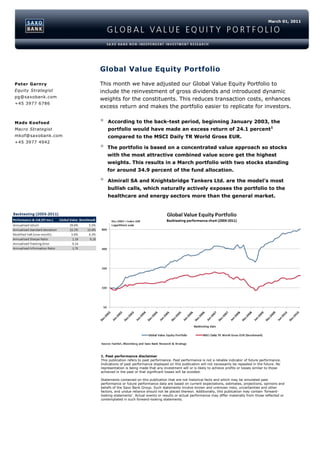
This month we have adjusted our Global Value Equity Portfolio to include the reinvestment of gross dividends and introduced dynamic weights for the constituents. This reduces transaction costs, enhances excess return and makes the portfolio easier to replicate for investors.

Recomendados
Más contenido relacionado
La actualidad más candente
La actualidad más candente (19)
Destacado
Destacado (14)
Similar a Global Value Equity Portfolio (March 2011)
Similar a Global Value Equity Portfolio (March 2011) (20)
Más de Trading Floor
Más de Trading Floor (20)
Global Value Equity Portfolio (March 2011)
- 1. March 01, 2011 Global Value Equity Portfolio Peter Garnry This month we have adjusted our Global Value Equity Portfolio to Equity Strategist include the reinvestment of gross dividends and introduced dynamic pg@saxobank.com weights for the constituents. This reduces transaction costs, enhances +45 3977 6786 excess return and makes the portfolio easier to replicate for investors. Mads Koefoed According to the back-test period, beginning January 2003, the Macro Strategist portfolio would have made an excess return of 24.1 percent1 mkof@saxobank.com compared to the MSCI Daily TR World Gross EUR. +45 3977 4942 The portfolio is based on a concentrated value approach so stocks with the most attractive combined value score get the highest weights. This results in a March portfolio with two stocks standing for around 34.9 percent of the fund allocation. Almirall SA and Knightsbridge Tankers Ltd. are the model’s most bullish calls, which naturally actively exposes the portfolio to the healthcare and energy sectors more than the general market. 1. Past performance disclaimer This publication refers to past performance. Past performance is not a reliable indicator of future performance. Indications of past performance displayed on this publication will not necessarily be repeated in the future. No representation is being made that any investment will or is likely to achieve profits or losses similar to those achieved in the past or that significant losses will be avoided. Statements contained on this publication that are not historical facts and which may be simulated past performance or future performance data are based on current expectations, estimates, projections, opinions and beliefs of the Saxo Bank Group. Such statements involve known and unknown risks, uncertainties and other factors, and undue reliance should not be placed thereon. Additionally, this publication may contain 'forward- looking statements'. Actual events or results or actual performance may differ materially from those reflected or contemplated in such forward-looking statements.
- 2. March 01, 2011 Global Value Equity Portfolio – March 2011 The table below details the March portfolio and allocations, concentrated around heavy positions in Almirall and Knightsbridge Tankers Ltd. - a combined weight of 34.9 percent. The March portfolio has heavy exposure to the healthcare and energy sectors with a combined exposure of 48 percent. In terms of currency, the portfolio has USD and EUR exposures of 45 percent and 34 percent respectively. 2
- 3. March 01, 2011 Portfolio basics Value creates excess risk-adjusted return. Our portfolio would have produced 24 percent excess annualised return in the back-testing period (2003-2011)1; the annual return was 29.6 percent annualised compared to 5.5 percent annualised return for our benchmark, the MSCI Daily TR World Gross EUR. Stocks are selected from a combined value and quality score. This equity portfolio is based on a classical value criteria mixed with a quality indicator based on a Piotroski score. From this approach each stock from our screening is gets a combined score that returns a ranked list of the stocks from our screening. A global portfolio without constraints. Our equity portfolio has no constraints in terms of exposure restrictions towards geography or sectors. The portfolio seeks to exploit value opportunities wherever they are located in the world. We have found during back-testing that the additional risk taken by this approach is sufficiently offset by the extra return received. The portfolio has dynamic weights. The portfolio is based on dynamic weights that roll over from month to month. So, if a stock had a 15 percent weight to start the month then its ending weight would be determined by the stock’s return and the other stocks’ returns, assuming the stock remains among the 15 most undervalued stocks in the next month. If several stocks leave the portfolio, the combined weights of the stocks leaving the portfolio in a given month are distributed among the new stocks coming based on a proprietary scaling technique linked to the new stocks’ combined value and quality scores relatively to each other. The portfolio is not hedged to offset movements in the currency markets. If an investor wants to reduce the impact on returns from currency fluctuations they should hedge all currency exposure to the account’s currency denomination on a monthly basis using the currency exposure pie chart that can found in the publication. The portfolio’s returns are calculated on a gross basis (i.e., not including transaction cost and taxes), but it does include the reinvestment of dividends on the ex-date. Returns are gross because the model cannot account for taxes that may vary between investors due to different tax treatments on dividends and capital gains for their tax jurisdiction. Transaction costs may vary between different brokers and, indeed, between clients. Historically the portfolio has had three stocks going in and out, on average, each month, creating six transactions. These would approximately correspond to between 0.3-0.6 percent annually transaction costs of the portfolio’s value depending on the commission terms. The updated portfolio. The Global Value Equity Portfolio portfolio is an update of the original portfolio released in September 2010. In continued testing it was found that by changing the parameter settings and use dynamic weights scaled by the combined score we could receive a better risk adjusted return. Further, we now have monthly holding periods creating a composite index. 1 This publication refers to past performance. Past performance is not a reliable indicator of future performance. Indications of past performance displayed on this publication will not necessarily be repeated in the future. No representation is being made that any investment will or is likely to achieve profits or losses similar to those achieved in the past or that significant losses will be avoided. Statements contained on this publication that are not historical facts and which may be simulated past performance or future performance data are based on current expectations, estimates, projections, opinions and beliefs of the Saxo Bank Group. Such statements involve known and unknown risks, uncertainties and other factors, and undue reliance should not be placed thereon. Additionally, this publication may contain 'forward-looking statements'. Actual events or results or actual performance may differ materially from those reflected or contemplated in such forward-looking statements. 3
- 4. March 01, 2011 Research methodology The Global Value Equity Portfolio is designed to address the classic challenge in equity portfolio research: how to produce excess return given a benchmark index. The aim, therefore, is to create a portfolio that generates a positive Sharpe Ratio indicating the portfolio produced excess return over the risk-free rate for each unit of risk taken. According to the existing literature in the field it is possible, using various value criteria, to create a portfolio that outperforms the chosen benchmark index on a risk-adjusted basis. Studies such as Fama and French (1992), Lakonishok, Shleifer and Vishny (1994) and Piotroski (2002)2 document that significant excess return is possible for high book-to-market portfolios (that is a portfolio with a low price-to-book ratio). Following this line of research our portfolio uses Benjamin Graham deep value criteria (published by Rea in a Journal of Portfolio Management article from 1977)3, amongst other criteria, such as: a trailing earnings yield (more specifically CAPE4) greater than twice the corporate bond yield, a dividend yield at least equal to two-thirds of the corporate AAA bond yield5 and a low debt-to-equity ratio. The Global Value Equity Portfolio is constructed using a bottom-up approach which de- emphasises the significance of economic and market cycles. On this basis, the portfolio will be fully-invested at all times. One of the consequences of being invested at all times is downward pressure on the portfolio’s alpha while creating a higher beta. The latter argument is not that intuitive because value stocks are typically perceived as producing stable returns (low beta and positive alpha). Note, higher price volatility does not necessarily mean higher risk (as in underlying business risk). Our hypothesis is the portfolio will compensate on a risk-adjusted basis for our risk- taking in these combined value and quality companies. Our monthly stock sample is selected according to our search criteria and the universe is selected from the cash equities available to trade on the Saxo Bank trading platforms6. We also limit the universe to primary issues (listings), but include inactive stocks to ensure the population does not include survivorship bias from excluding bankruptcies, mergers and delisting etc. The difference between active and inactive population of stocks is 19,490 and 37,301 irrespectively. Our research design is based on a few screening criteria such as 60-days average daily trading volume, cyclical adjusted price earnings (CAPE), dividend yield and interest- bearing debt over equity. To generate a portfolio with medium-to-low business and liquidity risk only stocks with 60-days average daily trading volume above EUR 1.0 million are permitted. The CAPE 5-year parameter is set to range between 0-50. The dividend yield should at least equal half the corporate AAA bond yield. Interest-bearing debt should be less than two-thirds of equity excluding highly leverage companies. The first iteration of the portfolio was built on a trailing earnings (CAPE 7-year) yield greater than twice the corporate AAA bond yield. However, this limited our sample too much (sometimes only five stocks passed our screening in a single month). Thus we 2 Eugene F. Fama and Kenneth R. French (1992), The Cross-Section of Expected Returns, The Journal of Finance, vol. XLVII, no. 2, pp. 427-465; Josef Lakonishok, Andrei Shleifer and Robert W. Vishny (1994), Contrarian Investment, Extrapolation, and Risk, The Journal of Finance, vol. 49, no. 5, pp. 1541-1578; Joseph D. Piotroski (2002), Value Investing: The Use of Historical Financial Statement Information to Separate Winners from Losers, The University of Chigago School of Business. 3 James B. Rea (1977), Remembering Benjamin Graham – Teacher and Friend, Journal of Portfolio Management, vol. 3, no. 4, pp. 66-72. 4 CAPE is the current market price divided with a chosen period of earnings per share (EPS) and the concept was first published and used by Benjamin Graham and David Dodd in their book Security Analysis (1934). They emphasised using no less than five years of annual EPS. The concept is based on adjusting the EPS for cyclical upward or downward extremes (smoothing out the earnings pattern). Through our iterative research we observed that our mix of value criteria produced a too narrow a sample to conduct a diversified portfolio in some early observation (particularly in 2005). From a sensitivity analysis of our parameters the CAPE parameter came out as the most sensitive. On this basis we concluded to change our CAPE parameter from originally CAPE 7 yr. (current market price divided with the latest seven years of annual EPS) to CAPE 5 yr. We will use CAPE and CAPE 5 yr. interchangeably in this publication. 5 Please note that later in the description of our screening criteria, we use half the corporate AAA bond yield. The reason for this is due because the original criteria from Rea limits our sample size from the screening to much. 6 See appendix for the stock exchanges on which Saxo Bank facilitates cash equity trading. 4
- 5. March 01, 2011 changed the parameter to CAPE 5-year ranging from 0-50 to increase the monthly sample. The problem presented was that a relatively high stable corporate AAA bond yields around five percent, which in return equals an earnings yield of at least 10 percent. For this to be met CAPE 7-year would have to be below 10, which is virtually impossible to obtain for long periods in the equity market – we would not be able to be invested at all times in the equity market. Back-testing methodology We set the last day of the prior month as our back-testing date. For example when back- testing January 2006 we use the back-testing date of 31 December 2005. Each monthly screening provides the stocks that pass our criteria and returns all relevant parameter data. The start back- test date is set at 31 December 2002, which means that the portfolio’s beginning date is 1 January 2003. This provides us with 97 monthly return observations which are sufficient enough to generate valid statistical analyses such as beta, alpha, Sharpe Ratio and Information Ratio. In order to avoid having look-ahead bias in our portfolio we use lagging arguments on all relevant parameters in the portfolio. Our data provider does not have a point-in-time database on fundamental data, meaning that if our back-testing date is 31 January 2006 and we look back on the last annual report data, we receive annual report data from 2005 instead of 2004 despite the information first being available to the public in February or March 2005. By implementing three month lagging arguments on all relevant parameters, we avoid having look-ahead bias in our portfolio. Each month the screening output is analysed and the stocks are ranked based on a weighted average of separate rankings for Piotroski score, CAPE and P/B. We name it combined score. The 15 stocks with the lowest combined score (most attractive valuation and Piotroski score) are selected as the forthcoming month’s portfolio. We calculate the portfolio’s weighted return for that month based on the monthly price EUR adjusted return. The portfolio is rebalanced every month, thus the holding period is dynamic in the sense that a stock will be re-elected to our portfolio if it still is among the 15 most promising stocks in terms of valuation and Piotroski score. A stock that increases far more in price relative to other value stocks will probably have a short holding period. If the potential price appreciation has not materialised yet the stock will usually remain in the portfolio. In back-testing, our portfolio would have produced an annualised gross return, including the reinvestment of gross dividends ex-date, but before transaction costs (see comment under portfolio basics) and taxes of 29.6 percent compared to 5.5 percent for MSCI Daily TR World Gross EUR. Even though our weighted holding period is shorter compared to the normal value philosophy the total return compensates for the additional costs related to our monthly rebalancing. Our portfolio produced excess return over the MSCI Daily TR World Gross EUR in 68 out of 97 months. This corresponds to around 70.1 percent positive excess return observations throughout the back-testing period. We calculate the Sharpe Ratio, Tracking Error, Information Ratio and correlation based on monthly return observations for the portfolio and MSCI Daily TR World Gross EUR. We use the Bloomberg/EFFAS Bond Indices Euro Govt 1-3 Yr TR as our risk-free rate. The portfolio performed well over the back-testing period with a positive annualised Sharpe Ratio of 1.16 compared to 0.16 for the benchmark indicating that our model produces attractive risk adjusted returns. The Information Ratio is correspondingly showing exceptional attractive returns over the risk taken with 1.75 for the portfolio in the back-testing period. The correlation between monthly return of the portfolio and MSCI Daily TR World Gross EUR was 80.5 percent. In order to gauge the risk profile of the portfolio we have calculated a one-month modified Value-at-Risk (VaR) with 95 percent significance level on the Global Value Equity Portfolio and MSCI Daily TR World Gross EUR respectively. The modified VaR is -5.56 percent and -6.29 percent for the portfolio and benchmark respectively. This implies that there is 5 5
- 6. March 01, 2011 percent probability that our portfolio will lose more than 5.56 percent in a single month compared to 6.29 percent for MSCI Daily TR World Gross EUR. We calculate a modified VaR7 to take into account that the portfolio’s returns do not follow a normal distribution. The portfolio’s return distribution over the back-testing period had a positive skewness and excess kurtosis. Our portfolio has a positive skewness of 0.74 indicating that the return distribution has an asymmetric tail extending towards more positive values. Our portfolio has an excess kurtosis of 8.26 which means that the returns follow a leptokurtic distribution (more peaked values). Our portfolio’s kurtosis lies above two standard deviations indicating that our portfolio has significantly peaked return distribution which point towards it having fat tails (higher probabilities of larger positive and negative monthly returns). Thus we should expect large positive as well as negative returns. Historical data also suggests the maximum monthly return since the beginning of 2003 has been 35.8 percent for the portfolio compared to 11.5 percent for MSCI Daily TR World Gross EUR8. As for minimum monthly return, the Global Value Equity Portfolio experienced a negative 19.7 percent compared to a negative 10.2 percent for the MSCI Daily TR World Gross EUR. 7 The limitations of mean Value-at-Risk are well covered in the literature. The limitations of traditional mean-VaR are all related to the use of a symetrical distribution function. Use of simulations, resampling, or Pareto distributions all help in making a more accurate prediction, but they are still flawed for assets with significantly non-normal (skewed or kurtotic) distributions. Zangari (1996) and Favre and Galeano(2002) provide a modified VaR calculation that takes the higher moments of non-normal distributions (skewness, kurtosis) into account through the use of a Cornish Fisher expansion, and collapses to standard (traditional) mean-VaR if the return stream follows a standard distribution. This measure is now widely cited and used in the literature, and is usually referred to as “Modified VaR” or “Modified Cornish-Fisher VaR”. 8 This publication refers to past performance. Past performance is not a reliable indicator of future performance. Indications of past performance displayed on this publication will not necessarily be repeated in the future. No representation is being made that any investment will or is likely to achieve profits or losses similar to those achieved in the past or that significant losses will be avoided. Statements contained on this publication that are not historical facts and which may be simulated past performance or future performance data are based on current expectations, estimates, projections, opinions and beliefs of the Saxo Bank Group. Such statements involve known and unknown risks, uncertainties and other factors, and undue reliance should not be placed thereon. Additionally, this publication may contain 'forward-looking statements'. Actual events or results or actual performance may differ materially from those reflected or contemplated in such forward-looking statements. 6
- 7. March 01, 2011 Appendix - stock exchanges available for trading (cash equity) American Stock Exchange Euronext Amsterdam Australian Stock Exchange Ltd. Euronext Brussels OMX Copenhagen OMX Copenhagen – First North Hong Kong Stock Exchange OMX Helsinki Euronext Lisbon London International Exchange London Stock Exchange SEAQ Market London Stock Exchange SETS Market Milano Stock Exchange NASDAQ Global Markets NASDAQ Capital Markets New York Stock Exchange NYSE ARCA Oslo Stock Exchange OTC Bulletin Board on NASDAQ Euronext Paris Singapore Exchange Securities Trading Limited Sistema De Interconexion Bursatil Espanol OMX Stockholm OMX Stockholm – First North Swiss Exchange Wiener Börse (Vienna) Stock Exchange SWX Europe 7
- 8. March 01, 2011 NON-INDEPENDENT INVESTMENT RESEARCH This investment research has not been prepared in accordance with legal requirements designed to promote the independence of investment research. Further it is not subject to any prohibition on dealing ahead of the dissemination of investment research. Saxo Bank, its affiliates or staff, may perform services for, solicit business from, hold long or short positions in, or otherwise be interested in the investments (including derivatives), of any issuer mentioned herein. None of the information contained herein constitutes an offer (or solicitation of an offer) to buy or sell any currency, product or financial instrument, to make any investment, or to participate in any particular trading strategy. This material is produced for marketing and/or informational purposes only and Saxo Bank A/S and its owners, subsidiaries and affiliates whether acting directly or through branch offices (“Saxo Bank”) make no representation or warranty, and assume no liability, for the accuracy or completeness of the information provided herein. In providing this material Saxo Bank has not taken into account any particular recipient’s investment objectives, special investment goals, financial situation, and specific needs and demands and nothing herein is intended as a recommendation for any recipient to invest or divest in a particular manner and Saxo Bank assumes no liability for any recipient sustaining a loss from trading in accordance with a perceived recommendation. All investments entail a risk and may result in both profits and losses. In particular investments in leveraged products, such as but not limited to foreign exchange, derivates and commodities can be very speculative and profits and losses may fluctuate both violently and rapidly. Speculative trading is not suitable for all investors and all recipients should carefully consider their financial situation and consult financial advisor(s) in order to understand the risks involved and ensure the suitability of their situation prior to making any investment, divestment or entering into any transaction. Any mentioning herein, if any, of any risk may not be, and should not be considered to be, neither a comprehensive disclosure or risks nor a comprehensive description such risks. Any expression of opinion may be personal to the author and may not reflect the opinion of Saxo Bank and all expressions of opinion are subject to change without notice (neither prior nor subsequent). This publication refers to past performance. Past performance is not a reliable indicator of future performance. Indications of past performance displayed on this publication will not necessarily be repeated in the future. No representation is being made that any investment will or is likely to achieve profits or losses similar to those achieved in the past, or that significant losses will be avoided. Statements contained on this publication that are not historical facts and which may be simulated past performance or future performance data are based on current expectations, estimates, projections, opinions and beliefs of the Saxo Bank Group. Such statements involve known and unknown risks, uncertainties and other factors, and undue reliance should not be placed thereon. Additionally, this publication may contain 'forward-looking statements'. Actual events or results or actual performance may differ materially from those reflected or contemplated in such forward-looking statements. This material is confidential and should not be copied, distributed, published or reproduced in whole or in part or disclosed by recipients to any other person. Any information or opinions in this material are not intended for distribution to, or use by, any person in any jurisdiction or country where such distribution or use would be lawful. The information in this document is not directed at or intended for “US Persons” within the meaning of the United States Securities Act of 1993, as amended and the United States Securities Exchange Act of 1934, as amended. The Saxo Bank Group is under the supervision of the Danish Financial Supervisory Authority (In Danish: "Finanstilsynet") and is subject to the Danish Executive Order on Good Business Practice for Financial Undertakings. Saxo Bank A/S Philip Heymans Allé 15 2900 Hellerup Denmark Phone: +45 39 77 40 00 Reg. No. 1149 CVR. No. 15731249 This disclaimer is subject to Saxo Bank's Full Disclaimer available at www.saxobank.com/disclaimer. 8