Plot3D package in R-package-for-3d-and-4d-graph-Data visualization.
•Descargar como DOCX, PDF•
0 recomendaciones•800 vistas

This document provides examples of using the Plot3D package in R to create 3D plots and visualizations. It includes examples of plotting 3D text labels, histograms, arrows, scatter plots and adding regression planes to visualize relationships between variables in 3D space. Functions demonstrated include text3D(), hist3D(), arrows3D(), and scatter3D(). Real data sets like iris and mtcars are used for illustrative examples.

Recomendados
Más contenido relacionado
Destacado
Destacado (18)
Similar a Plot3D package in R-package-for-3d-and-4d-graph-Data visualization.
Similar a Plot3D package in R-package-for-3d-and-4d-graph-Data visualization. (20)
Más de Dr. Volkan OBAN
Más de Dr. Volkan OBAN (20)
Último
Último (20)
Plot3D package in R-package-for-3d-and-4d-graph-Data visualization.
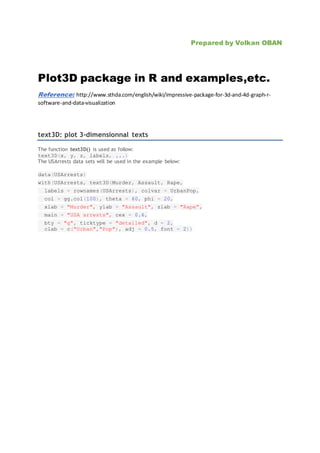
- 1. Prepared by Volkan OBAN Plot3D package in R and examples,etc. Reference: http://www.sthda.com/english/wiki/impressive-package-for-3d-and-4d-graph-r- software-and-data-visualization text3D: plot 3-dimensionnal texts The function text3D() is used as follow: text3D(x, y, z, labels, ...) The USArrests data sets will be used in the example below: data(USArrests) with(USArrests, text3D(Murder, Assault, Rape, labels = rownames(USArrests), colvar = UrbanPop, col = gg.col(100), theta = 60, phi = 20, xlab = "Murder", ylab = "Assault", zlab = "Rape", main = "USA arrests", cex = 0.6, bty = "g", ticktype = "detailed", d = 2, clab = c("Urban","Pop"), adj = 0.5, font = 2))
- 3. # Plot texts with(USArrests, text3D(Murder, Assault, Rape, labels = rownames(USArrests), colvar = UrbanPop, col = gg.col(100), theta = 60, phi = 20, xlab = "Murder", ylab = "Assault", zlab = "Rape", main = "USA arrests", cex = 0.6, bty = "g", ticktype = "detailed", d = 2, clab = c("Urban","Pop"), adj = 0.5, font = 2)) # Add points with(USArrests, scatter3D(Murder, Assault, Rape - 1, colvar = UrbanPop, col = gg.col(100), type = "h", pch = ".", add = TRUE)) plotdev(xlim = c(0, 10), ylim = c(40, 150), zlim = c(7, 25))
- 4. Histogram3D data(VADeaths) # hist3D and ribbon3D with greyish background, rotated, rescaled,... hist3D(z = VADeaths, scale = FALSE, expand = 0.01, bty = "g", phi = 20, col = "#0072B2", border = "black", shade = 0.2, ltheta = 90, space = 0.3, ticktype = "detailed", d = 2)
- 5. hist3D (x = 1:5, y = 1:4, z = VADeaths, bty = "g", phi = 20, theta = -60, xlab = "", ylab = "", zlab = "", main = "VADeaths", col = "#0072B2", border = "black", shade = 0.8, ticktype = "detailed", space = 0.15, d = 2, cex.axis = 1e-9) # Use text3D to label x axis text3D(x = 1:5, y = rep(0.5, 5), z = rep(3, 5), labels = rownames(VADeaths), add = TRUE, adj = 0) # Use text3D to label yaxis text3D(x = rep(1, 4), y = 1:4, z = rep(0, 4), labels = colnames(VADeaths), add = TRUE, adj = 1)
- 9. Example: x0 <- c(0, 0, 0, 0) > y0 <- c(0, 0, 0, 0) > z0 <- c(0, 0, 0, 0) > x1 <- c(0.89, -0.46, 0.99, 0.96) > y1 <- c(0.36, 0.88, 0.02, 0.06) > z1 <- c(-0.28, 0.09, 0.05, 0.24) > cols <- c("#1B9E77", "#D95F02", "#7570B3", "#E7298A") > arrows3D(x0, y0, z0, x1, y1, z1, colvar = x1^2, col = cols, + lwd = 2, d = 3, clab = c("Quality", "score"), + main = "Arrows 3D", bty ="g", ticktype = "detailed") > # Add starting point of arrow > points3D(x0, y0, z0, add = TRUE, col="darkred", + colkey = FALSE, pch = 19, cex = 1) > # Add labels to the arrows > text3D(x1, y1, z1, c("Sepal.L", "Sepal.W", "Petal.L", "Petal.W"), + colvar = x1^2, col = cols, add=TRUE, colkey = FALSE)
- 10. EXAMPLE: data(iris) x <- iris$Sepal.Length y <- iris$Petal.Length z <- iris$Sepal.Width scatter3D(x, y, z, pch = 18, bty = "u", colkey = FALSE, + main ="bty= 'u'", col.panel ="steelblue", expand =0.4, + col.grid = "darkblue")
- 12. > scatter3D(x, y, z, bty = "g", pch = 18, col = gg.col(100)) > # ramp.col: custom palettes > scatter3D(x, y, z, bty = "g", pch = 18, + col = ramp.col(c("blue", "yellow", "red")) )
- 13. > scatter3D(x, y, z, phi = 0, bty = "g", + pch = 20, cex = 2, ticktype = "detailed")
- 14. scatter3D(x, y, z, phi = 0, bty = "g", type = "l", ticktype = "detailed", lwd = 4)
- 15. scatter3D(x, y, z, phi = 0, bty = "g", type = "h", + ticktype = "detailed", pch = 19, cex = 0.5)
- 16. > x <- mtcars$wt > y <- mtcars$disp > z <- mtcars$mpg > # Compute the linear regression (z = ax + by + d) > fit <- lm(z ~ x + y) > # predict values on regular xy grid > grid.lines = 26 > x.pred <- seq(min(x), max(x), length.out = grid.lines) > y.pred <- seq(min(y), max(y), length.out = grid.lines) > xy <- expand.grid( x = x.pred, y = y.pred) > z.pred <- matrix(predict(fit, newdata = xy), + nrow = grid.lines, ncol = grid.lines) > # fitted points for droplines to surface > fitpoints <- predict(fit) > # scatter plot with regression plane > scatter3D(x, y, z, pch = 18, cex = 2, + theta = 20, phi = 20, ticktype = "detailed", + xlab = "wt", ylab = "disp", zlab = "mpg", + surf = list(x = x.pred, y = y.pred, z = z.pred, + facets = NA, fit = fitpoints), main = "mtcars")