SlideShare a Scribd company logo
1 of 53
Download to read offline
THE REPUBLIC OF UGANDA
Ministry of Lands, Housing and Urban Development
BUKOMERO TOWN COUNCIL URBAN INDICATORS REPORT
PREPARED BY:
INTERNSHIP STUDENTS
KYAMBOGO UNIVERSITY
June/2014
i
Foreword
I am pleased to present this report for the internship students Mr Wesigye Alex, Kakande
Fred, Kulumba Brian, Kaweesi Samuel and Kemba Joseph from Kyambogo University. As
part of their internship, the students were given an opportunity to collect urban
indicators relating to various urban areas, to create the urban Indicators data base, to
analyze and prepare a status report for one of the Town Councils. They carried out their
internship from 17th
June to 25th
July 2014.
Due to the limited time, the students could not go to the field to collect the indicators
from each Urban Council. Instead they contacted all the Town Clerks for their email
addresses after which the soft copy of the Urban Indicators Toolkit was sent to them for
filling in with the necessary information. The Town Clerks were requested to assign one
of their staff preferably the Physical Planner, to coordinate the exercise in their respective
Urban Councils. They were given two weeks within which to submit the completed
toolkit. It was noted however, that only twenty Urban Councils were able to return the
completed Toolkits within the allotted time frame. The Students then checked the
returns for completeness and verified the information that was provided by the Urban
Councils. Thereafter, they created a database of the indicators for the twenty Urban
Councils using Microsoft Excel. However, considering that the records were minimal and
some of them lacked certain information, the students were advised to concentrate on
one Urban Council whose return was fully completed compared to others. And this was
Bukomero Town Council (BTC).
The Students were guided in the preparation of the status report for Bukomero Town
Council. The report was intended to present baseline indicators as at 2014 for purposes of
comparison in future to measure the extent of change whether positive or negative. The
Report is a joint effort by all the Students who shared out specific thematic areas to
analyze and interpret the findings. They were also encouraged to refer to other secondary
data sources to enrich their analysis. The report gives a profile of Bukomero Town
Council which can serve as reference document to many parties who may be interested in
ii
investing in Bukomero. It also provides a basis for planning, priority setting and
budgeting. It is hoped that annually the indicators will be compiled for purposes of
monitoring the performance and evaluating the impact of policy decision adopted by the
Council.
The report is structured in three Chapters: the first Chapter covers the background and
introduction which presents the location, the population, natural hazards while Chapter
two presents analysis of findings on Land use, Land Tenure types and Demography and
Chapter 3 outlines the recommendations and conclusions.
I am glad to report that despite the limited time within which the exercise was
undertaken, the students managed to get feedback from the Urban Councils, which
enabled them to demonstrate the technical skills in data collection, analysis and
reporting. I believe that this report will be helpful to inform the planning process in
Bukomero Town Council.
I wish to extend my gratitude to the supervisors of the students, and the officers in the
Department of Urban Development for all the assistance provided to the team.
Samuel Mabala
Commissioner-Urban Development
iii
Acknowledgement
We give thanks to the LORD JESUS CHRIST of Nazareth our GOD, LORD and SAVIOR
for HIS wisdom, knowledge, understanding, insight and finances among others that HE
has graciously given us throughout the production of this report.
We wish to extend our sincere gratitude to the Commissioner for Urban Development
(CUD), Mr. Mabala Samuel for his mentorship, guidance and supervision throughout the
process of compiling this report.
To our supervisor Ms. Nakiguli Devine Kibuuka for her unfailing love and support
towards our internship training and compilation of this report
And not forgetting Sande Goden and all the staff members of Urban Development
MLHUD for being good, approachable and giving us a conducive Learning environment.
No words can fully express how grateful we are. May the almighty GOD give you
abundant blessings.
iv
List of Acronyms
MLHUD Ministry of Lands, Housing and Urban Development
CUD Commissioner of Urban Development
UD Urban Development
BTC Bukomero Town Council
TC Town Council
MS Microsoft Office
UBOS Uganda Bureau of Statistics
v
Definition of key terms
Household A person of group of persons who make common provision for food or
other essentials of living, and often share a common budget.
Land use Residential formal Includes land zoned residential or occupied by formal
housing.
Residential
informal
Includes land occupied by any informal or unplanned
settlements.
Business Refers to all commercial or industrial land, including
land used largely for informal business activity.
Services Refers to land used for government buildings, school,
hospitals, electricity, water and other public
amenities excluding transport
Vacant Includes all land designated for development but not
used for any particular purpose
Other Includes all recreational or water areas normally
counted as part of the city.
Household
tenure
Formal ownership Owned refers to households with a clear title or
ownership(formal housing) of the house and the land
they occupy, possibly through a company structure or
as condominiums or strata title, or long leasehold of
land.
Purchasing refer to owner-occupiers in formal
housing with a formal mortgage over the property.
Tenancy Private rental is households in informal housing for
with rents are paid to a private landlord who is the
legal owner.
Social housing includes all households in public,
parastatal or NGO-owned or operated housing,
including government employee housing and housing
owned or operated by co-operatives.
Sub-tenancy refers to households who are renting
from household who is also renting the premises.
Squatter Squatter-without rent refers to households in
squatter housing, or housing which has no title to the
land on which it stands, and who pay no rent.
Squatter-with rent refers to households in squatter
who pay rent.
Other Includes nomads, homeless, persons in institutions or
hotels and any other tenure.
vi
Land
tenure
Public Refers to land which is owned by the government,
used or not used for public purposes
Private Refers to the exclusive possession of land by an
individual or restricted group of people of the same
family (couple, nuclear family, inheriting brothers
and sisters, et.c)
Other Refers to all other types of land rights such as
customary rights et.c.
Sources of
income
Taxes Include municipal rates and levies, any local taxes on
the transfer of property, and any other taxes such as
entertainment or hotel taxes, motor vehicle taxes, and
on business, which do not reflect the direct provision
of services.
User- charges Include any local government charges for services
provided, such as water, sewerage, refuse collection
or building permits. Betterment levies should also be
included.
Other-own source
income
Includes interest and principal received, sales of
capital items, (but not donations, voluntary
contributions or aid).
Transfers Include formula driven payments (such as
repatriation of income tax) or other grant donations
from national or state governments.
Other income Includes any other income such as donations or aid.
Housing
production
Defined as the net number of units produced (units produced minus units
demolished) last year in both formal and informal sectors per 1000
population.
vii
Executive Summary
Ministry of Lands, Housing and Urban Development has been spearheading the
development of the National Urban Policy and Strategic Urban Development Investment
Plan. It also created an Urban Indicators database in the process of developing the
National Urban Policy for Uganda aimed at monitoring the performance of the urban
Sector.
The Ministry intended and still intends to update the urban indicators database to cover
all the Municipalities, and Town Councils with current information about the key
indicators. The indicators are necessary for:
1. Monitoring of performance of the respective urban authorities.
2. Establishment of the baseline status for purposes of local and international
comparison.
3. Identification of good practices as well as key issues for policy intervention.
4. Selection of priority programmes and projects.
5. Review of progress towards achieving specific goals.
6. Assessment of impact of programs, projects and key policy interventions and
above all
7. Development of the Urban Development Strategies.
For this cause the Ministry sent out tool kits to about 174 town councils which they were
to fill and send back (via electronic means) the completed forms. To our surprise only 11
complied. Not only, did the filled forms come late but also most of them were partially
filled. For this reason the Commissioner, having looked at the data set, changed plan and
decided on working on one town, whose data form had lesser spaces as compared to the
rest and that town is Bukomero Town Council to work as a model town under this
exercise.
This report is generated based on the analysis of Bukomero Town Council data, which is
located in Kiboga district in Uganda. The objectives of the study were to update the
viii
National Urban Indicators Data Base and to prepare the state of the Urban Sector Report
for Uganda 2014 specifically Bukomero T.C.
A Tool kit was sent to the Bukomero Town Clerk who filled it and sent back the filled
form to the Ministry which data was then put in a data base analyzed. The data was
entered and analyzed in MS Excel.
The limitations in the entire process included delay in the receipt of feedback from the
Town Council, empty fields and unrealistic responses in the sent back tool kits among
others as indicated in Chapter one.
The analysis of findings was done for demographic features, household incomes, land
use, socio-economic development, health, education, infrastructure, transport,
environment, crime and safety, local government, and housing indicators. Out put were
presented in form of tables and charts as shown in chapter two.
The recommendations include sensitization of Town Council officers on the essence of
updating urban indicators database prior to data collection and adoption of methods
which yield quicker feedbacks from respondents like sending urban officers to the field
among others.
ix
Table of Contents
Foreword.................................................................................................................................................i
Acknowledgement................................................................................................................................ iii
List of Acronyms................................................................................................................................... iv
Definition of key terms ......................................................................................................................... v
Executive Summary............................................................................................................................. vii
List of Tables........................................................................................................................................ xii
List of figures.......................................................................................................................................xiii
CHAPTER ONE.....................................................................................................................................1
1.0 Background Information .................................................................................................................1
1.1 Location.............................................................................................................................................1
1.2 Natural Hazards ...............................................................................................................................1
1.3 Weather ............................................................................................................................................2
1.4 Nature...............................................................................................................................................2
1.5 Objectives of the study.....................................................................................................................2
1.6 Team Composition...........................................................................................................................2
1.7 Methodology.....................................................................................................................................3
1.8 Limitations .......................................................................................................................................3
CHAPTER TWO....................................................................................................................................4
2.0 Analysis of the Findings ..................................................................................................................4
2.1 Land use............................................................................................................................................4
2.2 Demography ....................................................................................................................................5
2.2.1 Population by sex ..........................................................................................................................5
2.2.2 Population by age group in Bukomero TC ..................................................................................6
2.2.3 Annual Population growth rate....................................................................................................7
2.3 Household........................................................................................................................................8
2.3.1 Household size ..............................................................................................................................8
2.3.2 Women headed household...........................................................................................................9
2.3.3 Household formation rate ............................................................................................................9
2.4 Household income distribution....................................................................................................10
2.5 Land tenure types ..........................................................................................................................11
2.5.1 Household tenure........................................................................................................................11
2.5.2 Total Land tenure .......................................................................................................................12
2.6 Social- economic Development ....................................................................................................12
2.6.1 Poor household ...........................................................................................................................12
2.7.0 Health sector...............................................................................................................................13
2.7.1 Hospital beds...............................................................................................................................13
2.8.0 Child mortality ...........................................................................................................................14
2.8.1 Child mortality ............................................................................................................................14
2.8.2 Life expectancy ...........................................................................................................................14
x
2.9.0 Education....................................................................................................................................15
2.9.1 Adult literacy...............................................................................................................................15
2.9.2 School enrollment ......................................................................................................................16
2.10 Crime and safety...........................................................................................................................17
2.11.0 Infrastructure .............................................................................................................................17
2.11.1 Household connection................................................................................................................17
2. 11.2 Access to portable water ...........................................................................................................18
2.11.3 Infrastructure expenditure.........................................................................................................19
2.12.0 Transport ...................................................................................................................................20
2.12.1 Modal split..................................................................................................................................20
2.12.2 Travel time, Expenditure on road infrastructure and Automobile ownership.......................21
2.12.3 Length of road............................................................................................................................22
2.13.0 Environment..............................................................................................................................22
2.13.1 Waste water treated ...................................................................................................................22
2.14.1 Solid waste generated. ...............................................................................................................22
2.13.3 Disposal method for solid waste ...............................................................................................23
2.14.2 Regular solid-waste collection and the housing destroyed by disasters.................................24
2.15.0 Local government......................................................................................................................25
2.15.1 Source of income........................................................................................................................25
2.15.2 Local government per capita income .......................................................................................26
2.15.3 Per capita capital expenditure...................................................................................................27
2.16 Housing in compliance................................................................................................................27
CHAPTER THREE...............................................................................................................................29
3.0 CONCLUSIONS AND RECCOMENDATIONS ............................................................................29
3.1.1 Land use........................................................................................................................................29
3.1.2 Population by sex.........................................................................................................................29
3.1.3 Population by age-group.............................................................................................................29
3.1.4 Annual population growth rate ..................................................................................................29
3.1.5 Household size ............................................................................................................................30
3.1.6 Women headed households .......................................................................................................30
3.1.7 Household formation rate...........................................................................................................30
3.1.8 Household income distribution..................................................................................................30
3.1.9 Household tenure........................................................................................................................30
3.1.10 Total land tenure........................................................................................................................31
3.1.11 Poor household ...........................................................................................................................31
3.1.12 Informal employment ................................................................................................................31
3.1.13 Hospital beds..............................................................................................................................31
3.1.14 Child mortality...........................................................................................................................32
3.1.15 life Expectancy............................................................................................................................32
3.1.16 Adult literacy..............................................................................................................................32
3.1.17 School enrollment......................................................................................................................32
3.1.18 Crime and safety.........................................................................................................................32
xi
3.1.19 Household connection...............................................................................................................32
3.1.20 Access to portable water ...........................................................................................................33
3.1.21 Infrastructural expenditure........................................................................................................33
3.1.22 Transport modal split................................................................................................................33
3.1.23 Travel time, expenditure on road infrastructure and auto mobile ownership .......................33
3.1.24 Waste Water treated .................................................................................................................33
3.1.25 Solid Waste generated...............................................................................................................34
3.1.26 Disposal methods for solid waste .............................................................................................34
3.1.27 Solid waste collection ................................................................................................................34
3.1.28 Housing destroyed per 1000 houses .........................................................................................34
3.1.29 Source of income.......................................................................................................................34
3.1.30 Local government per capita income .......................................................................................35
3.1.31 Per capita expenditure ...............................................................................................................35
3.1.32 Housing in compliance..............................................................................................................35
3.2.0 POLICY RECOMMENDATIONS ...............................................................................................35
3.2.1 Land use.......................................................................................................................................35
3.2.2 Population by sex........................................................................................................................35
3.2.3 Population by age-group ............................................................................................................36
3.2.4 Annual population growth rate................................................................................................36
3.2.5 Total land tenure ........................................................................................................................36
3.2.6 Hospital beds ..............................................................................................................................36
3.2.7 School enrollment.......................................................................................................................37
3.2.8 Crime and safety.........................................................................................................................37
3.2.9 Household connection ...............................................................................................................37
3.2.10 Access to portable water ...........................................................................................................37
3.2.11 Transport modal split.................................................................................................................38
3.2.12 Waste Water treated .................................................................................................................38
3.2.13 Housing in compliance..............................................................................................................38
References............................................................................................................................................39
xii
List of Tables
Table 1: women headed households in Bukomero TC .................................................................9
Table 2: Household formation rate...............................................................................................9
Table 3: Income distribution........................................................................................................10
Table 4: Poor households.............................................................................................................12
Table 5: Informal employment.....................................................................................................13
Table 6: Hospital beds..................................................................................................................13
Table 7: Child mortality................................................................................................................14
Table 8: life Expectancy................................................................................................................14
Table 9: Adult literacy ..................................................................................................................15
Table 10: Crime and safety............................................................................................................17
Table 11: Access to portable water................................................................................................18
Table 12: Infrastructure expenditure............................................................................................19
Table 13: Length of road .............................................................................................................. 22
Table 14: Waste water treated..................................................................................................... 22
Table 15: solid waste collection ...................................................................................................24
Table 16: Housing destroyed per 1000 houses ............................................................................24
Table 17: Housing production .....................................................................................................28
xiii
List of figures
AFigure 1: Land use in Bukomero TC ...................................................................................................4
Figure 2: Population by sex for Bukomero TC .................................................................................6
Figure 3: Population by age group in Bukomero TC........................................................................7
Figure 4: Annual population growth rate.........................................................................................7
Figure 5: Average household size in Bukomero TC .........................................................................8
Figure 6: Income distribution.........................................................................................................10
Figure 7: Household tenure ............................................................................................................11
Figure 8: Total land tenure .............................................................................................................12
Figure 9: School enrollment............................................................................................................16
Figure 10: Household connection ...................................................................................................18
Figure 11: Transport Modal split......................................................................................................20
Figure 12: Time, Expenditure on road infrastructure and Automobile ownership.......................21
Figure 13: Solid waste generated .....................................................................................................23
Figure 14: Disposal method for solid waste ....................................................................................23
Figure 15: Source of income.............................................................................................................25
Figure 16: Local government per capita income.............................................................................26
Figure 17: per capita capital expenditure........................................................................................27
Figure 18: Housing in compliance...................................................................................................28
1
CHAPTER ONE
1.0 Background Information
1.1 Location
Bukomero Town Council is located in Kiboga district in Uganda. Kiboga is located
approximately 140 kilometers (87 miles) northwest of Kampala, Uganda's largest city, on
an all-weather tarmac highway linking Kampala to Hoima. This location lies
approximately 95 kilometers (59 miles), by road, southeast of Hoima, the center of
Uganda's petro chemical industry. The coordinates of Kiboga are: 0°55'03.0"N,
31°45'36.0"E (Latitude: 0.917500; Longitude: 31.7600).
The population of Kiboga was estimated at approximately 12,000, during the 2002
national population census. In 2010, the Uganda Bureau of Statistics (UBOS) estimated
the population of the town at about 16,600. In 2011, UBOS estimated the mid-year
population of Kiboga at 17,400 persons.
Bukomero TC has an average elevation of 1,213 meter above sea level. The area is mildly
densely populated with 398 people per square kilometer. The nearest town larger than
50,000 inhabitants takes about 1:36 hour by local transportation. An estimated 2.11% of
the children below 5 years old are underweight, with a mortality of 69 per 1,000 births.
1.2 Natural Hazards
Bukomero TC experiences six strong earthquakes (on average one every 50 years), with
occurrences at 5-6 Richter. When a strong earthquake occurs, it will most likely be felt by
everybody; people may be frightened and run outdoors, walk unsteadily. Windows,
dishes, glassware may be broken, and books fall off shelves. The damage will be slight.
There is a very low occurrence of periods with extreme drought. Flooding risk is high.
2
1.3 Weather
February is warmest with an average temperature of 29.4 °C at noon. July is coldest with
an average temperature of 15.6 °C at night.
Bukomero TC has no distinct temperature seasons; the temperature is relatively
constant during the year. Temperatures drop sharply at night. December is on average
the month with most sunshine. Rainfall and other precipitation peaks around May and
July are driest months all around.
1.4 Nature
Bukomero has a humid (> 0.65 p/pet) climate. The land area is not cultivated; most of the
natural vegetation is still intact. The landscape is mostly covered with mosaic
vegetation/croplands. The climate is classified as a tropical savanna (winter dry season),
with a sub-tropical moist forest. The soil in the area is high in ferralsols, acrisols, nitosols,
soil composed of kaolinite and quartz, enriched in iron and aluminium oxides.
1.5 Objectives of the study.
i) To Establish Bukomero TC’s Urban Indicators Database
ii) To prepare the Bukomero Town Council Urban Sector Report for Uganda 2014
1.6 Team Composition
Name Designation Email/Telephone number
Shibuta Mabala Samuel CUD Samuel.mabala@gmail.com
0772408744
Nakiguli Devine
Kibuuka
Economist-UD devinenaki@gmail.com
0756635003
Wesigye Alex Internee wesigyea@yahoo.com
0783171572
Kaweesi Samuel Internee samuelkaweesi90@gmail.com
0773931668
Kakande Fred Internee kakandefred32@gmail.com
0758075264
3
Kulumba Brian Internee briankulumba@gmail.com
0757680681
Kemba Joseph Internee jkemba12@gmail.com
0703083304
1.7 Methodology
Telephone calls and emails were adopted for usage for this study. Telephone calls were
made to the Bukomero Town Clerk to inform him of the Ministry’s intension of
collecting, compiling and updating the Urban Indicators’ Database and informing him of
his required input in the program. The Town Clerk’s input was to fill the Urban
Indicators’ Toolkit. The Toolkit was sent to the Town Clerk via email.
Data collection was done using a tool kit electronically by email. Officers made follow-up
calls to remind the Town Clerk about the assignment. The town clerk filled the tool kit
and then sent back the filled form via email. The filled form was then downloaded.
Data entry and analysis was done in Microsoft office excel 2007.
1.8 Limitations
The Town Officers had inadequate knowledge about the tool kit and even the urban
indicators. We had to help an officer from Bukomero in explaining to her the entire tool
kit.
There was a delay in the receipt of feedback. This crippled the entire program since much
of the time in the study were spent waiting for feedback yet time was limited.
Some of the fields in the tool kit were not filled and hence empty fields affecting the
quality of the data analyzed.
4
CHAPTER TWO
2.0 Analysis of the Findings
This chapter concentrates on the analysis of the indicators as they are categorized in the
tool kit.
2.1 Land use
Figure 1: Land use in Bukomero TC
Source: Bukomero Town Council Urban Indicators’ Survey July/2014
The Land use is measured in Square kilometers and it includes; residential, Business,
Agriculture, services, transport, vacant land and other land use in the town council. The
residential land includes all the built up land zones including open space and roads. This
is further divided in to residential formal and residential informal. Majority of the land in
the town council is occupied by informal settlements covering almost 3.5 Km2
and only 1
5
square kilometer is occupied by the formal settlement of the total land implying most of
the people live in informal or unplanned settlements
The biggest portion of the land is used for Agriculture compared to other activities in the
town council and it goes up to 32.2 km2
implying that most of the people in Bukomero
TC are much into agriculture. This is followed by other activities like recreational and
wetlands that take up to 5.8 km2
. Institutional Services like government buildings,
schools, hospitals among others take the third position with a total of 5.0 km2
. Transport
take up the fourth position which includes roads, railways with only 4.0 km2
and lastly
are business and vacant land which cover 2.0 km2
each.
The economic implication of this type of land use pattern is that the major economic
activity in Bukomero TC is Agriculture so if anything is to be done, should target mainly
agriculture. The vacant land also means that more development is needed in the area.
However, measures should be done to increase on the business activities for the rapid
growth of the Town Council.
2.2 Demography
Under this indicator we mainly focus on the population composition in terms of its age,
gender among other variables.
2.2.1 Population by sex
According to Uganda Urban Indicators Database 2014 Definition, Total population refers
to the number of people living in a particular area regardless of their legal status or
citizenship. The population is divided both by sex and different age groups.
According to figure 2 below, 46 percent of the population was found out to be male while
54 percent are female corresponding to 9053 and 10651 people respectively. This shows
that the population is somehow balanced when it comes to gender because the difference
between the male number and that of the female is slight at a percentage of 8%.
6
Having more males than females in the town council negatively affects agriculture since
in most cases it is women who are engaged in agriculture.
Figure 2: Population by sex for Bukomero TC
Source: Bukomero Town Council Urban Indicators’ Survey July/2014
2.2.2 Population by age group in Bukomero TC
From the figure3 below, it shows that there are more people between the ages 25 to 59.
This could be mainly associated with the immigrants into the Town Council from other
nearby areas mainly for business as it’s the center of business in the area. There is also a
balance between the male and the female in the age-bracket of 5 to 14 years. Whereas
there is an imbalance between 15to 24 years, there are more female than the male. This
could be due migration to better- off towns like Kakiri, Nansana or even Kampala. The
population in the age bracket 60 and above is low which could be due to migration to
villages like Temanakali because this group is not productive or even some die. The birth
rates in the town council are also very low so the trend when it comes to birth rate is not
threatening.
7
Figure 3: Population by age group in Bukomero TC
Source: Bukomero Town Council Urban Indicators’ Survey July/2014
2.2.3 Annual Population growth rate
Figure 4: Annual population growth rate
Source: Bukomero Town Council Urban Indicators’ Survey July/2014
8
From figure 4, the Natural growth rate is 24% and net migration rate is 50% in the Town
Council. The implication of net migration rate is that the movement of people from in
and out of urban centre is equal and this implies that migration has no impact on the
town council. The rate at which the population is increasing naturally is threatening
because a 24 percent growth rate is too high meaning that in a short period of time
people will have encroached on the conserved land. The net migration is 50% which is
has a neutral effect on population growth. The rate at which the population of the urban
agglomeration is growing is too high. Generally the growth rate of the population in the
town council is too high and threatening so measures like family planning programmes,
migration regulation measures should be adopted.
2.3 Household
2.3.1 Household size
Figure 5: Average household size in Bukomero TC
Source: Bukomero Town Council Urban Indicators’ Survey July/2014
From figure 5, the results imply that informal settlements are more than the formal
settlements. Average household size is commonly used as a measure which is affected by
9
both number of children and the existence of shared households or extended families.
On average, there are 4 people per household in the formal settlement of the Town
Council and those of the informal settlement are 10people per household and this implies
that household size is larger in informal sectors than in formal sectors meaning that the
poor in Bukomero tend to be with larger families while the rich in the area tend to have
smaller families.
2.3.2 Women headed household
According to Uganda Urban Indicators Database 2014 Definitions, a woman headed
household is one where the woman does not live with the husband. From the study, it
shows that 10% of the household in the town council are headed by the women. This
means that on every 100 households there are 10 households headed by the women.
Table 1: women headed households in Bukomero TC
% of women headed households 10
Source: Bukomero Town Council Urban Indicators’ Survey July/2014
2.3.3 Household formation rate
This shows the annual growth rate of the number of households in the town council. This
stands at 2.8 per Annam in Bukomero according to table 2 below. Since the growth is at
that meaning that it’s a normal rate so the economic conditions in the town council are
just average because 2.8% is just a normal growth rate.
Table 2: Household formation rate
Household formation rate (%) 2.8
Source: Bukomero Town Council Urban Indicators’ Survey July/2014
10
2.4 Household income distribution
The household income distribution is divided into five quintile such that the each
quintile is 20% of the income. From figure 6 below, we can see that the income disparity
from one quintile to another is 0.16. This means that the incomes of the households tend
to be at a stable level because a 0.16 is a small disparity. Further more according to the
figure, the households in the first quintile have a higher income as compared to other
quintiles.The trend is however threatening because its down ward sloping as the year
goes on.Meaning that most of the households lie in the first quintile hence earn less
income
Figure 6: Income distribution
Source: Bukomero Town Council Urban Indicators’ Survey July/2014
Extracted results below;
Table 3: Income distribution
Average income US$7.0265
Median income US$4.8075
11
Source: Bukomero Town Council Urban Indicators’ Survey July/2014
From the extracted results, it shows that the average income of all the households in
Bukomero is 7.0265 dollars a year ans the median income is 4.8075 dollars a year.
2.5 Land tenure types
2.5.1 Household tenure
This can be defined by the mode at which land is owned or held or the rate of
relationships among people concerning the use of land. According to figure 7 below, the
biggest part of the land is under formal ownership, constituting 56 percent of the total
land in the town council. The tenants who pay for the use of the land take up the second
position with a percentage of 29.The squatters take up 12 percent of the total land while
the nomads, homeless, people in institutions or hotels and other tenure types cover 3
percent of the land. The biggest part of the land is under formal ownership simply
because most of the land is owned on family basis (extended families) hence this could
be the reason why the business activities in the town council are few. The tenants take
the second position. These people pay for the use of the land from the land owners
(landlords)
Figure 7: Household tenure
Source: Bukomero Town Council Urban Indicators’ Survey July/2014
12
2.5.2 Total Land tenure
Figure 8 below shows the total land ownership in Bukomero Town council. It was
observed that the largest land in the Town is owned by the private individuals or
restricted group of people taking up to 61% of the total land. This is followed by the
public whose structures and purposes cover 37% of the total land; lastly it’s the 2% that is
covered by all other land rights such as customary rights. Since people have exclusive
ownership of their land, then they use it for whatever they want.
Figure 8: Total land tenure
Source: Bukomero Town Council Urban Indicators’ Survey July/2014
2.6 Social- economic Development
2.6.1 Poor household
Table 4: Poor households
Household 8229
Poor house holds 1318
Poor Women headed households 75
Source: Bukomero Town Council Urban Indicators’ Survey July/2014
13
Since by 2002 Bukomero Town Council was not in existence, the only data that is
available is for only 2014.There is a total of 8229 households in Bukomero of which 1318
are poor households s. Out of the 1318, there are 75 poor households headed by the
women in the Town Council.
2.6.2 Informal employment
Informal sector includes all persons employed in all unregistered commercial and non-
commercial enterprises that have no formal structure in terms of organization (Uganda
Urban Indicators Database Definitions 2014). From the table below, 80 percent of the
people in the Town Council are employed informally meaning that out of every 10 people
met, 8 of them are employed under the informal sector.
Table 5: Informal employment
Informal employment 80%
Source: Bukomero Town Council Urban Indicators’ Survey July/2014
2.7.0 Health sector
2.7.1 Hospital beds
This includes all the number of hospital beds both in private and public hospitals. This is
shown in the table below.
Table 6: Hospital beds
No of Public hospital beds 50
No of Private hospital beds 10
Total 60
Number of persons per bed 328.4
Source: Bukomero Town Council Urban Indicators’ Survey July/2014
From the above, there are 50 beds in the public hospitals while those in the private
hospitals are only 10. Therefore out of the total population of 19704 people in the town,
on average each bed accommodates a number of 328.4 people. However this can
14
symbolize that there is need to increase on the number of hospitals and the beds in the
Town Council.
2.8.0 Child mortality
2.8.1 Child mortality
This indicator mainly looks at the children that die before their fifth birth day but above
the first birthday. (Uganda Urban Indicators Database Definitions 2014)
Table 7: Child mortality
Gender Mortality in percentage (%)
Female 3
Male 5
Total 8
Source: Bukomero Town Council Urban Indicators’ Survey July/2014
From table 7 above, it was found out that on every 100 girls(female) 3 of them die before
celebrating their fifth birthday while on every 100 boys(male) 5 die before the fifth birth
day in a year. Therefore out of every 100 children in the Town Council above one year but
less than five years 8 of them die. However the male die more than the female standing at
5 percent and 3 percent respectively in a year.
2.8.2 Life expectancy
According to Uganda Urban Indicators Database Definitions 2014, life expectance at
birth is defined as the number of years a new born infant would live if the prevailing
patterns of mortality at the time of birth remain the same throughout the child’s life.
Table 8: life Expectancy
Life Expectancy (years)
Male Female Average
57 59 58
Source: Bukomero Town Council Urban Indicators’ Survey July/2014
15
Table 8 above indicate that the life expectancy of females(59 years) is more bthan that of
males(57years) meannig that on average a woman lives for 2 more years than a man. This
could be becaues generally women take good care of themselves for example by eating
good meals, using good skin care products for their skins among others while men often
wear them selves working the welfare of their families. Probably the government of
uganda could sensitize men to as well care about themselves visa vis their families
2.9.0 Education
This indicator mainly looks at the schools generally, that is, adult literacy, school
enrollment ratio, and the number of class rooms.
2.9.1 Adult literacy
Under this indicator we are trying to look at the percentage of the person’s age 15 years
and above who can both read and write a short simple statement on their everyday life.
Table 9: Adult literacy
Gender Adult literacy rate (%)
Male 50
Female 33.2
Total 83.2
Source: Bukomero Town Council Urban Indicators’ Survey July/2014
In reference to table 9 above, it was observed that 50 percent of the male were literate
out of the total population of the adults in the town council. Meaning that n every 10
males found, 5 of them are literate but there are only 33.2 percent of the female that are
literate which simply means that out of every 10 female met, only 3 are literate. There is a
big gap between the literate male and the female so much is needed to close the gap
between the two groups. However, the adult literates constitute 83.2 percent of the total
population of the adults in the town council
16
2.9.2 School enrollment
This indicator looks at the number of students, by sex, enrolled in a level of education
whether or not they belong in the relevant age group for that level, as a percentage of the
population in the relevant group for that level. From figure 9 below, 80 percent are
enrolled in the primary level, 30 percent are enrolled in the secondary level while only 3
percent are enrolled in the tertiary level of education. However, the average rate of
school enrollment stands at only 37.7 percent in the town council which is below average
meaning that few people seek education.
Figure 9: School enrollment
Source: Bukomero Town Council Urban Indicators’ Survey July/2014
Since there are few class rooms, there is great need for construction of new class room
blocks in the Town Council.
17
2.10 Crime and safety
Under this indicator, we will look at the reported crimes (number of victims, male and
female annually per 1000 population).
Table 10: Crime and safety
Crimes Number of victims per 1000
Murders 1
Thefts 219
Rape 2
Source: Bukomero Town Council Urban Indicators’ Survey July/2014
From table10 above, it was found out that, out of 1000 victims observed only 1 is charged
with murder, 219 victims are charged over theft and only 2 out of 1000 are charged with
rape. Therefore most of the crimes are mainly in theft related cases. This could be due to
unemployment which makes people to resort to stealing for a living. Therefore the
government of Uganda should establish measures that reduce the unemployment rate for
example by emphasizing on vocational training in order to release job creator graduates
other than job seekers in the labour market.
2.11.0 Infrastructure
Percentage of households directly (in their house or dwelling) connected to water,
sewerage, electricity and telephone. These are the primary indicators of access by
households to the principal networked services.
2.11.1 Household connection
Here we look at the percentage of households directly connected to water, sewage,
electricity and Telephone. The figure 10 below is developed based on a time series
information basically after 22 years but since by then there was no Bukomero Town
Council so the only information provided is for 2002 and 2014.Basing on telephone
connection, in 2002 there were only 20 percent households connected but there has been
a sharp increase to 50 percent of the household connection. This means that on every 10
18
households found, 5 have telephone connection. The electricity connection is still low
from 10 percent in 2002 to 30 percent in 2014.This is however a very low rate because it is
below the average. However water connection is very poor in the Town Council with 20
percent of the households from 5 percent in 2002.There is no sewage connection in the
Town Council.
Figure 10: Household connection
Source: Bukomero Town Council Urban Indicators’ Survey July/2014
Bukomero as a Town Council was not in existence by 2002. Telephone connection has
the highest percentage (50%) followed by electricity (30%) and then water (20%)
2. 11.2 Access to portable water
This is defined as the daily household consumption of water per person in m3 (or 1000
liters) Consumption of water per person depends on the availability and price of water,
the climate, and the uses to which water is customarily put by individuals (drinking,
bathing, washing, and gardening). Consumption only includes household use (excludes
industrial and agricultural use) in the Town Council.
Table 11: Access to portable water
Year Access to portable water (%)
2014 20
19
2002 5
1992 No data
Source: Bukomero Town Council Urban Indicators’ Survey July/2014
The trend in which portable water has been made accessible to the people has been
increasing over time as shown in table 11 above. Connection in 1992 is not known. In
2002, the accessibility rose to 5% and in 2014 the accessibility stands at 20 percent.
However this access is still too low meaning that at every 10 households only 2
households have access to the portable water.
2.11.3 Infrastructure expenditure
Defined as the ratio of total expenditures in US dollars by all levels of government
(including private utilities and parastatals) on infrastructure services during the current
year, and the urban population. Infrastructure includes operations, maintenance, and
capital expenditures on physical infrastructure such as urban roads, railways, sewerage,
drainage, water supply, electricity, and garbage collection, but not social infrastructure
such as health and education expenditure.
Table 12: Infrastructure expenditure
Total expenditure on infrastructures US $6250
Total population 19704
Infrastructure per capita 3.5264
Source: Bukomero Town Council Urban Indicators’ Survey July/2014
Infrastructure expenditure includes all the expenses incurred by the government
including operation, maintenance and capital expenditure on physical infrastructure. On
a total of 19704 people, US$6250 is spent on infrastructures of which the per capita
infrastructure expenditure is 3.5264 US Dollars
20
2.12.0 Transport
2.12.1 Modal split
Proportion of work trips undertaken by the modes below. Several modes could be used
for the same work trip. The main mode should be accounted for only. Private cars
include any motorised vehicle exclusively used for private purposes. Bus or minibus
includes road vehicles other than cars taking passengers on a fare paying basis. Other
includes ferry, taxi, animal or rickshaw.
Under this indicator, we are looking at the various modes of transport that are used by
the people for the work trips. The highest ranked under this are the non-motorized that
include bicycles and walking taking up 20 and 35 percent respectively meaning that
people mainly use non-motorized means. This is followed by the private motorized
means which include motorcycles and private cars. In this category, 20 percent used
motorcycles while 5 percent use private cars for work trips. In the third place we have the
buses and minibuses where the people usages of minibuses stand at 20 percent while that
of the buses is 0 percent. There are no people in the town council that use trains and
trams for their work trips.
Figure 11: Transport Modal split
Source: Bukomero Town Council Urban Indicators’ Survey July/2014
21
The biggest percentages of the workers walk to work (35%), followed by 30% who use
motorcycles.
2.12.2 Travel time, Expenditure on road infrastructure and Automobile ownership
According to Uganda Urban Indicators Database Definitions 2014, Travel time is the
average time in minutes for a one-way trip, Expenditure on road infrastructure is the per
capita expenditure in US dollars on roads while the automobile ownership is the ratio of
automobiles to 1000 population. According to figure12 below it only takes 30 minutes for
a person to reach the work place, the total number of automobiles is 150 per 1000 people
in the town councils and the per capita expenditure on the roads is 0.756 dollars.
Therefore much should be done to improve on the transport in the Town Council to
reduce the time spent on work trips for example most of the people walk to work
therefore by introducing the buses and even minibuses can help to reduce the time spent
on the work trip.
Figure 12: Time, Expenditure on road infrastructure and Automobile ownership
Source: Bukomero Town Council Urban Indicators’ Survey July/2014
22
2.12.3 Length of road
This indicator looks at the how long the roads are (length of roads) in the town council
and it measures them in kilometers.
Table 13: Length of road
Year Length of roads( kilometers)
2014 75
Source: Bukomero Town Council Urban Indicators’ Survey July/2014
From table13 above, the length of the roads in Bukomero are 75 kilometers meaning that
the transport is made easier as time goes by making the transportation of agricultural
products easier.
2.13.0 Environment
This involves waste water treated, solid waste generated, disposal methods for solid
waste, regular solid-waste collection and housing destroyed by disasters.
2.13.1 Waste water treated
This looks at percentage of waste water undergoing treatment in the Town Council that
includes primary, secondary and tertiary treatment. In reference to table 14 below, the
percentage of waste water under treatment was found out to be 5 percent in 2014.
Table 14: Waste water treated
Year Wastewater treated (%)
2014 5
Source: survey carriedout in Bukomero Town Council
2.14.1 Solid waste generated.
This indicator looks at the solid waste generated per person in cubic meters and tones
per annum From the figure 13 below, the volume wastes was 2.4 cubic meters per year
and the weight of the wastes was 0.10 tones per year. Due to the development and
23
increase in the economic activities in the town council, the volume and weight of the
wastes has increased as compared to that I the 2002. The volume is 4 cubic meters while
the weight is 0.10 tones per year per person.
Figure 13: Solid waste generated
Source: Bukomero Town Council Urban Indicators’ Survey July/2014
2.13.3 Disposal method for solid waste
Proportion of solid wastes by weight disposed to the categories below: Sanitary landfill,
Incinerated (in incineration plants), Open dump, Recycled, Burned (openly) among others.
Figure 14: Disposal method for solid waste
Source: Bukomero Town Council Urban Indicators’ Survey July/2014
24
According to figure 14 above, it was found out that there were no proper method of
disposal that were used in 2002 that is why the sanitary lands fill and open dump stand at
0 percent. In 2014, sanitary landfill stand at 50 percent, open dump is at 30 percent and
the burned (openly) take up 20 percent however there is no use of incinerators and
recycling in the town. There are some corrections that should be made on the way wastes
are disposed off for example hospital wastes should disposed in incinerators because they
are contagious and harmful to people. Recycling of waste has a great potential and need
to be promoted in the Town council.
2.14.2 Regular solid-waste Collection and the Housing Destroyed by Disasters
These two indicators, one looks at the proportion of households enjoying regular waste
collection that is the regular solid-waste collection and the housing destroyed by
disasters.
Table 15: solid waste collection
Households with regular solid-waste collection(% of
households)
80
Source: Bukomero Town Council Urban Indicators’ Survey July/2014
This means that out of every 100 houses in the town council, 80 of them regularly collect
their solid- waste either by dump masters or to the carry garbage.
Housing Destroyed in the last ten years
This is defined as the proportion of housing stock destroyed per thousand by natural or
man-made disasters over the past ten years. This indicator measures the exposure of the
housing stock to disasters and its ability to withstand these disasters.
Table 16: Housing destroyed per 1000 houses
Housing destroyed per 1000 houses(last 10 years) 20
Source: Bukomero Town Council Urban Indicators’ Survey July/2014
25
In the past ten years, 20 houses in Bukomero have been destroyed by storm, bush fire or
earth quake.
2.15.0 Local government
This is a form of quasi-government organization which exists to deliver services locally.
The Town Council has only one local government unit in existence.
2.15.1 Source of income
Figure 15: Source of income
Source: Bukomero Town Council Urban Indicators’ Survey July/2014
This cover the percentage revenue in each category including taxes ,user charges
including any local charges for services provided such as water refuse collection and
building permits ,other own sources including interest and principal received , and sales
of capital items ,any local taxes on the transfer of property ,other incomes including any
income such as donation or aid `and borrowing including loans . The local government
of the town council gets a big percentage of its revenue from other own source income
include the interest and principal received at 50% than other sources of revenue.
26
2.15.2 Local government per capita income
Figure 16: Local government per capita income
Source: Bukomero Town Council Urban Indicators’ Survey July/2014
Per capita income includes the capital in us dollars and averaged over the last three years.
In 2012 the per capita income was US $558.139, in 2013, the per capita income was US
$744.185 (i.e. with an increment of US $186.045 per capita income from the previous year)
and the per capita income for 2014 is US $930.23(i.e. with an increment of US $186.045 per
capita income from the previous year) implying that the increment of the per capita
income for both years (i.e2013 and 2014) are approximately the same (i.e. US $186.045.)
The 3 years average i.e. (2012-14) is US $744.185 which is equivalent to per capita income
of the year 2013.
27
Figure 17: per capita capital expenditure
Source: Bukomero Town Council Urban Indicators’ Survey July/2014
2.15.3 Per capita capital expenditure
This concerns the capital expenditure in US dollars per person, by a local government and
Averaged over the last three years.
In reference to figure 17 above, in 2012 the per capita expenditure was US $697.614 which
was low. For the year2013, the per capita expenditure was US $ 1023.255 (i.e. with an
increment of US $325.641 per capita expenditure from the previous year), and the per
capita expenditure for the year 2014 is US $1162.79 (i.e. with an increment of US $139.535
per capita expenditure from the previous year) and on 3 year average the per capita
expenditure is US $961.219.
2.16 Housing in compliance
This indicator refers to urban housing, and measures the extent to which the urban
population is housed legally. Only housing which both has a clear title to the land on
28
which it stands, and which is constructed with all required building, land use, or land
subdivision permits is regarded as in compliance. The housing compliance in 2014 and
2002 is 10 % and 5%respectively the implication is that houses in 2014 have more clear
title to the land on which it stands compared to those of 2002.
Figure 18: Housing in compliance
Source: Bukomero Town Council Urban Indicators’ Survey July/2014
Table 17: Housing production
This concerns the number of dwellings produced annually, both formal and informal per
1000 population
Formal housing
produced(000)
informal housing
produced(000)
Total
241 976 1217
Source: Bukomero Town Council Urban Indicators’ Survey July/2014
As shown in table 17 above, informal housing produced 976000 while formal produced were
241000 units.
29
CHAPTER THREE
3.0 CONCLUSIONS AND RECCOMENDATIONS ON THE FINDINGS
3.1.1 Land use
The biggest portion of land Bukomero Town council is used for agriculture(32.2Km2
),
followed by other activities (5.8Km2
) which include recreational or water areas , followed
by services(5Km2
) which include land for government buildings, schools, hospitals,
electricity, water and other public amenities excluding transport , Transport covers 4Km2
and then Residential informal covers 3.5Km2
as referenced from figure 1.
3.1.2 Population by sex
As shown in figure 2, the biggest percentage of people in Bukomero Town Council is
females constituting 54% while the males constitute 46% of the Town Council.
3.1.3 Population by age-group
The biggest numbers of people in Bukomero are those in the age bracket of 25-59 years,
followed by those in the 15-24 years and 5-14 years. Those in 0-4 and 60+ years are the
minority in the town council as shown in figure 3. Meaning that the vulnerable
population is low. The working age is dominant.
3.1.4 Annual population growth rate
According to figure 4, the annual population natural growth rated is 24% and the net
migration rate is 50%.
30
3.1.5 Household size
In reference to figure 5, it is shown that the informal settlement is more than the formal
settlements.
3.1.6 Women headed households
Table1 shows that the percentage of women headed households in the town council is
10%. This means that 10% of the households are headed by women in the Town council.
3.1.7 Household formation rate
The household formation rate is 208% as shown in table 2. This implies that the annual
rate of growth of numbers of households is 2.8%.
3.1.8 Household income distribution
Form table3, it is shown that the average income of the people is Us$7.0265 and the
median income is US$4.807.
3.1.9 Household tenure
In Bukomero, as shown in 7, the biggest percentage of household tenure is formal
ownership(56%) which include owned which refer to households with a clear title or
ownership of the house and land they occupy and purchasing which refer to owner-
occupiers in formal housing with a formal mortgage over the property.
Tenancy is the second with 29%. Tenancy comprises of private rental which refer to
households in (formal) housing for which rents are paid to a private land lord who is the
legal owner, social housing which includes all households in public, parastatal or NGO-
owned or operated housing including government employee housing and housing owned
or operated by co-operatives; and sub-tenancy which refers to households who are
renting from another household who is renting the premises.
31
12% of the households are squatters. Squatters comprise of squatter- without rent which
refers to households in squatter housing, or housing which has no title to the land on
which it stands, and who pays no rent; and squatter-with rent which refers to
households in squatter housing who pay no rent.
3% of the households are in other tenure which includes nomads, homeless, and persons
in institutions or hotels among others.
3.1.10 Total land tenure
The biggest percentage of the land tenure private(61%) meaning that most of the land is
exclusively possessed by an individual or restricted group of people of the same
family(couple, nuclear family, inheriting brothers or sisters and so on). 37% of the land is
owned by the government, used for public purposes and 2% of the land is other tenure
such as other land rights like customary rights among others as shown in figure 8.
3.1.11 Poor household
According to table 4, the number of poor households in Bukomero is 8229 Household
and poor women headed households are 75 households.
3.1.12 Informal employment
Table 5 reveals that out of every 10 people in the Town Council, 8 of them are employed
in the informal sector.
3.1.13 Hospital beds
There is a total of 60 hospital bed in Bukomero Town Council as shown in table 6. Out of
the 60 beds, 50 are in public hospital whereas 10 are in private hospitals.
32
3.1.14 Child mortality
The female child mortality (3%) in the Town Council is lower than the male child
mortality (5%) and the total child mortality is 8% as shown in table 7. Out of 100 births 8
of them die before their 5th
birth day.
3.1.15 life Expectancy
Women in Bukomero live longer than their male counterparts by 2 years and the average
life expectancy of the people in the Town councils is 58 years as shown in table 8.
3.1.16 Adult literacy
From table 9, male adult literacy rate (50%) is greater than the female adult literacy
(33.2%) by 16.8%. the total adult literacy rate is 83.2% meaning that out of 10 adults, 8 of
them are literate.
3.1.17 School enrollment
The school enrollment is in primary level 80%, in secondary level it is 30% and tertiary
enrollment is 3% and the average enrollment is 37.7% a shown in figure 9. This
percentage is very low meaning few people go to schools.
3.1.18 Crime and safety
Out of 1000 crime victims in the Town Council, 1 is a victim of murder, 219 are victims of
theft and 2 are victims of rape as shown in table 10. This shows a high rate of theft in the
Town Council.
3.1.19 Household connection
In reference to figure 10, in 2002, 20% of households were connected with Telephone,
10% with Electricity, and about 5% with water while in 2014 50% were connected with
Telephone, 30% with Electricity and 20% with water. There is no household connected
33
with sewerage since 2002. This data shows that there is an improvement in household
connection.
3.1.20 Access to portable water
In 2002 accessibility to portable water was at 5% and in 2014 it rose to 20% as shown in
table11. This means that out of 10 households, 2 have access to portable water in the Town
Council. The situation is really alarming.
3.1.21 Infrastructural expenditure
On a total of 19704 people in the Town council, US$6250 is spent on infrastructures of
which the per capita infrastructure expenditure is 3.5264 US Dollars as shown in table 12.
3.1.22 Transport modal split
As shown in figure 11, the biggest percentage of workers walk to work(35%), followed by
those who use motor cycles(30%), bicycles (20%), minibuses (10%) and 5% use private
cars. No one uses train, tram and neither bus.
3.1.23 Travel time, expenditure on road infrastructure and auto mobile ownership
It takes 30 minutes for a person to reach his or her place of work. The total number of
automobiles per 1000 population is 150 and the per capita expenditure on road is
US$0.756 in the Town Council as shown in figure 12.
3.1.24 Waste Water treated
In reference to table 14, the percentage of waste water under treatment is 5 percent in the
Town Council. This percentage is low and there is need for more to be done.
34
3.1.25 Solid Waste generated
As shown in figure 13, in 2002 the solid waste generated had a volume of 2.4m3
/per/year
and a weight of 0.1 tonnes/per/year whereas in 2014 it rose to 4m3
/per/year and 0.18
tonnes/per/year respectively.
3.1.26 Disposal methods for solid waste
In Bukomero Town Council, 50% of the solid waste is disposed by using sanitary fill, 30%
in open dump and 20% is openly burned. No incinerators are used and neither recycling
is done as well illustrated in figure14.
3.1.27 Solid waste collection
In the Town Council, 80% of households are involved in regular solid waste collection as
shown in table 15. This is a good percentage meaning that there is better disposal of
cabbage in Bukomero.
3.1.28 Housing destroyed per 1000 houses
20 houses have been destroyed per 1000 houses in the last ten years in the Town Council
as shown in table 16. These houses were destroyed by storms, bush fires and earth quake.
3.1.29 Source of income
The biggest source of income in Bukomero is other-own sources (50%) which include
interest and principals received sales of capital items among others. Taxes in the Town
Council carry 30% of the income which include municipal rates and levies, any local taxes
on the transfer of property and any other taxes such as entertainment or hotel taxes,
motor vehicle taxes, and taxes on business, other income which include donations or aid
constitute 13%, user charges take 4% which include any local government charges for
services provided such as water, sewerage, refuse collecting or building permits,
betterment levies should be included, transfers contribute 2% which include formula
driven payments such as repatriation of income or other grant donations from national
35
or state government. And borrowing contributes 1% of the town council’s income as
shown in figure 15.
3.1.30 Local government per capita income
In Figure 16, the trend line shows that the per capita income increased form US$558.139
in 2012 to US$744.185 in 2013 which rose to US$930.23 in 2014.
3.1.31 Per capita expenditure
As referenced from figure 17, Per capita expenditure of Bukomero increased from
US$697.614 in 2012 to US$1023.255 in 2013 and further increased to US$1162.79 in 2014.
This implies a continuous increase in expenditure over the years.
3.1.32 Housing in compliance
The Housing in compliance in the Town Council increased from 5% to 10% in 2002 and
2014 respectively as shown in figure 17. This shows that in 2014 only 10% of the housing
stock are in compliance with the current regulations (authorized housing).
3.2.0 POLICY RECOMMENDATIONS
3.2.1 Land use
As shown in figure1 the biggest percentage of the land is used for agriculture, therefore
the government of Uganda should pass legislations that favour the agricultural activities.
The government should create invectives for agriculture such as tax holidays on
agricultural inputs such as seeds, fertilizer among others.
3.2.2 Population by sex
The biggest percentage of people in Bukomero is females (54%). This could probably be
due to the high mortality rates of men among other reasons. As revealed in land us
above, that agriculture is the major land use activity and most often it is women are
36
dominant in agriculture, therefore The government of Uganda should promote
agriculture in the Town council.
3.2.3 Population by age-group
People in the age bracket of 25-59 are the dominant age group ij the Town Council then
followed by those in 15-24 age groups. The population is dominated by the youth who are
labour force and the young and very old are the minority, therefore the government of
Uganda should pass policies geared at catering the needs of the labour such as
employment among others.
3.2.4 Annual population growth rate
The government of Uganda should sensitize the resident in the Town Council on the
importance of a small family and the impacts of an over populated country such that they
could produce few children as the natural growth of the population is at 24%.
3.2.5 Total land tenure
The biggest patch of land tenure is privately possessed which may lead to problems of
absentee landlord who hinder development of the land. The government of Uganda
therefore should revise the land tenure system to give potential land users to use it for
production.
3.2.6 Hospital beds
The number of persons per bed in the Town Council is 328. This data shows that the
situation in the hospital is alarming due to congestion. The government of Uganda
should allocate more funds to the health sector for the purchase of hospital beds.
37
3.2.7 School enrollment
Statistics have revealed that School enrollment rate in the Town Council is 37.7% which
is a very low percentage. This shows that few people actually go to schools. The
government of Uganda should sensitize parents to send their children to school.
More so since the class rooms are few, the government also needs to allocate more funds
to the Education Ministry to cater for the construction of new class rooms blocks in the
Town council and the construction of new class rooms mean more teachers will also be
required.
3.2.8 Crime and safety
The theft in the Town Council is a bit threatening so the Police should make more
enforcement to harmonize the situation.
3.2.9 Household connection
It is only 30% of households connected with Electricity. Thus the Government’s
campaign of rural Electrification should be fueled to cover atlesat one major trading
centre in a sub county.
There is also need for sewerage connection in the Town Council because data reveals that
there is so far no connection.
3.2.10 Access to portable water
The government of Uganda should establish projects aimed at setting water point or
boreholes or any other source of water for the residents in the town council because
statistics have shown that accessibility to portable water stands at 20%.
38
3.2.11 Transport modal split
In the Town Council most people walk to work or use motorcycle or bicycles. The
government of Uganda should purchase buses for worker to use for their work trips as
this would probably reduce on the travel time to work place.
3.2.12 Waste Water treated
Only 5% of the waste water is treated in the Town Council, therefore the Government of
Uganda should set up priority programmes to cater for the waste water treatment.
3.2.13 Housing in compliance
Only 10% of the housing stocks in the Town Council are in compliance with the current
regulations (authorized housing). This show there is a big problem in Urban Planning of
the Town Council. The ministry of Lands, Housing and Urban Development should co-
ordinate with Local Government to properly plan for urban centers.
39
References
 Bukomero Town Council Urban Indicators Database 2014.
 www.chinci.com.
 UN Habitat Global Urban Indicators Database
 Bukomero Town Council comprehensive five year development plan.

More Related Content

What's hot

Regional Government
Regional GovernmentRegional Government
Regional GovernmentJaypeeRojas
 
Overview in Barangay Budgeting
Overview in Barangay BudgetingOverview in Barangay Budgeting
Overview in Barangay Budgetingyee tandog
 
Bottom up Budgeting
Bottom up BudgetingBottom up Budgeting
Bottom up BudgetingAlvin Almo
 
Local planning and budgeting linkage_version 2.0
Local planning and budgeting linkage_version 2.0Local planning and budgeting linkage_version 2.0
Local planning and budgeting linkage_version 2.0yee tandog
 
Local development planning
Local development planningLocal development planning
Local development planningGil Sr.
 
Local government systems in punjab by lr 05032015
Local government systems in punjab by lr 05032015Local government systems in punjab by lr 05032015
Local government systems in punjab by lr 05032015DUNYA NEWS
 
Institutional framework comparative analysis case of pakistan & uganda
Institutional framework comparative analysis case of pakistan & ugandaInstitutional framework comparative analysis case of pakistan & uganda
Institutional framework comparative analysis case of pakistan & ugandaSajjad Ali Bhayo
 
Manhattan Community Board Budget Training
Manhattan Community Board Budget TrainingManhattan Community Board Budget Training
Manhattan Community Board Budget TrainingGale A. Brewer
 
Financial Management in Local Government: A Top 10 Primer
Financial Management in  Local Government: A Top 10 PrimerFinancial Management in  Local Government: A Top 10 Primer
Financial Management in Local Government: A Top 10 PrimerCPLG
 
Davao bottom up budgeting
Davao bottom up budgetingDavao bottom up budgeting
Davao bottom up budgetingWBKDC
 
03. 2 the sangguniang barangay
03. 2 the sangguniang barangay03. 2 the sangguniang barangay
03. 2 the sangguniang barangayAlvin Almo
 
Bottom up budgeting-by_kuki
Bottom up budgeting-by_kukiBottom up budgeting-by_kuki
Bottom up budgeting-by_kukiWBKDC
 
STATE AND GOVERNMENT
STATE AND GOVERNMENTSTATE AND GOVERNMENT
STATE AND GOVERNMENTjundumaug1
 

What's hot (20)

Regional Government
Regional GovernmentRegional Government
Regional Government
 
Overview in Barangay Budgeting
Overview in Barangay BudgetingOverview in Barangay Budgeting
Overview in Barangay Budgeting
 
Bottom up Budgeting
Bottom up BudgetingBottom up Budgeting
Bottom up Budgeting
 
Local planning and budgeting linkage_version 2.0
Local planning and budgeting linkage_version 2.0Local planning and budgeting linkage_version 2.0
Local planning and budgeting linkage_version 2.0
 
Local Development Planning
Local Development PlanningLocal Development Planning
Local Development Planning
 
Rationalized Planning System
Rationalized Planning SystemRationalized Planning System
Rationalized Planning System
 
Summary udpfi
Summary udpfiSummary udpfi
Summary udpfi
 
Local development planning
Local development planningLocal development planning
Local development planning
 
Local government systems in punjab by lr 05032015
Local government systems in punjab by lr 05032015Local government systems in punjab by lr 05032015
Local government systems in punjab by lr 05032015
 
PH Local Government System
PH Local Government SystemPH Local Government System
PH Local Government System
 
Role of Local Government
Role of Local GovernmentRole of Local Government
Role of Local Government
 
Planning profession
Planning professionPlanning profession
Planning profession
 
Institutional framework comparative analysis case of pakistan & uganda
Institutional framework comparative analysis case of pakistan & ugandaInstitutional framework comparative analysis case of pakistan & uganda
Institutional framework comparative analysis case of pakistan & uganda
 
Manhattan Community Board Budget Training
Manhattan Community Board Budget TrainingManhattan Community Board Budget Training
Manhattan Community Board Budget Training
 
Financial Management in Local Government: A Top 10 Primer
Financial Management in  Local Government: A Top 10 PrimerFinancial Management in  Local Government: A Top 10 Primer
Financial Management in Local Government: A Top 10 Primer
 
Davao bottom up budgeting
Davao bottom up budgetingDavao bottom up budgeting
Davao bottom up budgeting
 
BIDP FE FINAL REPORT 1_July 11
BIDP FE FINAL REPORT 1_July 11BIDP FE FINAL REPORT 1_July 11
BIDP FE FINAL REPORT 1_July 11
 
03. 2 the sangguniang barangay
03. 2 the sangguniang barangay03. 2 the sangguniang barangay
03. 2 the sangguniang barangay
 
Bottom up budgeting-by_kuki
Bottom up budgeting-by_kukiBottom up budgeting-by_kuki
Bottom up budgeting-by_kuki
 
STATE AND GOVERNMENT
STATE AND GOVERNMENTSTATE AND GOVERNMENT
STATE AND GOVERNMENT
 

Viewers also liked

Esp ad matematicas_3
Esp ad matematicas_3Esp ad matematicas_3
Esp ad matematicas_3Isabel Cadiz
 
05 information support on national level (bbk) judex
05 information support on national level (bbk) judex05 information support on national level (bbk) judex
05 information support on national level (bbk) judexknow4drr
 
Vogue uk august_2016
Vogue uk august_2016Vogue uk august_2016
Vogue uk august_2016PrivetOUTLET
 
Lista De Proveedores
Lista De ProveedoresLista De Proveedores
Lista De Proveedoresguest6ca26c7
 
Nuevo mecanismo de evasión a estrés energético en melanoma
Nuevo mecanismo de evasión a estrés energético en melanomaNuevo mecanismo de evasión a estrés energético en melanoma
Nuevo mecanismo de evasión a estrés energético en melanomaRosaura Esteve-Puig, Ph.D.
 
Identificación automática de datos códigos qr (quick response code) activida...
Identificación automática de datos  códigos qr (quick response code) activida...Identificación automática de datos  códigos qr (quick response code) activida...
Identificación automática de datos códigos qr (quick response code) activida...mtcarda
 
Exploring the Connected Car
Exploring the Connected CarExploring the Connected Car
Exploring the Connected CarCognizant
 
Mesa Transformacion Digital y Competitividad - semanainformatica.com 2016 I P...
Mesa Transformacion Digital y Competitividad - semanainformatica.com 2016 I P...Mesa Transformacion Digital y Competitividad - semanainformatica.com 2016 I P...
Mesa Transformacion Digital y Competitividad - semanainformatica.com 2016 I P...COIICV
 
Moda club otoño invierno 2014 Mayrin
Moda club otoño invierno 2014 MayrinModa club otoño invierno 2014 Mayrin
Moda club otoño invierno 2014 MayrinModa Luisa Ivanova
 
2015 06-27 use-r2015_dendextend_tal_galili_01
2015 06-27 use-r2015_dendextend_tal_galili_012015 06-27 use-r2015_dendextend_tal_galili_01
2015 06-27 use-r2015_dendextend_tal_galili_01Tal Galili
 
Creando un servidor virtual con Ubuntu Server
Creando un servidor virtual con Ubuntu ServerCreando un servidor virtual con Ubuntu Server
Creando un servidor virtual con Ubuntu ServerAlejandro Moreno
 
Anatomía radiológica del corazón. Cuitláhuac arroyo r1 Cardiología
Anatomía radiológica del corazón. Cuitláhuac arroyo r1 CardiologíaAnatomía radiológica del corazón. Cuitláhuac arroyo r1 Cardiología
Anatomía radiológica del corazón. Cuitláhuac arroyo r1 CardiologíaInstituto Mexicano del Seguro Social
 
Beginner’s Guide to Windows Installer XML (WiX)
Beginner’s Guide to Windows Installer XML (WiX)Beginner’s Guide to Windows Installer XML (WiX)
Beginner’s Guide to Windows Installer XML (WiX)Alek Davis
 
Chlorophyll plus guarana - Presentation
Chlorophyll plus guarana - PresentationChlorophyll plus guarana - Presentation
Chlorophyll plus guarana - PresentationJeevanseva, Hyderabad
 
La economía familiar
La economía familiar La economía familiar
La economía familiar Jovanago
 
Manual instalación y configuración de elastix para comnutación telefónica
Manual instalación y configuración de elastix para comnutación telefónicaManual instalación y configuración de elastix para comnutación telefónica
Manual instalación y configuración de elastix para comnutación telefónicaEloy Aguilar Cardona
 

Viewers also liked (20)

Esp ad matematicas_3
Esp ad matematicas_3Esp ad matematicas_3
Esp ad matematicas_3
 
05 information support on national level (bbk) judex
05 information support on national level (bbk) judex05 information support on national level (bbk) judex
05 information support on national level (bbk) judex
 
Vogue uk august_2016
Vogue uk august_2016Vogue uk august_2016
Vogue uk august_2016
 
Lista De Proveedores
Lista De ProveedoresLista De Proveedores
Lista De Proveedores
 
Ngs presentation
Ngs presentationNgs presentation
Ngs presentation
 
Nuevo mecanismo de evasión a estrés energético en melanoma
Nuevo mecanismo de evasión a estrés energético en melanomaNuevo mecanismo de evasión a estrés energético en melanoma
Nuevo mecanismo de evasión a estrés energético en melanoma
 
Identificación automática de datos códigos qr (quick response code) activida...
Identificación automática de datos  códigos qr (quick response code) activida...Identificación automática de datos  códigos qr (quick response code) activida...
Identificación automática de datos códigos qr (quick response code) activida...
 
Exploring the Connected Car
Exploring the Connected CarExploring the Connected Car
Exploring the Connected Car
 
Mesa Transformacion Digital y Competitividad - semanainformatica.com 2016 I P...
Mesa Transformacion Digital y Competitividad - semanainformatica.com 2016 I P...Mesa Transformacion Digital y Competitividad - semanainformatica.com 2016 I P...
Mesa Transformacion Digital y Competitividad - semanainformatica.com 2016 I P...
 
Llistats per dictar
Llistats per dictarLlistats per dictar
Llistats per dictar
 
Perlas del libro de mormon
Perlas del libro de mormonPerlas del libro de mormon
Perlas del libro de mormon
 
Moda club otoño invierno 2014 Mayrin
Moda club otoño invierno 2014 MayrinModa club otoño invierno 2014 Mayrin
Moda club otoño invierno 2014 Mayrin
 
Alt func dl_vision
Alt func dl_visionAlt func dl_vision
Alt func dl_vision
 
2015 06-27 use-r2015_dendextend_tal_galili_01
2015 06-27 use-r2015_dendextend_tal_galili_012015 06-27 use-r2015_dendextend_tal_galili_01
2015 06-27 use-r2015_dendextend_tal_galili_01
 
Creando un servidor virtual con Ubuntu Server
Creando un servidor virtual con Ubuntu ServerCreando un servidor virtual con Ubuntu Server
Creando un servidor virtual con Ubuntu Server
 
Anatomía radiológica del corazón. Cuitláhuac arroyo r1 Cardiología
Anatomía radiológica del corazón. Cuitláhuac arroyo r1 CardiologíaAnatomía radiológica del corazón. Cuitláhuac arroyo r1 Cardiología
Anatomía radiológica del corazón. Cuitláhuac arroyo r1 Cardiología
 
Beginner’s Guide to Windows Installer XML (WiX)
Beginner’s Guide to Windows Installer XML (WiX)Beginner’s Guide to Windows Installer XML (WiX)
Beginner’s Guide to Windows Installer XML (WiX)
 
Chlorophyll plus guarana - Presentation
Chlorophyll plus guarana - PresentationChlorophyll plus guarana - Presentation
Chlorophyll plus guarana - Presentation
 
La economía familiar
La economía familiar La economía familiar
La economía familiar
 
Manual instalación y configuración de elastix para comnutación telefónica
Manual instalación y configuración de elastix para comnutación telefónicaManual instalación y configuración de elastix para comnutación telefónica
Manual instalación y configuración de elastix para comnutación telefónica
 

Similar to BUKOMERO TOWN COUNCIL URBAN INDICATORS REPORT 2014.

Uganda budgettransparency tomhart_en
Uganda budgettransparency tomhart_enUganda budgettransparency tomhart_en
Uganda budgettransparency tomhart_enicgfmconference
 
FY - 2014 PROGRAM YEAR CAPER FINAL DOC
FY - 2014 PROGRAM YEAR CAPER FINAL DOCFY - 2014 PROGRAM YEAR CAPER FINAL DOC
FY - 2014 PROGRAM YEAR CAPER FINAL DOCRichard J. Lott
 
Presentation on developmental plan
Presentation on developmental  planPresentation on developmental  plan
Presentation on developmental planRajat Nainwal
 
Smart City Mission & AMRUT.pptx
Smart City Mission & AMRUT.pptxSmart City Mission & AMRUT.pptx
Smart City Mission & AMRUT.pptxSachinArora190118
 
The Effect of Palembang City Government Readiness in Accepting The Transfer o...
The Effect of Palembang City Government Readiness in Accepting The Transfer o...The Effect of Palembang City Government Readiness in Accepting The Transfer o...
The Effect of Palembang City Government Readiness in Accepting The Transfer o...Trisnadi Wijaya
 
Planning and Implementation of Regularized Informal Settlements (Mkurabita), ...
Planning and Implementation of Regularized Informal Settlements (Mkurabita), ...Planning and Implementation of Regularized Informal Settlements (Mkurabita), ...
Planning and Implementation of Regularized Informal Settlements (Mkurabita), ...UNDP India
 
NBO - National Buildings Organization
NBO -  National Buildings OrganizationNBO -  National Buildings Organization
NBO - National Buildings Organizationshifhana aneezmohamed
 
Master plan
Master planMaster plan
Master planjoecely
 
City Life Vol VII report final
City Life Vol VII  report finalCity Life Vol VII  report final
City Life Vol VII report finalNikola Pavelić
 
Master Plan2
Master Plan2Master Plan2
Master Plan2sibale
 
To r lgcr 14-007
To r lgcr 14-007To r lgcr 14-007
To r lgcr 14-007Sopheak Sem
 
Department of City Planning - Community Planning Resources to Manhattan Commu...
Department of City Planning - Community Planning Resources to Manhattan Commu...Department of City Planning - Community Planning Resources to Manhattan Commu...
Department of City Planning - Community Planning Resources to Manhattan Commu...Gale A. Brewer
 

Similar to BUKOMERO TOWN COUNCIL URBAN INDICATORS REPORT 2014. (20)

INTERNSHIP Presentation.pdf
INTERNSHIP Presentation.pdfINTERNSHIP Presentation.pdf
INTERNSHIP Presentation.pdf
 
NYSA Bronchure
NYSA BronchureNYSA Bronchure
NYSA Bronchure
 
Uganda budgettransparency tomhart_en
Uganda budgettransparency tomhart_enUganda budgettransparency tomhart_en
Uganda budgettransparency tomhart_en
 
FY - 2014 PROGRAM YEAR CAPER FINAL DOC
FY - 2014 PROGRAM YEAR CAPER FINAL DOCFY - 2014 PROGRAM YEAR CAPER FINAL DOC
FY - 2014 PROGRAM YEAR CAPER FINAL DOC
 
ZIBUYILE MARTHA DLAMINI
ZIBUYILE MARTHA DLAMINIZIBUYILE MARTHA DLAMINI
ZIBUYILE MARTHA DLAMINI
 
Presentation on developmental plan
Presentation on developmental  planPresentation on developmental  plan
Presentation on developmental plan
 
Infallibles
InfalliblesInfallibles
Infallibles
 
Smart City Mission & AMRUT.pptx
Smart City Mission & AMRUT.pptxSmart City Mission & AMRUT.pptx
Smart City Mission & AMRUT.pptx
 
The Effect of Palembang City Government Readiness in Accepting The Transfer o...
The Effect of Palembang City Government Readiness in Accepting The Transfer o...The Effect of Palembang City Government Readiness in Accepting The Transfer o...
The Effect of Palembang City Government Readiness in Accepting The Transfer o...
 
CDBG Recommendations, 08-2013 Somerville, MA- Feldman
CDBG Recommendations, 08-2013 Somerville, MA- FeldmanCDBG Recommendations, 08-2013 Somerville, MA- Feldman
CDBG Recommendations, 08-2013 Somerville, MA- Feldman
 
Planning and Implementation of Regularized Informal Settlements (Mkurabita), ...
Planning and Implementation of Regularized Informal Settlements (Mkurabita), ...Planning and Implementation of Regularized Informal Settlements (Mkurabita), ...
Planning and Implementation of Regularized Informal Settlements (Mkurabita), ...
 
TOWN PLANNING
TOWN PLANNINGTOWN PLANNING
TOWN PLANNING
 
Government Finance Officers Association (GFOA) Budget Analysis
Government Finance Officers Association (GFOA) Budget AnalysisGovernment Finance Officers Association (GFOA) Budget Analysis
Government Finance Officers Association (GFOA) Budget Analysis
 
NBO - National Buildings Organization
NBO -  National Buildings OrganizationNBO -  National Buildings Organization
NBO - National Buildings Organization
 
Master plan
Master planMaster plan
Master plan
 
City Life Vol VII report final
City Life Vol VII  report finalCity Life Vol VII  report final
City Life Vol VII report final
 
Master Plan2
Master Plan2Master Plan2
Master Plan2
 
TSSSDP PPT
TSSSDP PPTTSSSDP PPT
TSSSDP PPT
 
To r lgcr 14-007
To r lgcr 14-007To r lgcr 14-007
To r lgcr 14-007
 
Department of City Planning - Community Planning Resources to Manhattan Commu...
Department of City Planning - Community Planning Resources to Manhattan Commu...Department of City Planning - Community Planning Resources to Manhattan Commu...
Department of City Planning - Community Planning Resources to Manhattan Commu...
 

BUKOMERO TOWN COUNCIL URBAN INDICATORS REPORT 2014.

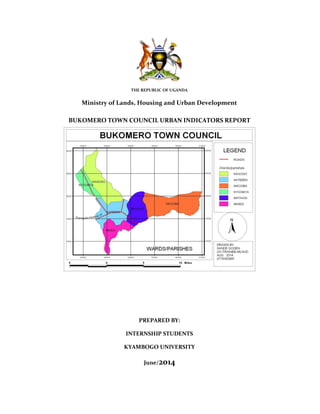
  • 1. THE REPUBLIC OF UGANDA Ministry of Lands, Housing and Urban Development BUKOMERO TOWN COUNCIL URBAN INDICATORS REPORT PREPARED BY: INTERNSHIP STUDENTS KYAMBOGO UNIVERSITY June/2014
  • 2. i Foreword I am pleased to present this report for the internship students Mr Wesigye Alex, Kakande Fred, Kulumba Brian, Kaweesi Samuel and Kemba Joseph from Kyambogo University. As part of their internship, the students were given an opportunity to collect urban indicators relating to various urban areas, to create the urban Indicators data base, to analyze and prepare a status report for one of the Town Councils. They carried out their internship from 17th June to 25th July 2014. Due to the limited time, the students could not go to the field to collect the indicators from each Urban Council. Instead they contacted all the Town Clerks for their email addresses after which the soft copy of the Urban Indicators Toolkit was sent to them for filling in with the necessary information. The Town Clerks were requested to assign one of their staff preferably the Physical Planner, to coordinate the exercise in their respective Urban Councils. They were given two weeks within which to submit the completed toolkit. It was noted however, that only twenty Urban Councils were able to return the completed Toolkits within the allotted time frame. The Students then checked the returns for completeness and verified the information that was provided by the Urban Councils. Thereafter, they created a database of the indicators for the twenty Urban Councils using Microsoft Excel. However, considering that the records were minimal and some of them lacked certain information, the students were advised to concentrate on one Urban Council whose return was fully completed compared to others. And this was Bukomero Town Council (BTC). The Students were guided in the preparation of the status report for Bukomero Town Council. The report was intended to present baseline indicators as at 2014 for purposes of comparison in future to measure the extent of change whether positive or negative. The Report is a joint effort by all the Students who shared out specific thematic areas to analyze and interpret the findings. They were also encouraged to refer to other secondary data sources to enrich their analysis. The report gives a profile of Bukomero Town Council which can serve as reference document to many parties who may be interested in
  • 3. ii investing in Bukomero. It also provides a basis for planning, priority setting and budgeting. It is hoped that annually the indicators will be compiled for purposes of monitoring the performance and evaluating the impact of policy decision adopted by the Council. The report is structured in three Chapters: the first Chapter covers the background and introduction which presents the location, the population, natural hazards while Chapter two presents analysis of findings on Land use, Land Tenure types and Demography and Chapter 3 outlines the recommendations and conclusions. I am glad to report that despite the limited time within which the exercise was undertaken, the students managed to get feedback from the Urban Councils, which enabled them to demonstrate the technical skills in data collection, analysis and reporting. I believe that this report will be helpful to inform the planning process in Bukomero Town Council. I wish to extend my gratitude to the supervisors of the students, and the officers in the Department of Urban Development for all the assistance provided to the team. Samuel Mabala Commissioner-Urban Development
  • 4. iii Acknowledgement We give thanks to the LORD JESUS CHRIST of Nazareth our GOD, LORD and SAVIOR for HIS wisdom, knowledge, understanding, insight and finances among others that HE has graciously given us throughout the production of this report. We wish to extend our sincere gratitude to the Commissioner for Urban Development (CUD), Mr. Mabala Samuel for his mentorship, guidance and supervision throughout the process of compiling this report. To our supervisor Ms. Nakiguli Devine Kibuuka for her unfailing love and support towards our internship training and compilation of this report And not forgetting Sande Goden and all the staff members of Urban Development MLHUD for being good, approachable and giving us a conducive Learning environment. No words can fully express how grateful we are. May the almighty GOD give you abundant blessings.
  • 5. iv List of Acronyms MLHUD Ministry of Lands, Housing and Urban Development CUD Commissioner of Urban Development UD Urban Development BTC Bukomero Town Council TC Town Council MS Microsoft Office UBOS Uganda Bureau of Statistics
  • 6. v Definition of key terms Household A person of group of persons who make common provision for food or other essentials of living, and often share a common budget. Land use Residential formal Includes land zoned residential or occupied by formal housing. Residential informal Includes land occupied by any informal or unplanned settlements. Business Refers to all commercial or industrial land, including land used largely for informal business activity. Services Refers to land used for government buildings, school, hospitals, electricity, water and other public amenities excluding transport Vacant Includes all land designated for development but not used for any particular purpose Other Includes all recreational or water areas normally counted as part of the city. Household tenure Formal ownership Owned refers to households with a clear title or ownership(formal housing) of the house and the land they occupy, possibly through a company structure or as condominiums or strata title, or long leasehold of land. Purchasing refer to owner-occupiers in formal housing with a formal mortgage over the property. Tenancy Private rental is households in informal housing for with rents are paid to a private landlord who is the legal owner. Social housing includes all households in public, parastatal or NGO-owned or operated housing, including government employee housing and housing owned or operated by co-operatives. Sub-tenancy refers to households who are renting from household who is also renting the premises. Squatter Squatter-without rent refers to households in squatter housing, or housing which has no title to the land on which it stands, and who pay no rent. Squatter-with rent refers to households in squatter who pay rent. Other Includes nomads, homeless, persons in institutions or hotels and any other tenure.
  • 7. vi Land tenure Public Refers to land which is owned by the government, used or not used for public purposes Private Refers to the exclusive possession of land by an individual or restricted group of people of the same family (couple, nuclear family, inheriting brothers and sisters, et.c) Other Refers to all other types of land rights such as customary rights et.c. Sources of income Taxes Include municipal rates and levies, any local taxes on the transfer of property, and any other taxes such as entertainment or hotel taxes, motor vehicle taxes, and on business, which do not reflect the direct provision of services. User- charges Include any local government charges for services provided, such as water, sewerage, refuse collection or building permits. Betterment levies should also be included. Other-own source income Includes interest and principal received, sales of capital items, (but not donations, voluntary contributions or aid). Transfers Include formula driven payments (such as repatriation of income tax) or other grant donations from national or state governments. Other income Includes any other income such as donations or aid. Housing production Defined as the net number of units produced (units produced minus units demolished) last year in both formal and informal sectors per 1000 population.
  • 8. vii Executive Summary Ministry of Lands, Housing and Urban Development has been spearheading the development of the National Urban Policy and Strategic Urban Development Investment Plan. It also created an Urban Indicators database in the process of developing the National Urban Policy for Uganda aimed at monitoring the performance of the urban Sector. The Ministry intended and still intends to update the urban indicators database to cover all the Municipalities, and Town Councils with current information about the key indicators. The indicators are necessary for: 1. Monitoring of performance of the respective urban authorities. 2. Establishment of the baseline status for purposes of local and international comparison. 3. Identification of good practices as well as key issues for policy intervention. 4. Selection of priority programmes and projects. 5. Review of progress towards achieving specific goals. 6. Assessment of impact of programs, projects and key policy interventions and above all 7. Development of the Urban Development Strategies. For this cause the Ministry sent out tool kits to about 174 town councils which they were to fill and send back (via electronic means) the completed forms. To our surprise only 11 complied. Not only, did the filled forms come late but also most of them were partially filled. For this reason the Commissioner, having looked at the data set, changed plan and decided on working on one town, whose data form had lesser spaces as compared to the rest and that town is Bukomero Town Council to work as a model town under this exercise. This report is generated based on the analysis of Bukomero Town Council data, which is located in Kiboga district in Uganda. The objectives of the study were to update the
  • 9. viii National Urban Indicators Data Base and to prepare the state of the Urban Sector Report for Uganda 2014 specifically Bukomero T.C. A Tool kit was sent to the Bukomero Town Clerk who filled it and sent back the filled form to the Ministry which data was then put in a data base analyzed. The data was entered and analyzed in MS Excel. The limitations in the entire process included delay in the receipt of feedback from the Town Council, empty fields and unrealistic responses in the sent back tool kits among others as indicated in Chapter one. The analysis of findings was done for demographic features, household incomes, land use, socio-economic development, health, education, infrastructure, transport, environment, crime and safety, local government, and housing indicators. Out put were presented in form of tables and charts as shown in chapter two. The recommendations include sensitization of Town Council officers on the essence of updating urban indicators database prior to data collection and adoption of methods which yield quicker feedbacks from respondents like sending urban officers to the field among others.
  • 10. ix Table of Contents Foreword.................................................................................................................................................i Acknowledgement................................................................................................................................ iii List of Acronyms................................................................................................................................... iv Definition of key terms ......................................................................................................................... v Executive Summary............................................................................................................................. vii List of Tables........................................................................................................................................ xii List of figures.......................................................................................................................................xiii CHAPTER ONE.....................................................................................................................................1 1.0 Background Information .................................................................................................................1 1.1 Location.............................................................................................................................................1 1.2 Natural Hazards ...............................................................................................................................1 1.3 Weather ............................................................................................................................................2 1.4 Nature...............................................................................................................................................2 1.5 Objectives of the study.....................................................................................................................2 1.6 Team Composition...........................................................................................................................2 1.7 Methodology.....................................................................................................................................3 1.8 Limitations .......................................................................................................................................3 CHAPTER TWO....................................................................................................................................4 2.0 Analysis of the Findings ..................................................................................................................4 2.1 Land use............................................................................................................................................4 2.2 Demography ....................................................................................................................................5 2.2.1 Population by sex ..........................................................................................................................5 2.2.2 Population by age group in Bukomero TC ..................................................................................6 2.2.3 Annual Population growth rate....................................................................................................7 2.3 Household........................................................................................................................................8 2.3.1 Household size ..............................................................................................................................8 2.3.2 Women headed household...........................................................................................................9 2.3.3 Household formation rate ............................................................................................................9 2.4 Household income distribution....................................................................................................10 2.5 Land tenure types ..........................................................................................................................11 2.5.1 Household tenure........................................................................................................................11 2.5.2 Total Land tenure .......................................................................................................................12 2.6 Social- economic Development ....................................................................................................12 2.6.1 Poor household ...........................................................................................................................12 2.7.0 Health sector...............................................................................................................................13 2.7.1 Hospital beds...............................................................................................................................13 2.8.0 Child mortality ...........................................................................................................................14 2.8.1 Child mortality ............................................................................................................................14 2.8.2 Life expectancy ...........................................................................................................................14
  • 11. x 2.9.0 Education....................................................................................................................................15 2.9.1 Adult literacy...............................................................................................................................15 2.9.2 School enrollment ......................................................................................................................16 2.10 Crime and safety...........................................................................................................................17 2.11.0 Infrastructure .............................................................................................................................17 2.11.1 Household connection................................................................................................................17 2. 11.2 Access to portable water ...........................................................................................................18 2.11.3 Infrastructure expenditure.........................................................................................................19 2.12.0 Transport ...................................................................................................................................20 2.12.1 Modal split..................................................................................................................................20 2.12.2 Travel time, Expenditure on road infrastructure and Automobile ownership.......................21 2.12.3 Length of road............................................................................................................................22 2.13.0 Environment..............................................................................................................................22 2.13.1 Waste water treated ...................................................................................................................22 2.14.1 Solid waste generated. ...............................................................................................................22 2.13.3 Disposal method for solid waste ...............................................................................................23 2.14.2 Regular solid-waste collection and the housing destroyed by disasters.................................24 2.15.0 Local government......................................................................................................................25 2.15.1 Source of income........................................................................................................................25 2.15.2 Local government per capita income .......................................................................................26 2.15.3 Per capita capital expenditure...................................................................................................27 2.16 Housing in compliance................................................................................................................27 CHAPTER THREE...............................................................................................................................29 3.0 CONCLUSIONS AND RECCOMENDATIONS ............................................................................29 3.1.1 Land use........................................................................................................................................29 3.1.2 Population by sex.........................................................................................................................29 3.1.3 Population by age-group.............................................................................................................29 3.1.4 Annual population growth rate ..................................................................................................29 3.1.5 Household size ............................................................................................................................30 3.1.6 Women headed households .......................................................................................................30 3.1.7 Household formation rate...........................................................................................................30 3.1.8 Household income distribution..................................................................................................30 3.1.9 Household tenure........................................................................................................................30 3.1.10 Total land tenure........................................................................................................................31 3.1.11 Poor household ...........................................................................................................................31 3.1.12 Informal employment ................................................................................................................31 3.1.13 Hospital beds..............................................................................................................................31 3.1.14 Child mortality...........................................................................................................................32 3.1.15 life Expectancy............................................................................................................................32 3.1.16 Adult literacy..............................................................................................................................32 3.1.17 School enrollment......................................................................................................................32 3.1.18 Crime and safety.........................................................................................................................32
  • 12. xi 3.1.19 Household connection...............................................................................................................32 3.1.20 Access to portable water ...........................................................................................................33 3.1.21 Infrastructural expenditure........................................................................................................33 3.1.22 Transport modal split................................................................................................................33 3.1.23 Travel time, expenditure on road infrastructure and auto mobile ownership .......................33 3.1.24 Waste Water treated .................................................................................................................33 3.1.25 Solid Waste generated...............................................................................................................34 3.1.26 Disposal methods for solid waste .............................................................................................34 3.1.27 Solid waste collection ................................................................................................................34 3.1.28 Housing destroyed per 1000 houses .........................................................................................34 3.1.29 Source of income.......................................................................................................................34 3.1.30 Local government per capita income .......................................................................................35 3.1.31 Per capita expenditure ...............................................................................................................35 3.1.32 Housing in compliance..............................................................................................................35 3.2.0 POLICY RECOMMENDATIONS ...............................................................................................35 3.2.1 Land use.......................................................................................................................................35 3.2.2 Population by sex........................................................................................................................35 3.2.3 Population by age-group ............................................................................................................36 3.2.4 Annual population growth rate................................................................................................36 3.2.5 Total land tenure ........................................................................................................................36 3.2.6 Hospital beds ..............................................................................................................................36 3.2.7 School enrollment.......................................................................................................................37 3.2.8 Crime and safety.........................................................................................................................37 3.2.9 Household connection ...............................................................................................................37 3.2.10 Access to portable water ...........................................................................................................37 3.2.11 Transport modal split.................................................................................................................38 3.2.12 Waste Water treated .................................................................................................................38 3.2.13 Housing in compliance..............................................................................................................38 References............................................................................................................................................39
  • 13. xii List of Tables Table 1: women headed households in Bukomero TC .................................................................9 Table 2: Household formation rate...............................................................................................9 Table 3: Income distribution........................................................................................................10 Table 4: Poor households.............................................................................................................12 Table 5: Informal employment.....................................................................................................13 Table 6: Hospital beds..................................................................................................................13 Table 7: Child mortality................................................................................................................14 Table 8: life Expectancy................................................................................................................14 Table 9: Adult literacy ..................................................................................................................15 Table 10: Crime and safety............................................................................................................17 Table 11: Access to portable water................................................................................................18 Table 12: Infrastructure expenditure............................................................................................19 Table 13: Length of road .............................................................................................................. 22 Table 14: Waste water treated..................................................................................................... 22 Table 15: solid waste collection ...................................................................................................24 Table 16: Housing destroyed per 1000 houses ............................................................................24 Table 17: Housing production .....................................................................................................28
  • 14. xiii List of figures AFigure 1: Land use in Bukomero TC ...................................................................................................4 Figure 2: Population by sex for Bukomero TC .................................................................................6 Figure 3: Population by age group in Bukomero TC........................................................................7 Figure 4: Annual population growth rate.........................................................................................7 Figure 5: Average household size in Bukomero TC .........................................................................8 Figure 6: Income distribution.........................................................................................................10 Figure 7: Household tenure ............................................................................................................11 Figure 8: Total land tenure .............................................................................................................12 Figure 9: School enrollment............................................................................................................16 Figure 10: Household connection ...................................................................................................18 Figure 11: Transport Modal split......................................................................................................20 Figure 12: Time, Expenditure on road infrastructure and Automobile ownership.......................21 Figure 13: Solid waste generated .....................................................................................................23 Figure 14: Disposal method for solid waste ....................................................................................23 Figure 15: Source of income.............................................................................................................25 Figure 16: Local government per capita income.............................................................................26 Figure 17: per capita capital expenditure........................................................................................27 Figure 18: Housing in compliance...................................................................................................28
  • 15. 1 CHAPTER ONE 1.0 Background Information 1.1 Location Bukomero Town Council is located in Kiboga district in Uganda. Kiboga is located approximately 140 kilometers (87 miles) northwest of Kampala, Uganda's largest city, on an all-weather tarmac highway linking Kampala to Hoima. This location lies approximately 95 kilometers (59 miles), by road, southeast of Hoima, the center of Uganda's petro chemical industry. The coordinates of Kiboga are: 0°55'03.0"N, 31°45'36.0"E (Latitude: 0.917500; Longitude: 31.7600). The population of Kiboga was estimated at approximately 12,000, during the 2002 national population census. In 2010, the Uganda Bureau of Statistics (UBOS) estimated the population of the town at about 16,600. In 2011, UBOS estimated the mid-year population of Kiboga at 17,400 persons. Bukomero TC has an average elevation of 1,213 meter above sea level. The area is mildly densely populated with 398 people per square kilometer. The nearest town larger than 50,000 inhabitants takes about 1:36 hour by local transportation. An estimated 2.11% of the children below 5 years old are underweight, with a mortality of 69 per 1,000 births. 1.2 Natural Hazards Bukomero TC experiences six strong earthquakes (on average one every 50 years), with occurrences at 5-6 Richter. When a strong earthquake occurs, it will most likely be felt by everybody; people may be frightened and run outdoors, walk unsteadily. Windows, dishes, glassware may be broken, and books fall off shelves. The damage will be slight. There is a very low occurrence of periods with extreme drought. Flooding risk is high.
  • 16. 2 1.3 Weather February is warmest with an average temperature of 29.4 °C at noon. July is coldest with an average temperature of 15.6 °C at night. Bukomero TC has no distinct temperature seasons; the temperature is relatively constant during the year. Temperatures drop sharply at night. December is on average the month with most sunshine. Rainfall and other precipitation peaks around May and July are driest months all around. 1.4 Nature Bukomero has a humid (> 0.65 p/pet) climate. The land area is not cultivated; most of the natural vegetation is still intact. The landscape is mostly covered with mosaic vegetation/croplands. The climate is classified as a tropical savanna (winter dry season), with a sub-tropical moist forest. The soil in the area is high in ferralsols, acrisols, nitosols, soil composed of kaolinite and quartz, enriched in iron and aluminium oxides. 1.5 Objectives of the study. i) To Establish Bukomero TC’s Urban Indicators Database ii) To prepare the Bukomero Town Council Urban Sector Report for Uganda 2014 1.6 Team Composition Name Designation Email/Telephone number Shibuta Mabala Samuel CUD Samuel.mabala@gmail.com 0772408744 Nakiguli Devine Kibuuka Economist-UD devinenaki@gmail.com 0756635003 Wesigye Alex Internee wesigyea@yahoo.com 0783171572 Kaweesi Samuel Internee samuelkaweesi90@gmail.com 0773931668 Kakande Fred Internee kakandefred32@gmail.com 0758075264
  • 17. 3 Kulumba Brian Internee briankulumba@gmail.com 0757680681 Kemba Joseph Internee jkemba12@gmail.com 0703083304 1.7 Methodology Telephone calls and emails were adopted for usage for this study. Telephone calls were made to the Bukomero Town Clerk to inform him of the Ministry’s intension of collecting, compiling and updating the Urban Indicators’ Database and informing him of his required input in the program. The Town Clerk’s input was to fill the Urban Indicators’ Toolkit. The Toolkit was sent to the Town Clerk via email. Data collection was done using a tool kit electronically by email. Officers made follow-up calls to remind the Town Clerk about the assignment. The town clerk filled the tool kit and then sent back the filled form via email. The filled form was then downloaded. Data entry and analysis was done in Microsoft office excel 2007. 1.8 Limitations The Town Officers had inadequate knowledge about the tool kit and even the urban indicators. We had to help an officer from Bukomero in explaining to her the entire tool kit. There was a delay in the receipt of feedback. This crippled the entire program since much of the time in the study were spent waiting for feedback yet time was limited. Some of the fields in the tool kit were not filled and hence empty fields affecting the quality of the data analyzed.
  • 18. 4 CHAPTER TWO 2.0 Analysis of the Findings This chapter concentrates on the analysis of the indicators as they are categorized in the tool kit. 2.1 Land use Figure 1: Land use in Bukomero TC Source: Bukomero Town Council Urban Indicators’ Survey July/2014 The Land use is measured in Square kilometers and it includes; residential, Business, Agriculture, services, transport, vacant land and other land use in the town council. The residential land includes all the built up land zones including open space and roads. This is further divided in to residential formal and residential informal. Majority of the land in the town council is occupied by informal settlements covering almost 3.5 Km2 and only 1
  • 19. 5 square kilometer is occupied by the formal settlement of the total land implying most of the people live in informal or unplanned settlements The biggest portion of the land is used for Agriculture compared to other activities in the town council and it goes up to 32.2 km2 implying that most of the people in Bukomero TC are much into agriculture. This is followed by other activities like recreational and wetlands that take up to 5.8 km2 . Institutional Services like government buildings, schools, hospitals among others take the third position with a total of 5.0 km2 . Transport take up the fourth position which includes roads, railways with only 4.0 km2 and lastly are business and vacant land which cover 2.0 km2 each. The economic implication of this type of land use pattern is that the major economic activity in Bukomero TC is Agriculture so if anything is to be done, should target mainly agriculture. The vacant land also means that more development is needed in the area. However, measures should be done to increase on the business activities for the rapid growth of the Town Council. 2.2 Demography Under this indicator we mainly focus on the population composition in terms of its age, gender among other variables. 2.2.1 Population by sex According to Uganda Urban Indicators Database 2014 Definition, Total population refers to the number of people living in a particular area regardless of their legal status or citizenship. The population is divided both by sex and different age groups. According to figure 2 below, 46 percent of the population was found out to be male while 54 percent are female corresponding to 9053 and 10651 people respectively. This shows that the population is somehow balanced when it comes to gender because the difference between the male number and that of the female is slight at a percentage of 8%.
  • 20. 6 Having more males than females in the town council negatively affects agriculture since in most cases it is women who are engaged in agriculture. Figure 2: Population by sex for Bukomero TC Source: Bukomero Town Council Urban Indicators’ Survey July/2014 2.2.2 Population by age group in Bukomero TC From the figure3 below, it shows that there are more people between the ages 25 to 59. This could be mainly associated with the immigrants into the Town Council from other nearby areas mainly for business as it’s the center of business in the area. There is also a balance between the male and the female in the age-bracket of 5 to 14 years. Whereas there is an imbalance between 15to 24 years, there are more female than the male. This could be due migration to better- off towns like Kakiri, Nansana or even Kampala. The population in the age bracket 60 and above is low which could be due to migration to villages like Temanakali because this group is not productive or even some die. The birth rates in the town council are also very low so the trend when it comes to birth rate is not threatening.
  • 21. 7 Figure 3: Population by age group in Bukomero TC Source: Bukomero Town Council Urban Indicators’ Survey July/2014 2.2.3 Annual Population growth rate Figure 4: Annual population growth rate Source: Bukomero Town Council Urban Indicators’ Survey July/2014
  • 22. 8 From figure 4, the Natural growth rate is 24% and net migration rate is 50% in the Town Council. The implication of net migration rate is that the movement of people from in and out of urban centre is equal and this implies that migration has no impact on the town council. The rate at which the population is increasing naturally is threatening because a 24 percent growth rate is too high meaning that in a short period of time people will have encroached on the conserved land. The net migration is 50% which is has a neutral effect on population growth. The rate at which the population of the urban agglomeration is growing is too high. Generally the growth rate of the population in the town council is too high and threatening so measures like family planning programmes, migration regulation measures should be adopted. 2.3 Household 2.3.1 Household size Figure 5: Average household size in Bukomero TC Source: Bukomero Town Council Urban Indicators’ Survey July/2014 From figure 5, the results imply that informal settlements are more than the formal settlements. Average household size is commonly used as a measure which is affected by
  • 23. 9 both number of children and the existence of shared households or extended families. On average, there are 4 people per household in the formal settlement of the Town Council and those of the informal settlement are 10people per household and this implies that household size is larger in informal sectors than in formal sectors meaning that the poor in Bukomero tend to be with larger families while the rich in the area tend to have smaller families. 2.3.2 Women headed household According to Uganda Urban Indicators Database 2014 Definitions, a woman headed household is one where the woman does not live with the husband. From the study, it shows that 10% of the household in the town council are headed by the women. This means that on every 100 households there are 10 households headed by the women. Table 1: women headed households in Bukomero TC % of women headed households 10 Source: Bukomero Town Council Urban Indicators’ Survey July/2014 2.3.3 Household formation rate This shows the annual growth rate of the number of households in the town council. This stands at 2.8 per Annam in Bukomero according to table 2 below. Since the growth is at that meaning that it’s a normal rate so the economic conditions in the town council are just average because 2.8% is just a normal growth rate. Table 2: Household formation rate Household formation rate (%) 2.8 Source: Bukomero Town Council Urban Indicators’ Survey July/2014
  • 24. 10 2.4 Household income distribution The household income distribution is divided into five quintile such that the each quintile is 20% of the income. From figure 6 below, we can see that the income disparity from one quintile to another is 0.16. This means that the incomes of the households tend to be at a stable level because a 0.16 is a small disparity. Further more according to the figure, the households in the first quintile have a higher income as compared to other quintiles.The trend is however threatening because its down ward sloping as the year goes on.Meaning that most of the households lie in the first quintile hence earn less income Figure 6: Income distribution Source: Bukomero Town Council Urban Indicators’ Survey July/2014 Extracted results below; Table 3: Income distribution Average income US$7.0265 Median income US$4.8075
  • 25. 11 Source: Bukomero Town Council Urban Indicators’ Survey July/2014 From the extracted results, it shows that the average income of all the households in Bukomero is 7.0265 dollars a year ans the median income is 4.8075 dollars a year. 2.5 Land tenure types 2.5.1 Household tenure This can be defined by the mode at which land is owned or held or the rate of relationships among people concerning the use of land. According to figure 7 below, the biggest part of the land is under formal ownership, constituting 56 percent of the total land in the town council. The tenants who pay for the use of the land take up the second position with a percentage of 29.The squatters take up 12 percent of the total land while the nomads, homeless, people in institutions or hotels and other tenure types cover 3 percent of the land. The biggest part of the land is under formal ownership simply because most of the land is owned on family basis (extended families) hence this could be the reason why the business activities in the town council are few. The tenants take the second position. These people pay for the use of the land from the land owners (landlords) Figure 7: Household tenure Source: Bukomero Town Council Urban Indicators’ Survey July/2014
  • 26. 12 2.5.2 Total Land tenure Figure 8 below shows the total land ownership in Bukomero Town council. It was observed that the largest land in the Town is owned by the private individuals or restricted group of people taking up to 61% of the total land. This is followed by the public whose structures and purposes cover 37% of the total land; lastly it’s the 2% that is covered by all other land rights such as customary rights. Since people have exclusive ownership of their land, then they use it for whatever they want. Figure 8: Total land tenure Source: Bukomero Town Council Urban Indicators’ Survey July/2014 2.6 Social- economic Development 2.6.1 Poor household Table 4: Poor households Household 8229 Poor house holds 1318 Poor Women headed households 75 Source: Bukomero Town Council Urban Indicators’ Survey July/2014
  • 27. 13 Since by 2002 Bukomero Town Council was not in existence, the only data that is available is for only 2014.There is a total of 8229 households in Bukomero of which 1318 are poor households s. Out of the 1318, there are 75 poor households headed by the women in the Town Council. 2.6.2 Informal employment Informal sector includes all persons employed in all unregistered commercial and non- commercial enterprises that have no formal structure in terms of organization (Uganda Urban Indicators Database Definitions 2014). From the table below, 80 percent of the people in the Town Council are employed informally meaning that out of every 10 people met, 8 of them are employed under the informal sector. Table 5: Informal employment Informal employment 80% Source: Bukomero Town Council Urban Indicators’ Survey July/2014 2.7.0 Health sector 2.7.1 Hospital beds This includes all the number of hospital beds both in private and public hospitals. This is shown in the table below. Table 6: Hospital beds No of Public hospital beds 50 No of Private hospital beds 10 Total 60 Number of persons per bed 328.4 Source: Bukomero Town Council Urban Indicators’ Survey July/2014 From the above, there are 50 beds in the public hospitals while those in the private hospitals are only 10. Therefore out of the total population of 19704 people in the town, on average each bed accommodates a number of 328.4 people. However this can
  • 28. 14 symbolize that there is need to increase on the number of hospitals and the beds in the Town Council. 2.8.0 Child mortality 2.8.1 Child mortality This indicator mainly looks at the children that die before their fifth birth day but above the first birthday. (Uganda Urban Indicators Database Definitions 2014) Table 7: Child mortality Gender Mortality in percentage (%) Female 3 Male 5 Total 8 Source: Bukomero Town Council Urban Indicators’ Survey July/2014 From table 7 above, it was found out that on every 100 girls(female) 3 of them die before celebrating their fifth birthday while on every 100 boys(male) 5 die before the fifth birth day in a year. Therefore out of every 100 children in the Town Council above one year but less than five years 8 of them die. However the male die more than the female standing at 5 percent and 3 percent respectively in a year. 2.8.2 Life expectancy According to Uganda Urban Indicators Database Definitions 2014, life expectance at birth is defined as the number of years a new born infant would live if the prevailing patterns of mortality at the time of birth remain the same throughout the child’s life. Table 8: life Expectancy Life Expectancy (years) Male Female Average 57 59 58 Source: Bukomero Town Council Urban Indicators’ Survey July/2014
  • 29. 15 Table 8 above indicate that the life expectancy of females(59 years) is more bthan that of males(57years) meannig that on average a woman lives for 2 more years than a man. This could be becaues generally women take good care of themselves for example by eating good meals, using good skin care products for their skins among others while men often wear them selves working the welfare of their families. Probably the government of uganda could sensitize men to as well care about themselves visa vis their families 2.9.0 Education This indicator mainly looks at the schools generally, that is, adult literacy, school enrollment ratio, and the number of class rooms. 2.9.1 Adult literacy Under this indicator we are trying to look at the percentage of the person’s age 15 years and above who can both read and write a short simple statement on their everyday life. Table 9: Adult literacy Gender Adult literacy rate (%) Male 50 Female 33.2 Total 83.2 Source: Bukomero Town Council Urban Indicators’ Survey July/2014 In reference to table 9 above, it was observed that 50 percent of the male were literate out of the total population of the adults in the town council. Meaning that n every 10 males found, 5 of them are literate but there are only 33.2 percent of the female that are literate which simply means that out of every 10 female met, only 3 are literate. There is a big gap between the literate male and the female so much is needed to close the gap between the two groups. However, the adult literates constitute 83.2 percent of the total population of the adults in the town council
  • 30. 16 2.9.2 School enrollment This indicator looks at the number of students, by sex, enrolled in a level of education whether or not they belong in the relevant age group for that level, as a percentage of the population in the relevant group for that level. From figure 9 below, 80 percent are enrolled in the primary level, 30 percent are enrolled in the secondary level while only 3 percent are enrolled in the tertiary level of education. However, the average rate of school enrollment stands at only 37.7 percent in the town council which is below average meaning that few people seek education. Figure 9: School enrollment Source: Bukomero Town Council Urban Indicators’ Survey July/2014 Since there are few class rooms, there is great need for construction of new class room blocks in the Town Council.
  • 31. 17 2.10 Crime and safety Under this indicator, we will look at the reported crimes (number of victims, male and female annually per 1000 population). Table 10: Crime and safety Crimes Number of victims per 1000 Murders 1 Thefts 219 Rape 2 Source: Bukomero Town Council Urban Indicators’ Survey July/2014 From table10 above, it was found out that, out of 1000 victims observed only 1 is charged with murder, 219 victims are charged over theft and only 2 out of 1000 are charged with rape. Therefore most of the crimes are mainly in theft related cases. This could be due to unemployment which makes people to resort to stealing for a living. Therefore the government of Uganda should establish measures that reduce the unemployment rate for example by emphasizing on vocational training in order to release job creator graduates other than job seekers in the labour market. 2.11.0 Infrastructure Percentage of households directly (in their house or dwelling) connected to water, sewerage, electricity and telephone. These are the primary indicators of access by households to the principal networked services. 2.11.1 Household connection Here we look at the percentage of households directly connected to water, sewage, electricity and Telephone. The figure 10 below is developed based on a time series information basically after 22 years but since by then there was no Bukomero Town Council so the only information provided is for 2002 and 2014.Basing on telephone connection, in 2002 there were only 20 percent households connected but there has been a sharp increase to 50 percent of the household connection. This means that on every 10
  • 32. 18 households found, 5 have telephone connection. The electricity connection is still low from 10 percent in 2002 to 30 percent in 2014.This is however a very low rate because it is below the average. However water connection is very poor in the Town Council with 20 percent of the households from 5 percent in 2002.There is no sewage connection in the Town Council. Figure 10: Household connection Source: Bukomero Town Council Urban Indicators’ Survey July/2014 Bukomero as a Town Council was not in existence by 2002. Telephone connection has the highest percentage (50%) followed by electricity (30%) and then water (20%) 2. 11.2 Access to portable water This is defined as the daily household consumption of water per person in m3 (or 1000 liters) Consumption of water per person depends on the availability and price of water, the climate, and the uses to which water is customarily put by individuals (drinking, bathing, washing, and gardening). Consumption only includes household use (excludes industrial and agricultural use) in the Town Council. Table 11: Access to portable water Year Access to portable water (%) 2014 20
  • 33. 19 2002 5 1992 No data Source: Bukomero Town Council Urban Indicators’ Survey July/2014 The trend in which portable water has been made accessible to the people has been increasing over time as shown in table 11 above. Connection in 1992 is not known. In 2002, the accessibility rose to 5% and in 2014 the accessibility stands at 20 percent. However this access is still too low meaning that at every 10 households only 2 households have access to the portable water. 2.11.3 Infrastructure expenditure Defined as the ratio of total expenditures in US dollars by all levels of government (including private utilities and parastatals) on infrastructure services during the current year, and the urban population. Infrastructure includes operations, maintenance, and capital expenditures on physical infrastructure such as urban roads, railways, sewerage, drainage, water supply, electricity, and garbage collection, but not social infrastructure such as health and education expenditure. Table 12: Infrastructure expenditure Total expenditure on infrastructures US $6250 Total population 19704 Infrastructure per capita 3.5264 Source: Bukomero Town Council Urban Indicators’ Survey July/2014 Infrastructure expenditure includes all the expenses incurred by the government including operation, maintenance and capital expenditure on physical infrastructure. On a total of 19704 people, US$6250 is spent on infrastructures of which the per capita infrastructure expenditure is 3.5264 US Dollars
  • 34. 20 2.12.0 Transport 2.12.1 Modal split Proportion of work trips undertaken by the modes below. Several modes could be used for the same work trip. The main mode should be accounted for only. Private cars include any motorised vehicle exclusively used for private purposes. Bus or minibus includes road vehicles other than cars taking passengers on a fare paying basis. Other includes ferry, taxi, animal or rickshaw. Under this indicator, we are looking at the various modes of transport that are used by the people for the work trips. The highest ranked under this are the non-motorized that include bicycles and walking taking up 20 and 35 percent respectively meaning that people mainly use non-motorized means. This is followed by the private motorized means which include motorcycles and private cars. In this category, 20 percent used motorcycles while 5 percent use private cars for work trips. In the third place we have the buses and minibuses where the people usages of minibuses stand at 20 percent while that of the buses is 0 percent. There are no people in the town council that use trains and trams for their work trips. Figure 11: Transport Modal split Source: Bukomero Town Council Urban Indicators’ Survey July/2014
  • 35. 21 The biggest percentages of the workers walk to work (35%), followed by 30% who use motorcycles. 2.12.2 Travel time, Expenditure on road infrastructure and Automobile ownership According to Uganda Urban Indicators Database Definitions 2014, Travel time is the average time in minutes for a one-way trip, Expenditure on road infrastructure is the per capita expenditure in US dollars on roads while the automobile ownership is the ratio of automobiles to 1000 population. According to figure12 below it only takes 30 minutes for a person to reach the work place, the total number of automobiles is 150 per 1000 people in the town councils and the per capita expenditure on the roads is 0.756 dollars. Therefore much should be done to improve on the transport in the Town Council to reduce the time spent on work trips for example most of the people walk to work therefore by introducing the buses and even minibuses can help to reduce the time spent on the work trip. Figure 12: Time, Expenditure on road infrastructure and Automobile ownership Source: Bukomero Town Council Urban Indicators’ Survey July/2014
  • 36. 22 2.12.3 Length of road This indicator looks at the how long the roads are (length of roads) in the town council and it measures them in kilometers. Table 13: Length of road Year Length of roads( kilometers) 2014 75 Source: Bukomero Town Council Urban Indicators’ Survey July/2014 From table13 above, the length of the roads in Bukomero are 75 kilometers meaning that the transport is made easier as time goes by making the transportation of agricultural products easier. 2.13.0 Environment This involves waste water treated, solid waste generated, disposal methods for solid waste, regular solid-waste collection and housing destroyed by disasters. 2.13.1 Waste water treated This looks at percentage of waste water undergoing treatment in the Town Council that includes primary, secondary and tertiary treatment. In reference to table 14 below, the percentage of waste water under treatment was found out to be 5 percent in 2014. Table 14: Waste water treated Year Wastewater treated (%) 2014 5 Source: survey carriedout in Bukomero Town Council 2.14.1 Solid waste generated. This indicator looks at the solid waste generated per person in cubic meters and tones per annum From the figure 13 below, the volume wastes was 2.4 cubic meters per year and the weight of the wastes was 0.10 tones per year. Due to the development and
  • 37. 23 increase in the economic activities in the town council, the volume and weight of the wastes has increased as compared to that I the 2002. The volume is 4 cubic meters while the weight is 0.10 tones per year per person. Figure 13: Solid waste generated Source: Bukomero Town Council Urban Indicators’ Survey July/2014 2.13.3 Disposal method for solid waste Proportion of solid wastes by weight disposed to the categories below: Sanitary landfill, Incinerated (in incineration plants), Open dump, Recycled, Burned (openly) among others. Figure 14: Disposal method for solid waste Source: Bukomero Town Council Urban Indicators’ Survey July/2014
  • 38. 24 According to figure 14 above, it was found out that there were no proper method of disposal that were used in 2002 that is why the sanitary lands fill and open dump stand at 0 percent. In 2014, sanitary landfill stand at 50 percent, open dump is at 30 percent and the burned (openly) take up 20 percent however there is no use of incinerators and recycling in the town. There are some corrections that should be made on the way wastes are disposed off for example hospital wastes should disposed in incinerators because they are contagious and harmful to people. Recycling of waste has a great potential and need to be promoted in the Town council. 2.14.2 Regular solid-waste Collection and the Housing Destroyed by Disasters These two indicators, one looks at the proportion of households enjoying regular waste collection that is the regular solid-waste collection and the housing destroyed by disasters. Table 15: solid waste collection Households with regular solid-waste collection(% of households) 80 Source: Bukomero Town Council Urban Indicators’ Survey July/2014 This means that out of every 100 houses in the town council, 80 of them regularly collect their solid- waste either by dump masters or to the carry garbage. Housing Destroyed in the last ten years This is defined as the proportion of housing stock destroyed per thousand by natural or man-made disasters over the past ten years. This indicator measures the exposure of the housing stock to disasters and its ability to withstand these disasters. Table 16: Housing destroyed per 1000 houses Housing destroyed per 1000 houses(last 10 years) 20 Source: Bukomero Town Council Urban Indicators’ Survey July/2014
  • 39. 25 In the past ten years, 20 houses in Bukomero have been destroyed by storm, bush fire or earth quake. 2.15.0 Local government This is a form of quasi-government organization which exists to deliver services locally. The Town Council has only one local government unit in existence. 2.15.1 Source of income Figure 15: Source of income Source: Bukomero Town Council Urban Indicators’ Survey July/2014 This cover the percentage revenue in each category including taxes ,user charges including any local charges for services provided such as water refuse collection and building permits ,other own sources including interest and principal received , and sales of capital items ,any local taxes on the transfer of property ,other incomes including any income such as donation or aid `and borrowing including loans . The local government of the town council gets a big percentage of its revenue from other own source income include the interest and principal received at 50% than other sources of revenue.
  • 40. 26 2.15.2 Local government per capita income Figure 16: Local government per capita income Source: Bukomero Town Council Urban Indicators’ Survey July/2014 Per capita income includes the capital in us dollars and averaged over the last three years. In 2012 the per capita income was US $558.139, in 2013, the per capita income was US $744.185 (i.e. with an increment of US $186.045 per capita income from the previous year) and the per capita income for 2014 is US $930.23(i.e. with an increment of US $186.045 per capita income from the previous year) implying that the increment of the per capita income for both years (i.e2013 and 2014) are approximately the same (i.e. US $186.045.) The 3 years average i.e. (2012-14) is US $744.185 which is equivalent to per capita income of the year 2013.
  • 41. 27 Figure 17: per capita capital expenditure Source: Bukomero Town Council Urban Indicators’ Survey July/2014 2.15.3 Per capita capital expenditure This concerns the capital expenditure in US dollars per person, by a local government and Averaged over the last three years. In reference to figure 17 above, in 2012 the per capita expenditure was US $697.614 which was low. For the year2013, the per capita expenditure was US $ 1023.255 (i.e. with an increment of US $325.641 per capita expenditure from the previous year), and the per capita expenditure for the year 2014 is US $1162.79 (i.e. with an increment of US $139.535 per capita expenditure from the previous year) and on 3 year average the per capita expenditure is US $961.219. 2.16 Housing in compliance This indicator refers to urban housing, and measures the extent to which the urban population is housed legally. Only housing which both has a clear title to the land on
  • 42. 28 which it stands, and which is constructed with all required building, land use, or land subdivision permits is regarded as in compliance. The housing compliance in 2014 and 2002 is 10 % and 5%respectively the implication is that houses in 2014 have more clear title to the land on which it stands compared to those of 2002. Figure 18: Housing in compliance Source: Bukomero Town Council Urban Indicators’ Survey July/2014 Table 17: Housing production This concerns the number of dwellings produced annually, both formal and informal per 1000 population Formal housing produced(000) informal housing produced(000) Total 241 976 1217 Source: Bukomero Town Council Urban Indicators’ Survey July/2014 As shown in table 17 above, informal housing produced 976000 while formal produced were 241000 units.
  • 43. 29 CHAPTER THREE 3.0 CONCLUSIONS AND RECCOMENDATIONS ON THE FINDINGS 3.1.1 Land use The biggest portion of land Bukomero Town council is used for agriculture(32.2Km2 ), followed by other activities (5.8Km2 ) which include recreational or water areas , followed by services(5Km2 ) which include land for government buildings, schools, hospitals, electricity, water and other public amenities excluding transport , Transport covers 4Km2 and then Residential informal covers 3.5Km2 as referenced from figure 1. 3.1.2 Population by sex As shown in figure 2, the biggest percentage of people in Bukomero Town Council is females constituting 54% while the males constitute 46% of the Town Council. 3.1.3 Population by age-group The biggest numbers of people in Bukomero are those in the age bracket of 25-59 years, followed by those in the 15-24 years and 5-14 years. Those in 0-4 and 60+ years are the minority in the town council as shown in figure 3. Meaning that the vulnerable population is low. The working age is dominant. 3.1.4 Annual population growth rate According to figure 4, the annual population natural growth rated is 24% and the net migration rate is 50%.
  • 44. 30 3.1.5 Household size In reference to figure 5, it is shown that the informal settlement is more than the formal settlements. 3.1.6 Women headed households Table1 shows that the percentage of women headed households in the town council is 10%. This means that 10% of the households are headed by women in the Town council. 3.1.7 Household formation rate The household formation rate is 208% as shown in table 2. This implies that the annual rate of growth of numbers of households is 2.8%. 3.1.8 Household income distribution Form table3, it is shown that the average income of the people is Us$7.0265 and the median income is US$4.807. 3.1.9 Household tenure In Bukomero, as shown in 7, the biggest percentage of household tenure is formal ownership(56%) which include owned which refer to households with a clear title or ownership of the house and land they occupy and purchasing which refer to owner- occupiers in formal housing with a formal mortgage over the property. Tenancy is the second with 29%. Tenancy comprises of private rental which refer to households in (formal) housing for which rents are paid to a private land lord who is the legal owner, social housing which includes all households in public, parastatal or NGO- owned or operated housing including government employee housing and housing owned or operated by co-operatives; and sub-tenancy which refers to households who are renting from another household who is renting the premises.
  • 45. 31 12% of the households are squatters. Squatters comprise of squatter- without rent which refers to households in squatter housing, or housing which has no title to the land on which it stands, and who pays no rent; and squatter-with rent which refers to households in squatter housing who pay no rent. 3% of the households are in other tenure which includes nomads, homeless, and persons in institutions or hotels among others. 3.1.10 Total land tenure The biggest percentage of the land tenure private(61%) meaning that most of the land is exclusively possessed by an individual or restricted group of people of the same family(couple, nuclear family, inheriting brothers or sisters and so on). 37% of the land is owned by the government, used for public purposes and 2% of the land is other tenure such as other land rights like customary rights among others as shown in figure 8. 3.1.11 Poor household According to table 4, the number of poor households in Bukomero is 8229 Household and poor women headed households are 75 households. 3.1.12 Informal employment Table 5 reveals that out of every 10 people in the Town Council, 8 of them are employed in the informal sector. 3.1.13 Hospital beds There is a total of 60 hospital bed in Bukomero Town Council as shown in table 6. Out of the 60 beds, 50 are in public hospital whereas 10 are in private hospitals.
  • 46. 32 3.1.14 Child mortality The female child mortality (3%) in the Town Council is lower than the male child mortality (5%) and the total child mortality is 8% as shown in table 7. Out of 100 births 8 of them die before their 5th birth day. 3.1.15 life Expectancy Women in Bukomero live longer than their male counterparts by 2 years and the average life expectancy of the people in the Town councils is 58 years as shown in table 8. 3.1.16 Adult literacy From table 9, male adult literacy rate (50%) is greater than the female adult literacy (33.2%) by 16.8%. the total adult literacy rate is 83.2% meaning that out of 10 adults, 8 of them are literate. 3.1.17 School enrollment The school enrollment is in primary level 80%, in secondary level it is 30% and tertiary enrollment is 3% and the average enrollment is 37.7% a shown in figure 9. This percentage is very low meaning few people go to schools. 3.1.18 Crime and safety Out of 1000 crime victims in the Town Council, 1 is a victim of murder, 219 are victims of theft and 2 are victims of rape as shown in table 10. This shows a high rate of theft in the Town Council. 3.1.19 Household connection In reference to figure 10, in 2002, 20% of households were connected with Telephone, 10% with Electricity, and about 5% with water while in 2014 50% were connected with Telephone, 30% with Electricity and 20% with water. There is no household connected
  • 47. 33 with sewerage since 2002. This data shows that there is an improvement in household connection. 3.1.20 Access to portable water In 2002 accessibility to portable water was at 5% and in 2014 it rose to 20% as shown in table11. This means that out of 10 households, 2 have access to portable water in the Town Council. The situation is really alarming. 3.1.21 Infrastructural expenditure On a total of 19704 people in the Town council, US$6250 is spent on infrastructures of which the per capita infrastructure expenditure is 3.5264 US Dollars as shown in table 12. 3.1.22 Transport modal split As shown in figure 11, the biggest percentage of workers walk to work(35%), followed by those who use motor cycles(30%), bicycles (20%), minibuses (10%) and 5% use private cars. No one uses train, tram and neither bus. 3.1.23 Travel time, expenditure on road infrastructure and auto mobile ownership It takes 30 minutes for a person to reach his or her place of work. The total number of automobiles per 1000 population is 150 and the per capita expenditure on road is US$0.756 in the Town Council as shown in figure 12. 3.1.24 Waste Water treated In reference to table 14, the percentage of waste water under treatment is 5 percent in the Town Council. This percentage is low and there is need for more to be done.
  • 48. 34 3.1.25 Solid Waste generated As shown in figure 13, in 2002 the solid waste generated had a volume of 2.4m3 /per/year and a weight of 0.1 tonnes/per/year whereas in 2014 it rose to 4m3 /per/year and 0.18 tonnes/per/year respectively. 3.1.26 Disposal methods for solid waste In Bukomero Town Council, 50% of the solid waste is disposed by using sanitary fill, 30% in open dump and 20% is openly burned. No incinerators are used and neither recycling is done as well illustrated in figure14. 3.1.27 Solid waste collection In the Town Council, 80% of households are involved in regular solid waste collection as shown in table 15. This is a good percentage meaning that there is better disposal of cabbage in Bukomero. 3.1.28 Housing destroyed per 1000 houses 20 houses have been destroyed per 1000 houses in the last ten years in the Town Council as shown in table 16. These houses were destroyed by storms, bush fires and earth quake. 3.1.29 Source of income The biggest source of income in Bukomero is other-own sources (50%) which include interest and principals received sales of capital items among others. Taxes in the Town Council carry 30% of the income which include municipal rates and levies, any local taxes on the transfer of property and any other taxes such as entertainment or hotel taxes, motor vehicle taxes, and taxes on business, other income which include donations or aid constitute 13%, user charges take 4% which include any local government charges for services provided such as water, sewerage, refuse collecting or building permits, betterment levies should be included, transfers contribute 2% which include formula driven payments such as repatriation of income or other grant donations from national
  • 49. 35 or state government. And borrowing contributes 1% of the town council’s income as shown in figure 15. 3.1.30 Local government per capita income In Figure 16, the trend line shows that the per capita income increased form US$558.139 in 2012 to US$744.185 in 2013 which rose to US$930.23 in 2014. 3.1.31 Per capita expenditure As referenced from figure 17, Per capita expenditure of Bukomero increased from US$697.614 in 2012 to US$1023.255 in 2013 and further increased to US$1162.79 in 2014. This implies a continuous increase in expenditure over the years. 3.1.32 Housing in compliance The Housing in compliance in the Town Council increased from 5% to 10% in 2002 and 2014 respectively as shown in figure 17. This shows that in 2014 only 10% of the housing stock are in compliance with the current regulations (authorized housing). 3.2.0 POLICY RECOMMENDATIONS 3.2.1 Land use As shown in figure1 the biggest percentage of the land is used for agriculture, therefore the government of Uganda should pass legislations that favour the agricultural activities. The government should create invectives for agriculture such as tax holidays on agricultural inputs such as seeds, fertilizer among others. 3.2.2 Population by sex The biggest percentage of people in Bukomero is females (54%). This could probably be due to the high mortality rates of men among other reasons. As revealed in land us above, that agriculture is the major land use activity and most often it is women are
  • 50. 36 dominant in agriculture, therefore The government of Uganda should promote agriculture in the Town council. 3.2.3 Population by age-group People in the age bracket of 25-59 are the dominant age group ij the Town Council then followed by those in 15-24 age groups. The population is dominated by the youth who are labour force and the young and very old are the minority, therefore the government of Uganda should pass policies geared at catering the needs of the labour such as employment among others. 3.2.4 Annual population growth rate The government of Uganda should sensitize the resident in the Town Council on the importance of a small family and the impacts of an over populated country such that they could produce few children as the natural growth of the population is at 24%. 3.2.5 Total land tenure The biggest patch of land tenure is privately possessed which may lead to problems of absentee landlord who hinder development of the land. The government of Uganda therefore should revise the land tenure system to give potential land users to use it for production. 3.2.6 Hospital beds The number of persons per bed in the Town Council is 328. This data shows that the situation in the hospital is alarming due to congestion. The government of Uganda should allocate more funds to the health sector for the purchase of hospital beds.
  • 51. 37 3.2.7 School enrollment Statistics have revealed that School enrollment rate in the Town Council is 37.7% which is a very low percentage. This shows that few people actually go to schools. The government of Uganda should sensitize parents to send their children to school. More so since the class rooms are few, the government also needs to allocate more funds to the Education Ministry to cater for the construction of new class rooms blocks in the Town council and the construction of new class rooms mean more teachers will also be required. 3.2.8 Crime and safety The theft in the Town Council is a bit threatening so the Police should make more enforcement to harmonize the situation. 3.2.9 Household connection It is only 30% of households connected with Electricity. Thus the Government’s campaign of rural Electrification should be fueled to cover atlesat one major trading centre in a sub county. There is also need for sewerage connection in the Town Council because data reveals that there is so far no connection. 3.2.10 Access to portable water The government of Uganda should establish projects aimed at setting water point or boreholes or any other source of water for the residents in the town council because statistics have shown that accessibility to portable water stands at 20%.
  • 52. 38 3.2.11 Transport modal split In the Town Council most people walk to work or use motorcycle or bicycles. The government of Uganda should purchase buses for worker to use for their work trips as this would probably reduce on the travel time to work place. 3.2.12 Waste Water treated Only 5% of the waste water is treated in the Town Council, therefore the Government of Uganda should set up priority programmes to cater for the waste water treatment. 3.2.13 Housing in compliance Only 10% of the housing stocks in the Town Council are in compliance with the current regulations (authorized housing). This show there is a big problem in Urban Planning of the Town Council. The ministry of Lands, Housing and Urban Development should co- ordinate with Local Government to properly plan for urban centers.
  • 53. 39 References  Bukomero Town Council Urban Indicators Database 2014.  www.chinci.com.  UN Habitat Global Urban Indicators Database  Bukomero Town Council comprehensive five year development plan.