Studies of dissolved carbohydrates (or carbohydrate - like substances) in an estuarine environment

Variations in concentrations of dissolved sugars were studied along the salinity gradient of a small estuary (Elorn, Bay of Brest, France) from February 1985 to January 1986. Total dissolved carbohydrate (TDCHO) and dissolved monosaccharides (MCHO) were measured by the methods of Burney and Sieburth and Johnson and Sieburth respectively. It must be noted that these methods cannot distinguish between carbohydrates and carbohydrate-like substances; consequently, these methods probably do not closely reflect biologically available pools of carbohydrates. In the river, TDCHO and MCHO values ranged from 230 to 970 /ig C 1"' and from 75 to 450 ngC\-^ respectively. In the estuary, TDCHO and MCHO were usually lower; they varied respectively from 20 to 570 /zg C 1~' and from 0 to 180/ig C1 '. In June, some TDCHO values were much higher, probably because some polysaccharide was produced at this time by phytoplankton excretion or lysis. The relationship between Cl%o and TDCHO was dependent on the seasons. TDCHO was conservative in autumn, winter and early spring. TDCHO and DOC concentrations were fairly well correlated during the same period. Similar results have been previously reported by various workers. MCHO and TDCHO concentrations were well correlated throughout this study except in June. From these results, it was concluded that most dissolved carbohydrates were linked to a conservative fraction of the organic matter in periods of low biological activity, whereas newly biosynthesised carbohydrates were responsible for non-conservative behaviour.

Recomendados
Recomendados
Más contenido relacionado
La actualidad más candente
La actualidad más candente (20)
Destacado
Destacado (20)
Similar a Studies of dissolved carbohydrates (or carbohydrate - like substances) in an estuarine environment
Similar a Studies of dissolved carbohydrates (or carbohydrate - like substances) in an estuarine environment (20)
Más de Jubilado de la Universidad de Oriente (UDO), Venezuela.
Más de Jubilado de la Universidad de Oriente (UDO), Venezuela. (20)
Último
Último (20)
Studies of dissolved carbohydrates (or carbohydrate - like substances) in an estuarine environment
- 1. Marine Chemistry, 32 (1991) 19-35 Elsevier Science Publishers B.V., Amsterdam 19 Studies o f dissolved carbohydrates ( o r c a r b o h y d r a t e - l i k e substances) i n a n estuarine e n v i r o n m e n t * W i l l i a m Senior** and Lionel Chevolot*** Laboratoire d'Oceanographie Chimique, URA CNRS 322, Universite de Bretagne Occidentale, 6, avenue le Gorgeu, 29287Brest Cedex (France) (Received February 13, 1989; revision accepted May 28, 1990) ABSTRACT Senior, W. and Chevolot, L., 1991. Studies of dissolved carbohydrates (or carbohydrate-like sub- stances) in an estuarine environment. Mar. Chem., 32: 19-35. Variations in concentrations of dissolved sugars were studied along the salinity gradient of a small estuary (Elorn, Bay of Brest, France) from February 1985 to January 1986. Total dissolved carbo- hydrate (TDCHO) and dissolved monosaccharides (MCHO) were measured by the methods of Bur- ney and Sieburth and Johnson and Sieburth respectively. It must be noted that these methods cannot distinguish between carbohydrates and carbohydrate-like substances; consequently, these methods probably do not closely reflect biologically available pools of carbohydrates. In the river, TDCHO and MCHO values ranged from 230 to 970 /ig C 1"' and from 75 to 450 ngC-^ respectively. In the estuary, TDCHO and MCHO were usually lower; they varied respectively from 20 to 570 /zg C 1~' and from 0 to 180/ig C1 '. In June, some TDCHO values were much higher, probably because some polysaccharide was produced at this time by phytoplankton excretion or lysis. The relationship between Cl%o and TDCHO was dependent on the seasons. TDCHO was conserv- ative in autumn, winter and early spring. TDCHO and DOC concentrations were fairly well correlated during the same period. Similar results have been previously reported by various workers. MCHO and TDCHO concentrations were well correlated throughout this study except in June. From these results, it was concluded that most dissolved carbohydrates were linked to a conservative fraction of the organic matter in periods of low biological activity, whereas newly biosynthesised carbohydrates were responsible for non-conservative behaviour. INTRODUCTION - T h e r e is a g r o w i n g interest i n the study o f dissolved organic m a t t e r ( D O M ) i n seawater as i t becomes increasingly obvious that D O M interacts w i t h m a n y biological a n d chemical phenomena. •This paper forms part of the thesis (These de Doctoral) of W. Senior. "Present address: Nucleo de Sucre, Institute Oceanografico Universidad de Oriente, AP 245, Cerro Colorado, Cumana, Venezuela. ***Author to whom correspondence should be addressed at: Laboratoire de Biologie Marine, Universite de Nantes, 2 rue de la Houssiniere, 44072 Nantes, France. 0304-4203/91/$03.50 © 1991 — Elsevier Science Publishers B.V.
- 2. 20 W . S E N I O R A N D L. C H E V O L O T A l t h o u g h carbohydrates are i m p o r t a n t constituents o f D O M (usually 1 0 - 2 0 % ) , relatively little is k n o w n about t h e m , especially i n estuarine and coastal ecosystems, m a i n l y because analytical techniques cannot be used i n r o u t i n e w o r k . S o m e m e t h o d s have been used t o d e t e r m i n e either the total carbohy- drate content or the m o n o m e r i c sugar c o m p o s i t i o n o f seawater, but these m e t h o d s are difficult a n d t i m e c o n s u m i n g . ( F u r t h e r i n f o r m a t i o n is given i n the following reviews: M o p p e r ( 1 9 8 0 ) , D a w s o n and Liebezeit ( 1 9 8 1 a,b) a n d Liebezeit a n d D a w s o n ( 1 9 8 2 ) . ) Sugars, i n the total dissolved carbohydrate ( T D C H O ) p o o l , are present as monosaccharides ( M C H O ) or polysaccharides ( P C H O ) ; the latter should be divided between biogenic polysaccharides a n d carbohydrates b o u n d t o h u m i c substances ( H S ) . H o w e v e r , i t is n o t easy t o distinguish between these last fractions a n d they are usually measured together as P C H O . F r o m the data collected i n various earlier studies, the following features appear: ( 1 ) T D C H O and M C H O concentrations vary, i n seawaters a n d brackish waters, f r o m 30 t o 1300 //g C 1 " ' and f r o m 2 t o 300 /ig C 1 " ' respectively. A few higher values have also been reported ( S u m i t r a et al., 1 9 7 2 ) . ( 2 ) T h e M C H O fraction usually accounts for a significant part o f T D C H O ( B u r n e y a n d S i e b u r t h , 1977; I t t e k k o t et al., 1 9 8 1 ; Sakugawa a n d H a n d a , 1 9 8 5 ) ; s o m e t i m e s for m o r e t h a n h a l f ( B u r n e y e t a l . , 1979; H a r v e y , 1 9 8 3 ) . ( 3 ) D i u r n a l fluctuations o f T D C H O m a y occur i n periods o f biological activity ( W a l s h , 1965; B u r n e y et al., 1981a,b); H a r v e y , 1983; E b e r l e i n et al., 1 9 8 3 ) , but the M C H O concentrations are fairly constant over a 24-h p e r i o d ( B u r n e y e t a l . , 1981a,b; B u r n e y , 1 9 8 6 a ) . ( 4 ) I n o n l y a few studies have attempts been m a d e t o establish a relation- ship between sugar c o m p o s i t i o n a n d other chemical, physical a n d biological parameters. W e report here results obtained f r o m a study p e r f o r m e d i n a s m a l l estuary located i n B r i t t a n y ( E l o m Estuary, B a y o f Brest, France; see F i g . 1.). S o m e p r e l i m i n a r y results have been published elsewhere ( S e n i o r et al., 1 9 8 7 ) . T o our knowledge, this is one o f the few studies p e r f o r m e d over such a l o n g pe- r i o d o f t i m e i n the same area. Seasonal v a r i a t i o n s a n d origins are studied; the nature o f dissolved carbohydrates is discussed i n the light o f present a n d pub- lished data. METHODS AND MATERIAL Study area ,, Figure 1 shows the E l o m E s t u a r y ( B r i t t a n y , F r a n c e ) a n d the l o c a t i o n o f the seven s a m p h n g sites. Sites E i a n d E j are low-salinity sites, a n d they are
- 3. D I S S O L V E D C A R B O H Y D R A T E S I N E S T U A R I N E E N V I R O N M E N T S 21 Fig. 1. Location of sampling sites in the Elorn Estuary. considered t o be located i n the river. E l o m is a 12-km-long estuary. T h e depth ranges f r o m 3.5 m at L a n d e m e a u t o 12.5 m at A l b e r t L o u p p e bridge. D u r i n g this study, the flow o f the r i v e r varied between 1.3 a n d 18 m ^ s " ' . A detailed record has been published earlier ( N o u r e d d i n et al., 1 9 8 7 ) , to- gether w i t h the rainfall record. T h i s estuary is strongly influenced by tide pat- tems; the renewal t i m e o f the water is between 2 a n d 4 days ( L ' Y a v a n c , 1 9 8 4 ) . L a n d e r n e a u (see F i g . 1 ) is a m e d i u m - s i z e d city o f 2 0 0 0 0 inhabitants. T w o sewers discharge Landerneau's waste-water, after cleaning by a sewage-treat- m e n t system, slightly d o w n s t r e a m f r o m site E2 ( m e a n accumulated flux: 5000 m ^ d a y " ' , m e a n D O C value 2 0 m g C 1 " ' ) . I n the same area (between sites E2 and E 3 ) there is also a seaweed-processing factory w h i c h extracts alginate f r o m b r o w n seaweeds ( 3 0 0 0 0 t y e a r " ' ) . Waste-water f r o m this factory is dis- charged i n t o the estuary i n a n erratic m a n n e r . Site E3 is about 3 k m d o w n - stream f r o m this plant. I n a d d i t i o n , upstream f r o m site E j , there is also a milk-processing factory, but its waste-water is treated. Lastly, at d o w n s t r e a m sites Eg and E7, some organic m a t t e r m a y c o m e f r o m the m a i n sewer that collects Brest waste-water w h i c h is discharged (after t r e a t m e n t ) close t o M o u l i n Blanc B a y (see F i g . 1 ) . Sampling -' W a t e r samples were collected f r o m F e b r u a r y 1 1 , 1985, t o January 8, 1986 (see Table 1 ) . Samples were collected d u r i n g the 2 - 3 - h p e r i o d a r o u n d h i g h
- 4. 22 W . S E N I O R A N D L. C H E V O L O T water; tide coefficients were i n the range o f 7 0 - 8 0 except o n M a r c h 11 ( 9 8 ) . It was n o t possible, for each cruise, t o sample d u r i n g the same period o f the day. T h e samples can also be grouped according t o the season i n w h i c h they were collected: spring ( M a r c h 11-June 7 ) o r early spring ( M a r c h 1 1 - A p r i l 2 4 ) , s u m m e r ( J u l y a n d September) a n d a u t u m n - w i n t e r ( F e b r u a r y 1985 and Oc- tober 11-January 8, 1 9 8 6 ) . A t stations E3-E7, water sampling was carried o u t using an electrical p u m p ( L e n z e D i s c o v e r t e l l Getriebe T y p e 11602, F . R . G . ) . T h i s p u m p is a peristaltic p u m p w i t h a synthetic p o l y m e r tube; consequently, there is n o contact be- tween mechanical parts and water, a n d n o possibility o f c o n t a m i n a t i o n b y biogenic molecules; D O C measurements have also s h o w n that there is n o sig- nificant increase o f D O C . A t stations E i a n d E2, a clean glass bottle was used. A l l samples were t a k e n j u s t below the surface a n d were filtered i m m e d i a t e l y t h r o u g h a 1 0 0 - / i m screen. T h e y were kept for several hours at 5°C before being filtered t h r o u g h a G F / C precombusted (450°C, 4 h ) glass fiber fiher. F o r the few hours ( 3 - 4 h ) between collection a n d processing, some bacterial degradation could n o t be avoided, but f r o m the data published b y B u r n e y ( 1 9 8 6 a , b ) , w e can estimate ( i n s u m m e r a n d i n d a r k ) that the T D C H O deg- radation rate is usually less t h a n 10 //g C 1 ~ ' h ~ ' . O c h i a i et al. ( 1 9 8 0 ) a n d O c h i a i a n d N a k a j i m a ( 1 9 8 5 ) gave s i m i l a r o r l o w e r decomposition rates i n freshwater. A t 5°C, the loss is probably less. E r r o r introduced by keeping the water for a few hours d i d exist, but was o f the same m a g n i t u d e as the experi- m e n t a l analytical error (see analytical m e t h o d s ) . F o r M C H O , bacterial u t i - lization ( f o r the same p e r i o d ) was probably significant. O n the other hand, filtering w i t h G F / C o n l y partially r e m o v e d bacteria. Consequently, some car- bohydrates counted as T D C H O were indeed bacterial particulate carbohy- drates, but probably o n l y t o a slight extent, because w e also analysed 36 sam- ples by H P L C a n d f o u n d bacterial sugars ( r h a m n o s e , fucose, ribose) o n l y at l o w percentages (Senior, 1 9 8 6 ) . Filtrates were t h e n kept i n glass bottles after a d d i t i o n o f 1 m l 1 ~ ' o f a saturated HgCl2 s o l u t i o n . A l l glassware used t h r o u g h - out the analysis was precombusted (450°C, o v e r n i g h t ) . Analytical methods Analyses o f D O C were carried o u t o n a D o h r m a n n D C 80 analyser w h i c h performs p h o t o - o x i d a t i o n o f samples i n the presence o f persulfate. Results are expressed i n m g C 1 " C h l o r i n i t y was measured by the K n u d s e n m e t h o d according t o the procedure described by A m i n o t ( 1 9 8 3 ) . C h l o r o p h y l l a a n d p h a e o p h y t i n a were d e t e r m i n e d fluorometrically using a T u r n e r I I I fluoro- meter, according t o L o r e n z e n ( 1 9 6 7 ) , after extraction f r o m the filters b y a n acetone-water m i x t u r e ( 9 0 : 1 0 , v / v ) . H o w e v e r , w e should p o i n t o u t that re-
- 5. D I S S O L V E D C A R B O H Y D R A T E S I N E S T U A R I N E E N V I R O N M E N T S 23 suits obtained by this m e t h o d m a y n o t be accurate for estuarine e n v i r o n m e n t s ( M a n t o u r a and L l e w e l l y n , 1 9 8 3 ) . F o r dissolved monosaccharides ( M C H O ) , the m e t h o d o f J o h n s o n a n d Sie- b u r t h ( 1 9 7 7 ) was used, f o l l o w i n g the procedure given b y D a w s o n a n d L i e - bezeit ( 1 9 8 1 a , b ) . M a n n i t o l a n d glucose were used as standards. M o l a r con- centrations were calculated f r o m the c o n t r o l corrected m e a n absorbance data using the (glucose-f-mannitol ) / 2 regression line. Results are expressed i n jug C 1 " ' o f glucose equivalent. I n o u r hands, the precision o f this m e t h o d was not as h i g h as stated by D a w s o n a n d Liebezeit ( 1 9 8 1 b ) . Measures were m a d e i n triplicate (three aliquots f r o m the same sample b o t t l e ) ; standard d e v i a t i o n varied f r o m 10 t o 30 /ig C 1 " ' depending o n the sample. O b v i o u s l y , this m e t h o d cannot distinguish between true monosaccharides and any substances w h i c h possess a t e r m i n a l glycol f u n c t i o n ( C H O H - C H j O H ) . Such a f u n c t i o n is ex- pected t o be present i n h u m i c substances ( H S ) , a n d consequently, interfer- ence w i t h t h e m cannot be avoided. F o r t o t a l dissolved carbohydrates ( T D C H O ) , the m e t h o d o f B u r n e y a n d S i e b u r t h ( 1 9 7 7 ) was used. H o w e v e r , the c o n d i t i o n s o f hydrolysis were differ- ent ( I t t e k k o t , 1 9 8 2 ) : 5 - m l seawater samples w i t h 1 m l o f H C l ( 3 0 % ) were hydrolysed a t 100°C for 3.5 h . A f t e r cooling, the acid was neutralized w i t h concentrated N a O H ( ~ 1 m l ) . p H was checked w i t h p H papers. Concentra- t i o n s were corrected for d i l u t i o n s . A s for M C H O , H S interference occurs. H o w e v e r , a good correlation ( r = 0 . 9 7 , « = 36; slope = 1.1) was obtained be- t w e e n the s u m o f i n d i v i d u a l sugars measured by H P L C (see above; Senior, 1 9 8 6 ) a n d the result g i v e n by the M B T H m e t h o d . T h e concentration o f dissolved polysaccharides ( P C H O ) is the difference between t h e concentration i n T D C H O a n d t h e concentration i n M C H O ( B u r n e y a n d Sieburth, 1 9 7 7 ) . RESULTS AND DISCUSSION Tables 1 and 2 list respectively the T D C H O a n d M C H O concentrations at each site d u r i n g the f)eriod studied. T h e T D C H O concentrations were vari- able in the river a n d ranged f r o m 2 3 0 t o 9 7 0 / i C 1 " ' . T h i s v a r i a b i l i t y could be cansed by some material being brought b y t i d a l currents ( s a m p l i n g was f i f c a i J I f y ^ f c • 111 I ) from Landerneau's sewers or f r o m the seaweed fac- toiv.lBpHlicBfar.11ic970/«CI~' value (100/^C 1~' m o r e t h a n the second- b l ^ E H v a l a e l wm drmnmjittj h i g h , because the tide coefficient ( 9 8 ) w a s s i g B f l i c a M l f h i g h e r OB Aisdqrtlian nsoal. Consequently, this value was n o t i n d n d e d im t k e akaiatkms. For the r e m a i n i n g o v e r a l l measurements, t h e m e a n value was 5 6 0 « C l ~ ' . In autumn-*inter. the average concentration i n the r i v e r was higher ( 6 7 5 , u g C l ~ ' ) t h a n i n early spring (420/zg C 1 " ' ) . A t d o w n s t r e a m stations, the T D C H O concentrations were usually l o w e r ( 2 0 -
- 6. 24 W . S E N I O R A N D L . C H E V O L O T TABLE 1 TDCHO concentrations (//g C 1^') in the Elorn Estuary Date (1985) Site E, E2 E 3 E 4 E 5 E6 Ev February 11 860 530 350 340 140 40 20 March 11 970* 440 145 180 155 150 125 April 3 320 430 310 265 220 240 290 April 17 495 750 230 205 280 255 245 April 24 265 265 210 105 165 145 140 June 7 795 785 620 755 470 1080 395 July 1 550 480 325 185 270 265 165 September 20 305 230 395 385 320 195 205 October 11 765 755 330 295 295 305 215 November 25 545 835 120 115 145 90 100 December 9 700 715 400 315 295 265 245 January 8 (1986) 500 545 570 325 315 250 240 *This abnormally high value has been discarded. TABLE 2 MCHO concentrations (/^g C 1"') in the Elom Estuary Date Site E, E 3 E 4 E 5 E6 E 7 February 11 290 200 110 130 0 0 0 March 11 390 180 70 60 55 90 40 April 3 245 225 180 165 115 135 170 April 17 450 400 95 80 80 105 75 April 24 165 185 170 100 150 90 95 June 7 105 165 90 75 75 430 130 July 1 325 305 120 60 105 110 35 September 20 105 75 145 100 115 80 90 October 11 325 335 125 105 110 70 65 November 25 260 385 45 30 35 35 10 December 9 285 305 125 130 100 55 65 January 8 185 230 130 95 75 55 40 570 jUg C 1~'), w i t h some notable exceptions i n June ( 1 0 8 0 / / g C 1 " ' at station Eg, for instance). T h e M C H O values were lower; they ranged f r o m 75 t o 4 5 0 /ig C 1 ~ ' i n t h e r i v e r a n d f r o m 0 t o 180 /zg C 1 " ' at m o r e d o w n s t r e a m stations. Relationship between chlorinity and TDCHO T D C H O concentrations showed a relatively poor b u t significant relation- ship w i t h c h l o r i n i t y ( r = 0 . 5 8 ; « = 83; / ' < 0 . 0 0 1 ) f o r t h e overall measure-
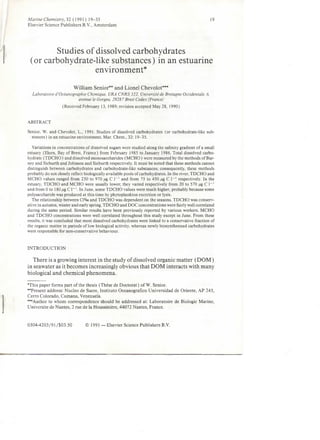
- 7. D I S S O L V E D C A R B O H Y D R A T E S I N E S T U A R I N E E N V I R O N M E N T S 25 ments. I f the values measured i n June, July a n d September are not t a k e n i n t o account, a better relationship is obtained (see F i g . 2 a ) . I f the data are split i n t o early spring values ( M a r c h 1 1 - A p r i l 2 4 ) a n d au- t u m n - w i n t e r values, t w o different regression lines are obtained (see F i g . 2 ) . F o r this last period, the y-intercept a n d slope are higher, probably because the T D C H O i n p u t f r o m the r i v e r was m o r e i m p o r t a n t at this t i m e , w h e n terres- trial plants were decaying a n d w h e n the l a n d was m o r e efficiently drained. I t is w o r t h p o i n t i n g out that, w i t h o u t the r i v e r measurements, w e obtained s i m - ilar regression lines i n early spring ( r = 0 . 7 9 ; « = 20; P<0.001; [ T D C H O ] = - 1 3 . 5 (±2.5) [Cl%o] + 390 (±40)) as well as i n a u t u m n - w i n t e r ( r = 0 . 5 9 ; « = 25; P<0.01; [ T D C H O ] = - 2 3 (±6.5) [ C l % o ] - I - 6 0 0 ( ± 1 0 0 ) ) . F o r b o t h periods, y-intercepts ( 3 9 0 a n d 600 /zg C 1"') are accept- ably close t o the T D C H O m e a n values i n the r i v e r ( 4 2 0 a n d 675 /zg C 1 " s e e a b o v e ) . T h i s result suggests that the T D C H O concentration was w i d e l y vari- able i n the r i v e r o n a short time-scale, but the T D C H O flux introduced i n t o the estuary by the r i v e r was m o r e stable. These data also suggest that m o s t o f the T D C H O was c o m i n g f r o m the r i v e r a n d was conservative i n a u t u m n - w i n t e r a n d early spring i n this estuary a n d for this study. T o o u r knowledge, this is the first t i m e that such b e h a v i o u r o f dissolved carbohydrates has been established. T h i s result is rather surprising, because a p r i o r i , carbohydrates should be a d y n a m i c part o f the D O M a n d should n o t be conservative. D u r i n g t h e period o f higher biological activity ( J u n e - S e p t e m b e r ) , t h e T D C H O vs. Cl%o relationship disappeared, probably because o f some i n situ production, especially i n June ( m o s t o f the points are above the regression lioe; see F i g . 2 a ) . Surprisingly, d u r i n g the early spring ( M a r c h 1 1 - A p r i l 2 4 ) , the T D C H O vs. Cl%o relationship was fairly strong ( r = 0 . 7 7 ; « = 2 7 ) , al- though there was some evidence o f biological a c t i v i t y i n the estuary ( h i g h concentrations i n c h l o r o p h y l l a n d p h a e o p h y t i n o n M a r c h 11 a n d A p r i l 3, for instance). E i t h e r the p h y t o p l a n k t o n i c species o f the spring b l o o m d i d n o t ex- crete any carbohydrates, or the excreted carbohydrates were very quickly used a n d d i d not b u i l d up any significant a m o u n t o f T D C H O . Relationship between TDCHO and phaeophytin Dwnngtbc period of biological a c t i v i t y ( J u n e - S e p t e m b e r ) , there was a sig- • i C f j i jffatinmdiip (r=0.76. calculated w i t h o u t the a b n o r m a l l y high phaeo- p k v t i B v a l a e (10.3 /Jig ~ ) of July 1 at station E , ) between T D C H O a n d p h a c o p k v t i B (see Fig. 3). B u r n e y et al. ( 1 9 8 1 a ) also noted a correlation be- tween TDCHO and phaeopigmem fluctuations i n a study o f diel variations of TDCHO in a emulated estuarine ecosystem. Similarly, I t t e k k o t et al. (1981) measured m a x i m u m dissolved c o m b i n e d carbohydrate concentra- tions towards the end o f a b l o o m i n the N o r t h Sea. A c c o r d i n g t o these w o r k - ers, n u t r i e n t h m i t a t i o n leads t o the release o f large a m o u n t s o f carbohydrates.
- 9. D I S S O L V E D C A R B O H Y D R A T E S I N E S T U A R I N E E N V I R O N M E N T S 27 9 0 0 8 0 0 7 0 0 (c) 6 0 0 - 5 0 0 - ( ] 4 0 0 - 3 0 0 - 2 0 0 - 1 0 0 - 0 - - •an ~T 1 1 1 1 1 1 1 1 1 1 1 1 r 4 6 8 1 0 1 2 1 4 1 6 1 8 Chlorluitj (in %o) Fig. 2. The inverse relationship of TDCHO to Cl%o. (a) For the overall measurements, the regression line was [TDCHO] = -18 ( ± 3 ) [Cl%o]-l-560 ( ± 180) (/-=0.58; « = 83; P<0.001), but that shown here was calculated without the June-July-September values ( + ): [TDCHO] = - 2 2 ( ± 2 ) [Cl%o] + 560 ( ± 1 3 0 ) (r=0.77; « = 62;/'<0.001). (b) In spring, the regression line was [TDCHO] = - 1 5 ( ± 2 . 5 ) [Cl%o]+420 ( ± 9 0 ) (r=0.77; « = 27; P<0.001). (c) in autumn-winter, the regression line was [TDCHO] = -27 ( ± 2 . 5 ) [Cl%o]+680 ( ± 1 1 5 ) (r=0.87:/7 = 35;P<0.00I). Usually, d u r i n g a p h y t o p l a n k t o n b l o o m , accumulation o f dissolved carbohy- drates is a t a m a x i m u m i n the stationary phase ( M y k l e s t a d t , 1977; Brock- mann et al., 1 9 7 9 ) . Indeed, i n Fig. 2a, i t is obvious that large excretions o f carbohydrates occurred i n the bay i n s u m m e r w h e n nutrients were depleted. For instance, nitrate fell f r o m 20 / z M 1 ~ ' i n A p r i l t o 4 1 " ' i n June and 0 ^ r ' i n July at station E7 (Senior, 1 9 8 6 ) . Consequently, during this pe- riod, T E K T H O were not o n l y f o r m e d by refractory carbohydrates c o m i n g f r o m I k e river, but also by n e w l y biosynthesised sugars released by senescent algal o e f e o r produced by z o o p l a n k t o n excretion ( B u r n e y et al., 1981a). ti§mmiM} dissolved carbohydrates (TDCHO or MCHO) and DOC The TDCHO D O C relationship calculated for the overall points was «cak md I k eregressionline aberrant (see Fig. 4 a ) . H o w e v e r , i f the J u n e - JuK—ScplcBbervahies. together w i t h three additional a b n o r m a l l y high D O C values (statkm Ej of Febriiar> 1 1 . stations E2 o f December 9; station E7 o f
- 10. 28 W . S E N I O R A N D L. C H E V O L O T 1.6 0 2 4 6 8 1 0 P h a e o p h y t i n ( I n / i j / 1 ) Fig. 3. The direct relationship between TDCHO and phaeophytin in June-July-September. The value for July 1 at site E , ( • ) is not included in the calculation of the regression line: [TDCHO] = 140 ( ± 3 0 ) [Phaeo]+90 ( ± 170) (/•=0.76; « = 20;/'<0.001). A p r i l 3 ) , are discarded, a m u c h better relationship is obtained (see F i g . 4 a ) . V e r y s i m i l a r results have been f o u n d for M C H O . A m o d e r a t e l y good correla- t i o n between M C H O a n d D O C m a y be calculated for the overall measure- m e n t s ( r = 0 . 3 5 ; « = 84; P < 0 . 0 1 ) . T h e c o r r e l a t i o n coefficient is better i f the same values as before are discarded ( a - = 0 . 6 1 ; « = 60; P < 0 . 0 0 1 ) . T h e corre- lation becomes excellent i n a u t u m n - w i n t e r , w i t h the exclusion o f the corre- sponding a b n o r m a l l y h i g h D O C values ( r = 0 . 8 9 ; « = 33; / ' < 0 . 0 0 1 , see F i g . 4 b ) . Consequently, i n the p e r i o d o f l o w biological activity, dissolved carbo- hydrates ( T D C H O o r M C H O ) a n d D O C were correlated, a n d consequently h ad s i m i l a r origins a n d e v o l u t i o n s . A s the b u l k o f the D O M is k n o w n t o be Fig. 4. The direct relationship between dissolved carbohydrates and DOC. (a) TDCHO vs. DOC relationship: the broken regression line ([TDCHO] = 38.5 ( ± 12) [DOC] +230 ( ±210); /•=0.33; « = 83; P<0.01) was calculated from overall points. The solid regression line ([TDCHO] = 126 ( ± 1 3 ) [ D O C ] - 1 0 ( ± 120); r=0.79; « = 59; i'< 0.001) was calculated without the June values ( + ) the July-September values ( O ) and three additional high DOC values ( A ) , (b) MCHO vs. DOC relationship: the regression line ([MCHO]=61 ( ± 6 ) [DOC] - 5 5 ( ±50); r=0.89; « = 33; P<0.00 was calculated from only the autumn-winter measurements ( • ) . • : Winter measurements not included in calculation of the regression; +: early spring measurements; A: June measurements; O- July-September measurements.
- 11. D I S S O L V E D C A R B O H Y D R A T E S I N E S T U A R I N E E N V I R O N M E N T S DOC ( i n m g C / 1 ) a — = - ^ ^ 1 1 r " 1 i 1 1 1 3 5 7 9 1 DOC (in mgCA)
- 12. refractory. this resuh imphes that dissolved carbohydrates should be refrac- tor. However, we have t o recognize that some usable dissolved carbo- hydrate m a y be lost, especially for the period preceding fixation (see M e t h o d s and M a t e r i a l section). F o r T D C H O , the probable losses ( 1 5 - 3 0 /ig C 1 " ' ) were l o w relative t o T D C H O concentrations ( o n l y t w o values under 100 //g C I " ' ) , and consequently d i d n o t invalidate o u r result. F o r M C H O , concen- trations were lower a n d monosaccharides were used m o r e rapidly ( O c h i a i a n d N a k a j i m a ( 1 9 8 5 ) measured a glucose degradation rate o f 14 //g C 1 " ' h ~ ' ) ) ; consequently, the M C H O vs. D O C correlation is better t h a n i t should be. I t is still true that, i n a u t u m n - w i n t e r , a significant part o f the M C H O fraction (measured b y t h e M B T H m e t h o d ) w a s n o t m a d e u p o f usable monosaccharides. W h e n the biological a c t i v i t y is high, this correlation is n o longer observed. F o r instance, i n July a n d September, m o s t points are under the regression lines (see F i g . 4a,b), because at this t i m e , concentrations o f D O C were very high, but those o f M C H O o r T D C H O were not. O n the contrary, i n June, there was a large excess o f T D C H O (see Fig. 4 a ) , m a i n l y composed o f P C H O . It is n o t e w o r t h y that s i m i l a r correlations between T D C H O and D O C have been previously observed i n various e n v i r o n m e n t s . B u r n e y et al. ( 1 9 7 9 ) re- ported that M C H O , P C H O a n d T D C H O showed significant correlations ( P < 0 . 0 1 ) w i t h D O C i n a study p e r f o r m e d i n a large area o n the continental shelf o f N o r t h A m e r i c a a n d across the N o r t h A t l a n t i c Ocean, w i t h sampling at the surface or at depth. F o r instance, the T D C H O vs. D O C regression line calculated f r o m their data ( r = 0 . 7 1 ; « = 84; / ' < 0 . 0 0 1 ; [ T D C H O ] = 170 (±20) [ D O C ] - 2 5 (±30)) is reasonably s i m i l a r t o that obtained i n o u r study. T h e same group had previously pubUshed ( B u r n e y and Sieburth, 1977) data collected i n Narragansett B a y f r o m F e b r u a r y t o July 1975. F r o m these data, a good linear correlation between T D C H O and D O C (/•=0.83; « = 20; P < 0 . 0 0 1 ; [ T D C H O ] = 115 (±20) [ D O C ] - 7 0 (±120)) o r between M C H O a n d D O C ( r = 0 . 8 7 ; n = 20; P < 0 . 0 0 1 ; [ M C H O ] = 4 8 ( ± 6 ) [ D O C ] — 6 2 (±45)) c a n be deduced. I n t h e Sargasso Sea, these authors ( B u r n e y et al, 198 l b ) , observed similarities between T D C H O a n d D O C pat- terns, but u n f o r t u n a t e l y they d i d n o t give any detail o r explanation. O n the other hand, they d i d n o t find any correlation between T D C H O a n d D O C i n the Caribbean Sea ( B u r n e y et al., 1 9 8 2 ) . I n freshwater. Sweet a n d Perdue ( 1 9 8 3 ) also noticed " a moderately good correlation b e t w e e n " T D C H O and D O C i n the W i l l i a m s o n R i v e r . Satoh et al. ( 1 9 8 6 ) f o u n d a s i m i l a r result i n L a k e Suwa. Such correlations between D O C a n d dissolved carbohydrates cannot be fortuitous. I t w o u l d be very surprising for D O C a n d biogenic and even refrac- t o r y T D C H O t o follow s i m i l a r evolutions i n such a variety o f e n v i r o n m e n t s . A better explanation could be that a significant part o f T D C H O (especially i n periods o f l o w biological a c t i v i t y ) is i n a refractory f o r m associated w i t h
- 13. D I S S O L V E D C A R B O H Y D R . J 1 T E S I N E S T U A R I N E E N V I R O N M E N T S 4 0 0 3 5 0 - i 3 0 0 1 4 0 0 T D C H O ( i n f J g C A ) 5 0 0 450 400 9S0 300 250 (b) I n CD • • •h 0 . 2 0.4 0 . 6 ( T h o u s a n d s ) T D C H O ( I n MgC/1) 0.8 Fig. 5. The direct relationship of MCHO to TDCHO. (a) in autumn-winter: [MCHO] =0.44 (*0.02) [ T D C H O ] - 3 5 ( ± 3 0 ) (r=0.96: « = 35: P<0.001). (b) For overall points except those for June ( + ): [MCHO]=0.44 ( ± 0 . 0 3 ) [ T D C H 0 ] - 5 ( ± 5 0 ) (r=0.87; « = 77; ;'<0.001).
- 14. 32 W . S E N I O R A N D L. C H E V O L O T the b u l k o f the D O M . I t is n o t e w o r t h y that regression lines f o u n d i n various e n v i r o n m e n t s are relatively similar, suggesting that the nature o f the ' D O C - T D C H O complex' is relatively u n v a r i a n t . T o this refractory fraction, freshly excreted polysaccharides m a y be added; they are responsible for the non-con- servative b e h a v i o u r observed i n June i n o u r study, and for the diel T D C H O variations often observed a n d reported (see I n t r o d u c t i o n ) . L a c k o f correla- t i o n m a y also result f r o m p r o d u c t i o n o f large quantities o f dissolved organic substances w h i c h disrupt the relationship between T D C H O and D O C (as i n s u m m e r i n the present s t u d y ) . Relationship between MCHO and TDCHO T h e r e was a n excellent linear relationship between M C H O and T D C H O (see Fig. 5a) i n a u t u m n a n d w i n t e r . Surprisingly, m o s t o f the other points are relatively close t o this regression line except those for June. I f the June points are ignored, a s i m i l a r regression line is obtained (see Fig. 5 b ) . I t is inconceiv- able that truly free monosaccharides and polymeric carbohydrates follow such similar patterns o f release a n d uptake. I t also seems unbelievable that M C H O as well as P C H O are n o t significantly used d u r i n g their transport t h r o u g h the estuary ( 2 - 4 days) at relatively h i g h concentrations such as 1 0 0 - 2 0 0 /zg C 1 " ' ) . Indeed, this result c o n f i r m s t h e previously advanced hypothesis, be- cause, i f m o s t carbohydrates are l i n k e d t o t h e b u l k o f the organic matter, T D C H O values and M C H O values are s i m p l y the results o f using t w o differ- ent methods ( w i t h a n d w i t h o u t h y d r o l y s i s ) t o measure the same parameter: the concentration o f carbohydrates ( a n d carbohydrate-like substances) pres- ent i n the t r a n s f o r m e d organic matter. It is n o t e w o r t h y that a s i m i l a r correlation could have been obtained f r o m the data collected b y B u r n e y a n d Sieburth ( 1 9 7 7 ) i n w i n t e r a n d spring i n Narragansett B a y ( r = 0 . 9 6 ; « = 20; P < 0 . 0 0 1 ; [ M C H O ] = 0 . 3 9 (±0.03) [ T D C H O ] - 20 ( ± 2 5 ) ) . H o w e v e r , there was n o correlation between M C H O a n d T D C H O either i n the study o f H a r v e y ( 1 9 8 3 ) o r i n that o f B u r n e y et al. ( 1 9 7 9 ) , b o t h p e r f o r m e d i n s u m m e r . Probably, i n this season, large quantities o f n e w l y biosynthesized carbohydrates disturb t h e M C H O v s . T D C H O relationship. GENERAL DISCUSSION A s noted i n the I n t r o d u c t i o n , o u r knowledge o n dissolved carbohydrates is l i m i t e d . F o r instance, M C H O concentrations are often reported w i t h i n t h e 5 0 - 1 0 0 /zg C 1 " ' range, w h i c h is relatively h i g h for easily usable compounds. Glucose, the m o s t d o m i n a n t monosaccharide constituent o f the M C H O frac- t i o n ( M o p p e r et al., 1 9 8 0 ) , is measured by chemical m e t h o d s at m u c h higher concentrations t h a n those expected f r o m the K^ + S^ values d e t e r m i n e d by m i -
- 15. D I S S O L V E D C A R B O H Y D R . T E S I N E S T U A R I N E E N V I R O N M E N T S 33 crobiological methods ( G o c k e et al., 1 9 8 1 ) . These last w o r k e r s supposed that glucose m a y exist either i n a " t r u l y free f o r m " usable by heterotrophic m i c r o - organisms o r i n a "reversibly b o u n d f o r m " that is unusable. T h i s last f o r m could be associated, for instance, w i t h organic compounds. Indeed, i t is w e l l k n o w n that carbohydrates are a constituent o f h u m i c substances ( H S ) ( W e r - shaw et al., 1 9 8 1 ; W i l s o n et al., 1 9 8 3 ) . T h e m e l a n o i d i n theory even suggests that H S are m a i n l y f o r m e d f r o m carbohydrates. T h i s theory has recently re- ceived further support (Benzing-Purdie a n d Ripmeester, 1983; I k a n et al., 1 9 8 6 ) , b u t httle is k n o w n about the nature a n d the strength o f bonds w h i c h l i n k carbohydrates t o H S . I n fulvic acid ( F A ) , D e H a a n a n d D e Boer ( 1 9 7 8 ) f o u n d that m o r e t h a n 5 0 % o f carbohydrates were n o t associated, o r were loosely associated by w e a k acid-labile bonds t o F A . Sweet and Perdue ( 1 9 8 2 ) identified o n l y 2.8% o f the aquatic h u m u s carbon as sugar carbon. Probably, there is a c o n t i n u u m between sugars loosely associated t o H S a n d carbohy- drate-like entities completely included i n H S . O u r results support t h e v i e w that a significant part o f dissolved carbohy- drates is associated w i t h the refractory organic matter. T o this T D C H O b o u n d fraction, n e w l y biosynthesized carbohydrates m a y be added, but the t u r n o v e r o f the n e w fraction is m u c h quicker. ACKNOWLEDGEMENTS W e t h a n k D r . P . le C o r r e for fruitful discussion a n d Professor P . C o u r t o t for his interest i n this w o r k . T h e authors are particularly indebted t o R . S i - korski for help w i t h the original text. W e are grateful t o A . A b i v e n for t y p i n g Ac manuscript. T h e assistance o f the crew o f 'Saint A n n e d u P o r t z i c ' is also ackaowledged. REFEHENCES Aminou A_ 1983. Mcsure de la salinite. In: A. Aminot and M. Chaussepied (Editors), Manuel des Anal'ses Chiniiques en Milieu Marin. CNEXO-BNDO/Documentation. Brest, pp. 45- 62. Benzing-Purdie, L. and Ripmeester, J.A., 1983. Melanoidins and soil organic matter: evidence of strong similarities revealed by '^C CP-MAS NMR. Soil. Sci. Soc. Am. J.. 47: 56-61. Brockmann, U.H., Eberlein, K., Junge, H.D., Maier-Reimer, E. and Siebers. D.. 1979. The de- velopment of a natural plankton population in an outdoor tank with nutrient-poor sea water. II. Changes in dissolved carbohydrates and amino acids. Mar. EcoL.Prog. Ser.. 1: 283-291. Burney, C M . , 1986a. Diel dissolved carbohydrate accumulation in coastal water of South Flor- ida. Bermuda and Oahu. Estuarine Coastal Shelf Sci.. 23: 197-203. Burney. C M . . 1986b. Bacterial utilization of total in situ dissolved carbohydrates in offshore waters. Limnol. Oceanogr.. 31(2): 427-431. Burney. C M . and Sieburth. J. McN.. 1977. Dissohed carbohydrates in seawater. II. A spectro-
- 16. 34 W . S E N I O R A N D L. C H E V O L O T photometric procedure for total carbohydrate analysis and polysaccharide estimation. Mar. Chem., 5: 15-28. Burney, CM., Johnson, K.M., Lavoie, D.M. and Sieburth, J. McN., 1979. Dissolved carbohy- drate and microbial ATP in the North Atlantic: concentrations and interactions. Deep-Sea Res.,26A: 1267-1290. Burney, CM., Johnson, K.M. and Sieburth, J. McN., 1981a. Diel flux of dissolved carbohydrate in a salt marsh and a simulated estuarine ecosystem. Mar. Biol., 63: 175-187. Burney, CM., Davis, P.O., Johnson, K.M. and Sieburth, J. McN., 1981b. Dependence of dis- solved carbohydrate concentrations upon small scale nanoplankton and bacterioplankton distributions in the Western Sargasso Sea. Mar. Biol., 65: 289-296. Burney, CM., Davis, P.O., Johnson, K.M. and Sieburth, J. McN., 1982. Diel relationships of microbial trophic groups and in situ dissolved carbohydrate dynamics in the Caribbean Sea. Mar. Biol., 67:311-322. Dawson, R. and Liebezeit, G., 198 la. The analytical methods for the characterization of organ- ics in sea-water. In: E.K. Duursma and R. Dawson (Editors), Marine Organic Chemistry. Elsevier, Amsterdam, pp. 445-496. Dawson, R. and Liebezeit, G., 1981b. Determination of amino acids and carbohydrates. In: K. Grasshoff, M. Ehrhardt and K. Kremling (Editors), Methods of Seawater Analysis, 2nd edn. Verlag Chemie, Weinheim, pp. 319-346. De Haan, H. and de Boer, T., 1978. A study of the possible interactions between fulvic acids, amino acids and carbohydrates from Tjeukemeer, based on gel filtration at pH 7.0. Water Res., 12: 1035-1040. Eberlein, K., Brockmann, U.H., Hammer, K.D., Kattner, G. and Laake, M., 1983. Total dis- solved carbohydrates in an enclosure experiment with unialgal Skeletonema costatum cul- ture. Mar. Ecol., Prog. Ser., 14: 45-58. Gocke, K., Dawson, R. and Liebezeit, G., 1981. Availability of dissolved free glucose to heter- otrophic microorganisms. Mar. Biol., 62: 209-216. Harvey, G.R., 1983. Dissolved carbohydrates in the New York Bight and the variability of ma- rine organic matter. Mar. Chem., 12: 333-339. Ikan, R., loselis, P., Rubinsztain, Y., Aizenshtqt, Z., Pugmire, R., Anderson, L.L. and Ishiwa- tari, R., 1986. Carbohydrate origin of humic substances. Naturwissenschaften, 73: 150-151. Ittekkot, v., 1982. Variations of dissolved organic matter during a plankton bloom: qualitative aspects based on sugar and amino acid analyses. Mar. Chem., 1 1: 143-158. Ittekkot, v., Brockmann, U.,Michaelis, W. and Degens, E.T., 1981. Dissolved free and com- bined carbohydrates during a phytoplankton bloom in the Northern North Sea. Mar. Ecol., Prog. Ser., 4: 299-305. Johnson, K. and Sieburth, J. McN., 1977. Dissolved carbohydrates in seawater, I . A precise spectrophotometric analysis for monosaccharides. Mar. Chem., 5: 1-13. I'Yavanc, J., 1984. Etude hydrologique de I'estuaire de I'Elorn. Rapport IFREMER-Brest, 29 pp. Liebezeit, G. and Dawson, R., 1982. The analysis of natural organic compounds in seawater. Kontakte (Merck), No. 2: 19-28. Lorenzen, C.J., 1967. Determination of chlorophyll and phaeopigments: spectrophotometric equations. Limnol. Oceanogr., 12: 343-346. Mantoura, R.F.C. and Llewellyn, C.A., 1983. The rapid determination of algal chlorophyll and carotenoid pigments and their breakdown products in natural water by reverse-phase high- performance liquid chromatography. Anal. Chim. Acta, 151: 297-314. Mopper, K., 1980. Carbohydrates in the marine environment: recent developments. In: Biogeo- chimie de la Matiere Organique a I'lnterface Eau-Sediment Marin. CoUoques Internation- aux du CNRS, No. 293. Editions du CNRS, Paris, pp. 71-80.
- 17. D I S S O L V E D C A R B O H Y D R A T E S I N E S T U A R I N E E N V I R O N M E N T S 35 Mopper. K., Dawson, R., Liebezeit, G. and Ittekkot, V., 1980. The monosaccharide spectra of natural waters. Mar. Chem., 10: 55-66. Myklestad. S.. 1977. Production of carbohydrates by marine planktonic diatoms. II. Influence of the N/P ratio in the growth medium on the assimilation ratio, growth rate, and produc- tion of cellular and extracellular carbohydrates by Chaetoceros affinis var. Willei (Gran) Hustedt and Skeletonomacostatum (Grev.) Cleve. J. Exp. Mar. Biol. Ecol., 29: 161-179. Noureddin. S.. Chevolot. L.. Senior, W. and Courtot, P., 1987. Etude des substances humiques dissoutes dans la rade de Brest. Oceanis, 13: 395-403. Ochiai. M. and Nakajima, T., 1985. Decomposition of organic matter extracted from sessile microbes. Verb. Int. Verein. Limnol., 22: 2744-2748. Ochiai. M.. Nakajima, T. and Hanya, T., 1980, Chemical composition of labile fractions in DOM. Hydrobiologia, 71: 95-97. Sakugawa. J. and Handa, N., 1985. Chemical studies on dissolved carbohydrates in the water samples collected from the North Pacific and Bering Sea. Oceanol. Acta, 8(2): 185-196. Satoh, Y.. Hayashi. H.. Nakamoto, N. andOkino, T., 1986. Regulating factors of the concentra- tion of dissolved carbohydrates in a central water column of Lake Suwa, Japan. Arch. Hy- drobiol.. 105(3): 299-319. Senior, W., 1986. Etude de la matiere organique dans I'estuaire de I'Elorn. These de Doctorat, Universite de Bretagne Occidentale, 158 pp. Senior, W.. Chevolot, L., Noureddin, S. and Courtot, P., 1987. Evolution saisonniere de la ma- tiere organique dissoute dans I'estuaire de I'Elorn. Les carbohydrates. Oceanis, 13: 413-426. Sumitra. V.. Joseph, K., Easterson, D.C.V. and Balachandran, V.K., 1972. Studies on dissolved carbohydrate content (DCHO) in a tropical estuary. J. Mar. Biol. India, 14: 864-866. Sweet. M.S. and Perdue, E.M., 1982. Concentration and speciation of dissolved sugars in river water. Environ. Sci. Technol., 16: 692-698. Walsh, G.E., 1965. Studies on dissolved carbohydrate in Cape Cod waters. II. Diurnal fluctua- tion in Oyster Pond. Limnol. Oceanogr., 10: 577-582. Wershaw, R.L., Mikita, M.A. and Steelink, C , 1981. Direct '^C NMR evidence for carbohy- drate moieties in fulvic acids. Environ. Sci. Technol., 15: 1461-1463. vasoa. M..A., Gillam, A.H. and Collin, P.J., 1983. Analysis of the structure of dissolved marine h a a i c substances and their phytoplanktonic precursors by 'H and '^C nuclear magnetic res- M W i i Chem. Geol., 40: 187-201.