
Recomendados
Recomendados
Más contenido relacionado
La actualidad más candente
La actualidad más candente (6)
Destacado
Destacado (9)
Similar a Degree of EHR Use and Quality of Care Across MN Area Clinics
Similar a Degree of EHR Use and Quality of Care Across MN Area Clinics (20)
Degree of EHR Use and Quality of Care Across MN Area Clinics
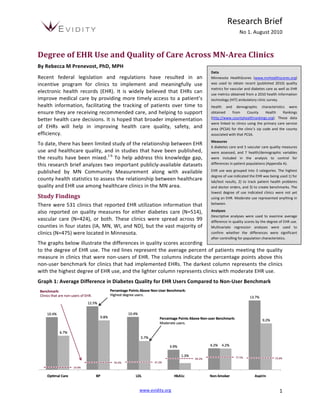
- 1. Research Brief No 1. August 2010 Degree of EHR Use and Quality of Care Across MN-Area Clinics By Rebecca M Prenevost, PhD, MPH Data Recent federal legislation and regulations have resulted in an Minnesota HealthScores (www.mnhealthscores.org) incentive program for clinics to implement and meaningfully use was used to obtain recent (published 2010) quality metrics for vascular and diabetes care as well as EHR electronic health records (EHR). It is widely believed that EHRs can use metrics obtained from a 2010 health information improve medical care by providing more timely access to a patient’s technology (HIT) ambulatory clinic survey. health information, facilitating the tracking of patients over time to Health and demographic characteristics were ensure they are receiving recommended care, and helping to support obtained from County Health Rankings (http://www.countyhealthrankings.org). These data better health care decisions. It is hoped that broader implementation were linked to clinics using the primary care service of EHRs will help in improving health care quality, safety, and area (PCSA) for the clinic’s zip code and the county efficiency. associated with that PCSA. Measures To date, there has been limited study of the relationship between EHR 6 diabetes care and 5 vascular care quality measures use and healthcare quality, and in studies that have been published, were assessed, and 7 health/demographic variables the results have been mixed.1-‐6 To help address this knowledge gap, were included in the analysis to control for this research brief analyzes two important publicly-‐available datasets differences in patient populations (Appendix A). published by MN Community Measurement along with available EHR use was grouped into 3 categories. The highest degree of use indicated the EHR was being used 1) for county health statistics to assess the relationship between healthcare lab/test results, 2) to track patient health problems quality and EHR use among healthcare clinics in the MN area. and doctor orders, and 3) to create benchmarks. The lowest degree of use indicated clinics were not yet Study Findings using an EHR. Moderate use represented anything in There were 531 clinics that reported EHR utilization information that between. also reported on quality measures for either diabetes care (N=514), Analyses Descriptive analyses were used to examine average vascular care (N=424), or both. These clinics were spread across 99 difference in quality scores by the degree of EHR use. counties in four states (IA, MN, WI, and ND), but the vast majority of Multivariate regression analyses were used to clinics (N=475) were located in Minnesota. confirm whether the differences were significant after controlling for population characteristics. The graphs below illustrate the differences in quality scores according to the degree of EHR use. The red lines represent the average percent of patients meeting the quality measure in clinics that were non-‐users of EHR. The columns indicate the percentage points above this non-‐user benchmark for clinics that had implemented EHRs. The darkest column represents the clinics with the highest degree of EHR use, and the lighter column represents clinics with moderate EHR use. Graph 1: Average Difference in Diabetes Quality for EHR Users Compared to Non-‐User Benchmark www.evidity.org 1
- 2. Research Brief No 1. August 2010 Graph 2: Average Difference in Vascular Quality for EHR Users Compared to Non-‐User Benchmark Even after controlling for Table 1: Regression Results Controlling for Population Characteristics population characteristics, Optimal Diabetes Care Optimal Vascular Care most quality differences Coefficient p-‐value Coefficient p-‐value between EHR users and Highest Degree EHR 0.0901 0.000 0.0674 0.000 Moderate Degree EHR 0.0637 0.000 0.0527 0.007 non-‐users are statistically % Smoking 0.0009 0.644 0.0006 0.768 significant (see Appendix B). % Obese 0.0122 0.011 0.0102 0.049 % Binge Drinkers -‐0.0015 0.456 -‐0.0021 0.358 The table to the right shows % Uninsured -‐0.0082 0.052 -‐0.0058 0.219 that compared to clinics PCP Rate -‐0.0002 0.011 -‐0.0001 0.183 % College 0.0044 0.000 0.0055 0.000 that have not yet % Unemployed -‐0.0082 0.209 -‐0.0073 0.320 implemented an EHR, an average of 9.0% more patients met all five of the optimal diabetes care measures when seen at clinics that have the highest degree of EHR use, and 6.4% more met the measures when seen at clinics that have moderate EHR use. Similarly, an average of 6.7% more patients met all four of the optimal vascular care measures when seen at clinics that have the highest degree of EHR use, and 5.3% more when seen at clinics that have moderate EHR use. Limitations There are several limitations to consider when interpreting these results. First, the quality measures available at the clinic-‐level were limited to 2 conditions, which represent only a tiny piece of healthcare quality. In addition, the control variables were at the county-‐level and may not accurately represent the actual patient populations obtaining care from the clinics. The analysis also does not account for clinic characteristics, such as size, teaching status, or provider specialties that may affect quality scores, nor does it control for selection bias, or the likelihood of a clinic with a greater focus on quality to be an early adopter of EHR. Finally, these results do not indicate whether the differences shown are clinically meaningful. Specifically, it is unknown how differences in these quality metrics translate into other downstream effects, such as fewer inpatient stays, lower rates of complications, and reduced ER utilization. Conclusion Publicly available healthcare quality and EHR utilization data show a greater degree of EHR utilization is associated with higher quality scores for diabetes and vascular care. Further research should be conducted to discern causality and determine whether other areas of healthcare quality have similar relationships. www.evidity.org 2
- 3. Research Brief No 1. August 2010 Appendix A: Measure Definitions Quality Measure Definitions Blood Pressure: The percentage of diabetes patients, ages 18-‐ References 75, who maintain blood pressure less than 130/80. This 1. Friedberg MW, Coltin KL, Safran DG, Dresser M, measure is used for diabetes and vascular care. Zaslavsky AM, Schneider EC. Associations between structural capabilities of primary care practices and LDL: The percentage of diabetes patients, ages 18-‐75, who performance on selected quality measures. Ann Intern Med. 2009 Oct 6;151(7):456-‐63. lower LDL or "bad" cholesterol to less than 100 mg/dl. This 2. Garrido T, Jamieson L, Zhou Y, Wiesenthal A, Liang L. measure is used for diabetes and vascular care. Effect of electronic health records in ambulatory care: retrospective, serial, cross sectional study. BMJ. 2005 Non-‐Smoking: The percentage of diabetes patients, ages 18-‐ Mar 12;330(7491):581. 75, who don’t smoke. This measure is used for diabetes and 3. Linder JA, Ma J, Bates DW, Middleton B, Stafford RS. vascular care. Electronic health record use and the quality of ambulatory care in the United States. Arch Intern Med. Aspirin: The percentage of diabetes patients, ages 40-‐75, who 2007 Jul 9;167(13):1400-‐5. 4. Poon EG, Wright A, Simon SR, Jenter CA, Kaushal R, Volk take an aspirin daily. This measure is used for diabetes and LA, Cleary PD, Singer JA, Tumolo AZ, Bates DW. vascular care. Relationship between use of electronic health record features and health care quality: results of a statewide HbA1c: The percentage of diabetes patients, ages 40-‐75, who survey. Med Care. 2010 Mar;48(3):203-‐9. control blood sugar so that A1c level is less than 8%. This 5. Welch WP, Bazarko D, Ritten K, Burgess Y, Harmon R, Sandy LG. Electronic health records in four community measure is used for only diabetes care. physician practices: impact on quality and cost of care. J Am Med Inform Assoc. 2007 May-‐Jun;14(3):320-‐8. Optimal Diabetes Care: This measure shows the “D5”, or 6. Zhou L, Soran CS, Jenter CA, Volk LA, Orav EJ, Bates DW, percentage of diabetes patients, ages 18-‐75, who met all 5 Simon SR. The relationship between electronic health individual diabetes quality measures: blood pressure, LDL, record use and quality of care over time. J Am Med Inform Assoc. 2009 Jul-‐Aug;16(4):457-‐64. HbA1c, non-‐smoking, and aspirin. Optimal Vascular Care: This measure shows the percentage of diabetes patients, ages 18-‐75, who met all 4 individual vascular care quality measures: blood pressure, LDL, non-‐smoking, and aspirin. Community Health Measure Definitions % Smoking: Percent of adults that report smoking at least 100 cigarettes and that they currently smoke as obtained by the Behavioral Risk Factor Surveillance Survey (BRFSS). % Obese: Percent of adults that report a BMI ≥ 30 as obtained by BRFSS. % Binge Drinkers: Percent of adults that report binge drinking in the past 30 days as obtained by BRFSS. % Uninsured: Percent of population < age 65 without health insurance as reported in the Area Resource File (ARF). PCP Rate: Primary care provider rate per 100Kas reported in the Area Resource File (ARF). % College: Percent of population age 25+ with 4‑year college degree or higher as obtained by the American Community Survey (ACS). % Unemployed: Percent of population age 16+ unemployed but seeking work as reported by the Local Area Unemployment Statistics, Bureau of Labor Statistics. www.evidity.org 3
- 4. Research Brief No 1. August 2010 Appendix B: Regression Results Diabetes Care Vascular Care BP Coefficient p-‐value* Coefficient p-‐value* Highest Level 0.1120 0.000 0.0598 0.001 Moderate Level 0.1004 0.000 0.0663 0.001 % Smoking 0.0022 0.344 0.0014 0.513 % Obese 0.0195 0.001 0.0166 0.001 % Binge Drinkers -‐0.0024 0.324 -‐0.0035 0.113 % Uninsured -‐0.0059 0.241 -‐0.0028 0.541 PCP Rate -‐0.0001 0.160 -‐0.0001 0.171 % College 0.0065 0.000 0.0058 0.000 % Unemployed -‐0.0049 0.526 0.0006 0.931 LDL Highest Level 0.1000 0.000 0.0639 0.000 Moderate Level 0.0548 0.002 0.0300 0.115 % Smoking 0.0006 0.760 0.0016 0.455 % Obese 0.0133 0.006 0.0015 0.772 % Binge Drinkers 0.0002 0.915 0.0001 0.971 % Uninsured -‐0.0121 0.004 -‐0.0049 0.288 PCP Rate -‐0.0001 0.292 0.0001 0.528 % College 0.0024 0.046 0.0033 0.008 % Unemployed -‐0.0132 0.044 -‐0.0077 0.285 Non-‐Smoking Highest Level 0.0275 0.006 0.0021 0.860 Moderate Level 0.0279 0.011 0.0094 0.480 % Smoking 0.0017 0.181 0.0003 0.842 % Obese 0.0022 0.462 0.0029 0.403 % Binge Drinkers -‐0.0015 0.248 -‐0.0015 0.340 % Uninsured 0.0019 0.469 0.0027 0.398 PCP Rate 0.0000 0.793 0.0000 0.867 % College 0.0013 0.088 0.0027 0.002 % Unemployed -‐0.0217 0.000 -‐0.0117 0.019 Aspirin Highest Level 0.1238 0.000 0.0312 0.006 Moderate Level 0.0909 0.000 0.0231 0.067 % Smoking 0.0017 0.391 0.0024 0.089 % Obese 0.0130 0.008 0.0028 0.409 % Binge Drinkers 0.0056 0.008 -‐0.0001 0.929 % Uninsured -‐0.0124 0.004 -‐0.0036 0.242 PCP Rate -‐0.0001 0.107 0.0000 0.868 % College 0.0028 0.020 -‐0.0009 0.293 % Unemployed -‐0.0076 0.254 -‐0.0125 0.009 HbA1c Highest Level 0.0521 0.000 Moderate Level 0.0309 0.025 % Smoking 0.0005 0.736 % Obese 0.0098 0.010 % Binge Drinkers 0.0003 0.838 % Uninsured -‐0.0061 0.067 PCP Rate -‐0.0002 0.019 % College 0.0018 0.047 % Unemployed -‐0.0007 0.891 *P-‐Values of .05 or lower are considered statistically significant, bolded. www.evidity.org 4