Grafica 1
•Descargar como PPTX, PDF•
0 recomendaciones•54 vistas

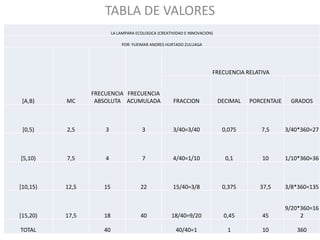
This document contains a table of values and bar graph analyzing the frequency and relative frequency of different ranges of values for an ecological lamp. The table shows the class marks, absolute and cumulative frequencies, relative frequencies as fractions, decimals, and percentages, and corresponding degree measures for 4 value ranges between 0 and 20. It then includes a bar graph visually representing the data from the table.

Recomendados
Más contenido relacionado
La actualidad más candente
Destacado
Destacado (16)
Similar a Grafica 1
Similar a Grafica 1 (20)
Más de IE Simona Duque
Más de IE Simona Duque (20)
Grafica 1
- 1. TABLA DE VALORES LA LAMPARA ECOLOGICA (CREATIVIDAD E INNOVACION) POR: YUEIMAR ANDRES HURTADO ZULUAGA FRECUENCIA RELATIVA FRECUENCIA FRECUENCIA [A,B) MC ABSOLUTA ACUMULADA FRACCION DECIMAL PORCENTAJE GRADOS [0,5) 2,5 3 3 3/40=3/40 0,075 7,5 3/40*360=27 [5,10) 7,5 4 7 4/40=1/10 0,1 10 1/10*360=36 [10,15) 12,5 15 22 15/40=3/8 0,375 37,5 3/8*360=135 9/20*360=16 [15,20) 17,5 18 40 18/40=9/20 0,45 45 2 TOTAL 40 40/40=1 1 10 360
- 2. GRAFICA DE BARRAS DE LA LAMPARA 20 18 16 14 12 10 8 6 4 2 0 [0,5) [5,10) [10,15) [15,20)