Executive report tremont_tearoom_vs._joshua_the_psychic_jul_01_2014_-_jul_31_2014
•
0 recomendaciones•164 vistas


Recomendados
Recomendados
Más contenido relacionado
Destacado
Destacado (10)
Similar a Executive report tremont_tearoom_vs._joshua_the_psychic_jul_01_2014_-_jul_31_2014
Similar a Executive report tremont_tearoom_vs._joshua_the_psychic_jul_01_2014_-_jul_31_2014 (20)
Más de Alex Palermo
Más de Alex Palermo (20)
Executive report tremont_tearoom_vs._joshua_the_psychic_jul_01_2014_-_jul_31_2014
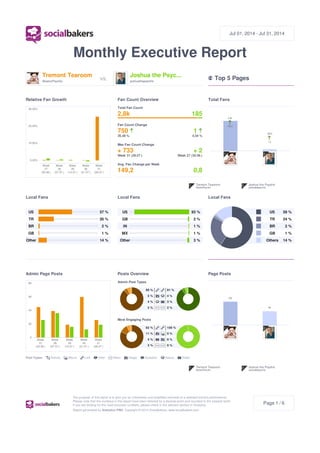
- 1. Jul 01, 2014 - Jul 31, 2014 Tremont Tearoom BostonPsychic vs. Joshua the Psyc... joshuathepsychic Top 5 Pages Relative Fan Growth Fan Count Overview Total Fans Local Fans Local Fans Local Fans Admin Page Posts Posts Overview Admin Post Types Most Engaging Posts Post Types: Activity Album Link Offer Other Image Question Status Video Page Posts Monthly Executive Report Page 1 / 6 The purpose of this report is to give you an informative and simplified overview of a selected brand's performance. Please note that the numbers in this report have been trimmed by a decimal point and rounded to the nearest tenth. If you are looking for the most accurate numbers, please check in the relevant section in Analytics. Report generated by Analytics PRO, Copyright © 2014 Socialbakers, www.socialbakers.com Week 27 (30.06.) Week 28 (07.07.) Week 29 (14.07.) Week 30 (21.07.) Week 31 (28.07.) 0,00% 10,00% 20,00% 30,00% 2,8k 185 Total Fan Count 750 35,38 % 1 0,54 % Fan Count Change + 733 Week 31 (28.07.) + 2 Week 27 (30.06.) Max Fan Count Change 149,2 0,8 Avg. Fan Change per Week 1 2 2,8k 750,0 185,0 1,0 Joshua the Psychic joshuathepsychic 2Tremont Tearoom BostonPsychic 1 US 57 % TR 26 % BR 2 % GB 1 % Other 14 % US 93 % GB 2 % IN 1 % MX 1 % Other 3 % US 59 % TR 24 % BR 2 % GB 1 % Others 14 % Week 27 (30.06.) Week 28 (07.07.) Week 29 (14.07.) Week 30 (21.07.) Week 31 (28.07.) 0 20 40 60 80 89 % 5 % 4 % 2 % 91 % 4 % 3 % 2 % 82 % 11 % 4 % 3 % 100 % 0 % 0 % 0 % 1 2 168 99 Joshua the Psychic joshuathepsychic 2Tremont Tearoom BostonPsychic 1
- 2. Jul 01, 2014 - Jul 31, 2014 Tremont Tearoom BostonPsychic vs. Joshua the Psyc... joshuathepsychic Top 5 Pages MON TUE WED THU FRI SAT SUN Most Engaging Post Time Fans Interaction Posts Interaction Overview MON TUE WED THU FRI SAT SUN 37 Likes 2 Comments 1 Shares Total Fans Interaction 40 Total Fans Interaction Most Engaging Post Times Average Fans Interaction per Week 4,1 Moving Average of Post Engagement Rate Post Engagement Rate Overview Moving Average of Post Engagement Rate Avg. Response Rate for User Questions Avg. Response Rate for User Questions Response Rate Overview - 7:00 PM - - 11:00 PM - - 7:00 AM 1:00 AM 3:00 PM 7:00 AM 7:00 AM 3:00 PM - 92 % 3 % 6 % 100 % 0 % 0 % 36 4 Total Fans Interaction 33 Likes 2 Comments 1 Shares 4 Likes 0 Comments 0 Shares 1 0 Number of Posts Shared by Fans Sharability Ratio N/A : N/A 7:00 AM 7:00 PM 3:00 PM 7:00 AM 11:00 PM 3:00 PM - 93 % 5 % 3 % Jul 14 Jul 28 0,0100 % 0,0200 % 0,0300 % 0,0400 % 0,0104 % 0,0225 % Moving Average of Post Engagement Rate 0,0061 % -0,0084 % Change in Moving Average of Post Engagement Rate Post Engagement Rate Formula Number of Likes + Comments + Shares on a given date Number of Wall Posts made by Page × 100 Total Number of Fans on a given date 1 2 0,0225 % 0,0104 % Tremont Tearoom BostonPsychic 2Joshua the Psychic joshuathepsychic 1 Average Number of Questions per Week 0 Most Questions Responded in N/A Answered N/A Unanswered N/A N/A Average Number of Questions per Week 0 Most Questions Responded in N/A Answered N/A Unanswered N/A N/A 1 2 0,00 % 0,00 % Joshua the Psychic joshuathepsychic 2Tremont Tearoom BostonPsychic 1 Page 2 / 6 The purpose of this report is to give you an informative and simplified overview of a selected brand's performance. Please note that the numbers in this report have been trimmed by a decimal point and rounded to the nearest tenth. If you are looking for the most accurate numbers, please check in the relevant section in Analytics. Report generated by Analytics PRO, Copyright © 2014 Socialbakers, www.socialbakers.com
- 3. Jul 01, 2014 - Jul 31, 2014 Tremont Tearoom BostonPsychic Joshua the Psyc... joshuathepsychic Most Engaging Posts Overview Post Type: link Total Interactions: 9 Likes: 9 Shares: 0 Comments: 0 Engagement Rate: 0,4221 % Save 20$ off a thirty minute reading $ 20 Off at The Original Tremont Tearoom Post Type: link Total Interactions: 7 Likes: 7 Shares: 0 Comments: 0 Engagement Rate: 0,3296 % 50 % Off 30 minute phone or in person with Alex 2 days only Post Type: photo Total Interactions: 2 Likes: 2 Shares: 0 Comments: 0 Engagement Rate: 0,0942 % hi there Post Type: photo Total Interactions: 2 Likes: 2 Shares: 0 Comments: 0 Engagement Rate: 0,0939 % Here’s a favorite post of ours from the past: Wednesday 7/10/13 The following psychics will be available Alex Curtis Keith Molly Elizabeth S And Steve McManus are out of studio covering skype/email and phone ( as well as in-studio staff) #ThrowbackThursday powered by https://sumall.com/facebook Post Type: link Total Interactions: 2 Likes: 2 Shares: 0 Comments: 0 Engagement Rate: 1,0811 % “RELATIONSHIP” – A Scary Word http://awe.sm/iKyBA Post Type: link Total Interactions: 1 Likes: 1 Shares: 0 Comments: 0 Engagement Rate: 0,5435 % The secret of a happy marriage? Sleep naked: People who wear nothing in bed are most content in... Post Type: link Total Interactions: 1 Likes: 1 Shares: 0 Comments: 0 Engagement Rate: 0,5376 % Meeting coin collecting needs & educating the public about #coins for over 20 yrs! Like, share, pin & RT http://awe.sm/s700q Post Type: link Total Interactions: 0 Likes: 0 Shares: 0 Comments: 0 Engagement Rate: 0,0000 % California lawmakers should not procrastinate on water plan California lawmakers should not procrastinate on water plan Page 3 / 6 The purpose of this report is to give you an informative and simplified overview of a selected brand's performance. Please note that the numbers in this report have been trimmed by a decimal point and rounded to the nearest tenth. If you are looking for the most accurate numbers, please check in the relevant section in Analytics. Report generated by Analytics PRO, Copyright © 2014 Socialbakers, www.socialbakers.com