
Recomendados
Más contenido relacionado
Similar a Results2004 From A User Survey Of Stat Bank
Similar a Results2004 From A User Survey Of Stat Bank (20)
Último
Último (20)
Results2004 From A User Survey Of Stat Bank
- 1. Statistics Denmark Dissemination Centre, Databanks 1 December 2004 Annegrete Wulff User satisfaction survey of the StatBank, November 2004 1 Summary................................................................................... 1 2 Replies......................................................................................2 Use of StatBank..................................................................................................2 Can the users find the data?..............................................................................3 Is it easy?............................................................................................................4 The road to the StatBank...................................................................................4 Who are the users?.............................................................................................5 3 Conclusion................................................................................ 5 4 Action plan................................................................................ 6 5 Annex 1 Method.........................................................................7 6 Annex 2 Questions and answers 2002, 2003 and 2004...............9 1 Summary Statistics Denmark has for the 4th time carried out an user satisfaction survey of the statistical Internet database, StatBank. 1.177 users responded to the survey thus making the respond rate raise from 11 to 14 per cent. 32 % of the registered users responded. The user satisfaction concerning contents as well as functionality is high: 80% of the registered users are very satisfied or satisfied with the contents. 87% find the StatBank easy to use. Correspondingly 77% among the non- registered give these answers. Actions based on user suggestions and complains have been taken during the year. As a result 59 % of the registered users –compared to 51 % in 2003- claims that the always or almost always find the statistics they were looking for. Also the non-registered have improved their success rate: from 44 % in 2003 to 48 % in 2004. Our conclusion is that if we realize the problems and needs of the users we will be able – to some extent - to handle them. Among the questions in the questionnaire was an open comment question regarding contents and functionality. In general great enthusiasm for the flexibility and possibilities in the StatBank is expressed here. However, some weak points are also mentioned: more detailed data and longer time series are examples. In particular some non-registered users also complain that that the site is a bit of a mess. There are still room for improvements. In particular we need to make all the good functionality more visible – also for users who do not visit the StatBank so often. This will be reflected in the action plan for 2005. 1
- 2. The action plan 2005 will focus on: 1. The statistical content will be loaded according to the Corporate Strategy 2006 that says “The statistical information in StatBank Denmark will be expanded to contain all official statistics.” 2. We will develop an on-line demo that stepwise describes the possibilities in StatBank. 3. We will put the retrieval limit up above the existing limit of 50,000 cells for one single retrieval. 4. We will develop an aggregation facility. 5. We will investigate a possibility for simpler table presentation. Results from this and previous surveys are available on www.dst.dk/usersurvey and www.dst.dk/brugernesmening. The purpose of conducting a user satisfaction survey is to get input for Purpose improvements. StatBank users retrieve1.5 million tables yearly, so it is important to have focus on developments that are for their benefit. In the future we will complement the traditional user survey with a survey focusing on more specific functionality i.e. the selection of value process, the search functionality, the presentation of documentation and help function.. The user survey took place on the web17-25 November 2004. Survey period 2 Replies The questionnaire and all replies are found in Annex 2. In total 8610 users were exposed to the questionnaire. Because of the short Respond rate period of 10 days the more frequent users have had higher probability for being questioned. 1.177 persons answered giving a respond rate of 14%. Registered and non-registered users have respectively 32% and 12% response. Not much different from 2003. In a user survey of the web site www.dst.dk in September the respond rate was 7%. Use of StatBank Around one fourth of the users can be categorized as frequent users. They visit the StatBank weekly some of them even daily. A explanation could bet hat frequent users are more exposed to the survey as mentioned above. Use the StatBank: 2004 2003 Once a week or more often 23 % 23 % Once or twice a month 29 % 28 % Once a month or more seldom 48 % 49 % One third of the non-registered users are visiting StatBank for the first time! Most users use the StatBank in connection with work or studies. Almost half of the registered users claim that it is used in their studies. 2
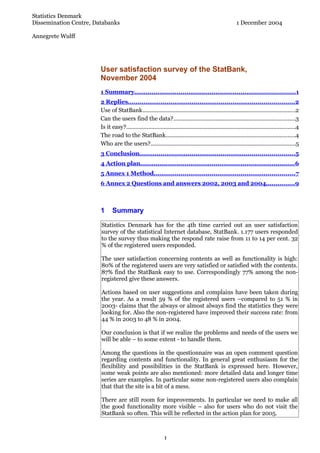
- 3. Can the users find the data? Most users find the information they are looking for: 95 % among the registered users find always or usually what they need - a little less among the non-registered. The trend was similar in 2002 and 2003. Some users are, however, disappointed because they were looking for data that Statistics Denmark does not publish. 16 % of the users gave comments of which some of this is reflected, i.e.: − The StatBank is a very user friendly and an excellent tool. I use it in my work and in my studies. However, it would appreciate more data, more detail, longer time series ;- ) Thanks for a good tool. − I would like to have more details some times. i.e. defining my own geographical area below municipality level. − Well, the contents could be more extensive. I presume it is a political decision. Yet, another reason for disappointment is that the contents are considered too overwhelming and difficult to overview: − How to navigate on your site is not evident to me it. I am taken to sub sites where I do not know what to do. − It is a bit confusing. I do my best and in the end I am confident that I shall succeed. − It is somehow confusing for a beginner to be confronted with all the choices of selection. . And another one who says: − This is a most well arranged and user friendly site! The search function is in-house developed. During the year it has been The search function is used improved. It now includes common misspellings. Regularly a list of words more often entered in the search field is analysed. If a text is used with out result more than four times we consider linking it to a relevant subject. Search results are presented with the most important first. If there is nothing in the StatBank a link to the Statistical Yearbook would be presented. The search function is now used by 14 % of the users as the preferred way to reach the data. This is a slight increase from 11 % in 2003. However, the most used way to get data is by selecting one of the 17 subject areas. More users are satisfied with the search function. Among the registered users 45 % claim to be satisfied. Data are linked to documentation through footnotes describing the table Documentation and declaration of contents describing the whole survey. Moreover a contact person is mentioned with telephone number and e-mail address. The documentation available on the web has been used by half of all users. Over the years there is an increasing satisfaction with the documentation: 3
- 4. Fully satisfied with the documentation per cent 25 20 registered users 15 Not-registered 10 users 5 0 2002 2003 2004 Some respondents have commented on this. Apparently there is a need for specific definitions of the variables: − What you do is very good. However, the explanation of what is behind the figures, the documentation is too general. Most evident if I select data from areas where I have only little knowledge. Is it easy? Most respondents find it easy or very easy to use the StatBank: 87 % of the registered and 76% of the not-registered users give that answer. This is reflected in the comments given. A few comments, however, show the users also may have problems: − It is the easiest application that I know of, for instance compared to Eurostat. − No comments. The StatBank is good!! − Very big retrievals take time. Please, speed it up. − The user friendliness could be improved. − Excellent tool! − Good work, you guys. − Impossible to handle. The road to the StatBank Some users go directly to the StatBank (www.statbank.dk) while others come via a link on the general web site (www.dst.dk). The most frequent preferences look differently for registered users and not- registered users: Registered users Not-registered users www.statistikbanken.dk 42 % via www.dst.dk 42 % 4
- 5. saved in bookmarks 29 % www.statistikbanken.dk 28 % via www.dst.dk 24 % from external search 12 % other 5% other 18% The registered users tend to go directly to the StatBank while the not- registered more often come through the homepage. Who are the users? Although the number of male users still exceeds the number of female users Growing number of women the tendency diminishes. In 2002 female users counted for 32% of all, in 2003 35% and in 2004 43 % of the responding users were women. The age group 18-29 years has increased from 40% to 55 % among the More young users registered users and from 49% to 55% among the not-registered. Similarly the group of students now counts for almost half of all users. The group of private persons have increased to 10 % of all. Registered users Registered users that in the StatBank responded Press, media 2,8 3,3 Library 1,3 17,0 Research and educational institutions 26,6 8,5 State administration 3,8 5,6 Local administration 8,4 7,8 Student 23,7 41,9 Private person 12,6 13,3 Enterprises 15,1 1,9 Organisations et cetera. 3,2 0,4 Other 2,6 0,4 Total 100,0 100,0 The table above shows the distribution of registered users in the user database to compare with the distribution among registered users that responded to the survey. There is a overrepresentation among students and libraries, while the enterprises and research & educational institutions are under represented in the survey. 3 Conclusion The responses are not randomly. Frequent users have had higher probability to get the questionnaire pop-up. When we in the text refer to users, it should be borne in mind that it actually is the responding users only. Over the years we do not register immense changes: most users find what they are looking for. Most users find The StatBank easy to use. The search facility has been improved and consequently the search results are considered better. However, there is still room for further improvements. Only a few users actually look into the documentation. The ones that do, find it has reached a satisfactory level. At the same time more “down-on- the-earth” documentation is required to understand the table contents. The personal help and hot-line support provided via telephone and e-mail is ranked as high class service. 5
- 6. Finally, the users mention more often the need for extension of the content than functionality. 4 Action plan An action plan for 2005 has been set up according to comments from the users: 1. We will extend the StatBank content following the objectives set up in Strategy 2006: “All official statistics that is published should be in available in the StatBank.” 2. We will make an on-line demo that stepwise shows how to search, select and retrieve data from the StatBank. 3. We will make it possible for users to retrieve very large data files (exceeding the 50,000 cells limit we have today). 4. We will develop an aggregation facility. 5. We will find alternatives for presenting overview tables. 6
- 7. 5 Annex 1 Method There are two types of users in StatBank, both have access free-of-charge to all data: 1. Registered users (They have registered themselves and chosen a user-ID and password. Moreover they have delivered their e-mail address. When they register they get some advantages. The registered user can retrieve up to 50,000 data cells in one table; they can save a query; they can create own lists of values to be reused; they get a newsletter 5-7 times a year and they can set up their own user profile.) 2. Non-Registered users (quot;guestsquot;, can only retrieve up to 1,000 data cells from a cross- table) Among the registered users we selected the ones that had been active during the last five months. This made a total of 9,241 persons. Among the non-registered users, everybody who entered the StatBank in the period of investigation was exposed to the questionnaire. This turned out to be 8,340 unregistered users. The questionnaire popped up when they entered the StatBank. It could be answered at once or ignored. If it was not answered it popped up again in connection with the following visit. The staffs in Statistics Denmark were excluded. The survey took place 17-25 November 2004. A registered user that finished the questionnaire had their answers registered in a database. A cookie was set in the PC of the non-registered user when he had answered the scheme. This was done to prevent the scheme to pop up again. The user could of course delete the cookie himself. In that case he would be confronted with the questions again. We have no indications whether this has happened. We realise that this design presents a bias, the more active users are over represented: The more active a user is the bigger the chance he will use the StatBank in the short period of the survey. We could not predict how many registered users would be exposed to the Response willingness was questionnaire: big among the registered The actual active registered users in the survey period counted 852 people. users… If all of these had answered the response rate had been 100 %. That would of course have been most unexpected. 270 people responded thus making the response rate 32 %. The response rate is considerably lower among the non-registered users: …… but low among the 7,758 logged in as guests. 902 or 12 % of these have answered the questions. non-registered We believe that the users who answered are the most concerned and not necessarily representative for all users. Nevertheless, we get a picture of the problems that the less experienced users face, as around half of the non- registered are beginners. Responses 2004: 7
- 8. Not- Total Registered registered external users users users 8610 Number Possible responses 852 7758 1177 Actual responses 270 907 13,7 Response rate 31,6 11,6 As the proportion of non-registered users is high the average response rate is only 14 %. However, we regard the two groups as separate populations, as we consider the situation for the non-registered and the registered to be quite different. Their needs for functionality differ and in order to serve both groups best we suggest looking at them separately. The respondent was free to skip a question and anyhow go on to the next. No incentives were given for answering the scheme. The estimated time to answer was 3-4 minutes. Neither the quality nor the response rate was considered to improve by incentives. 8
- 9. 6 Annex 2 Questions and answers 2002, 2003 and 2004 Three minutes of your time could help us making StatBank Denmark better. We intend to develop the database further according to the users' needs. This is why we ask you to spend three minutes to give your opinion of the database and the way it is used. I want to answer the questionnaire now. I want to return to the StatBank Denmark. 1) How often do you use StatBank Denmark? 2004 2003 2002 Registered Non- Registered Non- Registered Non- users Registered users Registered users Registered Number Once a week or more 89 178 123 164 180 72 A couple of times a month 107 235 108 238 226 111 Once a month or less 69 231 48 216 101 113 This is my first time 5 263 5 325 11 309 No answer - - 1 4 - 2 Total 270 907 285 947 518 607 Per cent Once a week or more 33,0 19,6 43,2 17,3 34,8 11,9 A couple of times a month 39,6 25,9 37,9 25,1 43,6 18,3 Once a month or less 25,6 25,5 16,8 22,8 19,5 18,6 This is my first time 1,9 29,0 1,8 34,3 2,1 50,9 No answer - - 0,4 0,4 0 0,3 Total 100,0 100,0 100,0 100,0 100 100 2) What is the purpose of your retrieval of data from StatBank Denmark? 2004 2003 2002 Registered Non- Registered Non- Registered Non- users Registered users Registered users Registered Number Study related 112 494 85 478 71 250 Work related 150 305 184 332 404 234 Personel interest 8 71 10 86 37 82 Other purposes 0 24 3 27 5 26 Do not know yet 0 11 1 19 1 12 No answer 0 2 2 5 - 3 Total 270 907 285 947 518 607 Per cent Study related 41,5 54,5 29,8 50,5 13,7 41,2 Work related 55,6 33,6 64,6 35,1 78 38,5 Personel interest 3,0 7,8 3,5 9,1 7,1 13,5 Other purposes 0,0 2,6 1,1 2,9 1 4,3 Do not know yet 0,0 1,2 0,4 2,0 0,2 2 No answer 0,0 0,2 0,7 0,5 0 0,5 Total 100,0 100,0 100,0 100,0 100,0 100,0 9
- 10. You have access to StatBank without a registered password. However. if you choose to register - which is free of charge – you will have access to retrieve much larger tables. save queries and selection lists for re-use. 3) ) Were you aware of these advantages? 2004 2003 2002 Registered Non- Registered Non- Registered Non- users Registered users Registered users Registered Number Yes 206 206 . 146 No 543 574 . 458 I have registered but do not always logon 133 141 I have registered but forgot my password 22 20 No answer 3 6 . 3 Total 907 947 . 607 Per cent Yes 22,7 21,8 . 24,1 No 59,9 60,6 . 75,5 I have registered but do not always logon 14,7 14,9 I have registered but forgot my password 2,4 2,1 No answer 0,3 0,6 . 0,5 Total 100,0 100,0 . 100 4) Do you usually find the statistics you are looking for? 2004 2003 2002 Registered Non- Registered Non- Registered Non- users Registered users Registered users Registered Number Always 20 40 17 41 26 27 Almost always 136 275 147 259 230 104 Usually 97 259 101 264 222 137 Almost never 12 61 12 46 25 23 I did not need anything specific. only browsing 0 8 2 7 1 3 No answer 0 1 1 5 3 4 Total 265 644 280 622 507 298 Per cent Always 7,5 6,2 6,1 6,6 5,1 9,1 Almost always 51,3 42,7 52,5 41,6 45,4 34,9 Usually 36,6 40,2 36,1 42,4 43,8 46 Almost never 4,5 9,5 4,3 7,4 4,9 7,7 I did not need anything specific. only browsing 0,0 1,2 0,7 1,1 0,2 1 No answer 0,0 0,2 0,4 0,8 0,6 1,3 Total 100,0 100,0 100,0 100,0 100 100 5) How do you usually select statistics? 10
- 11. 2004 2003 Registered Non- Registered Non- users Registered users Registered Number Through the list of 16 subject areas 161 344 179 353 Writing in the search window 37 118 31 107 Use the two methods equally 65 148 67 133 Do not know 2 31 2 25 No answer 0 3 1 4 Total 265 644 Per cent Through the list of 16 subject areas 60,8 53,4 63,9 56,8 Writing in the search window 14,0 18,3 11,1 17,2 Use the two methods equally 24,5 23,0 23,9 21,4 Do not know 0,8 4,8 0,7 4,0 No answer 0,0 0,5 0,4 0,6 Total 100,0 100,0 100,0 100,0 6) How bad or good would you judge the search result you get using the search window? 2004 2003 Registered Non- Registered Non- users Registered users Registered Number Very good. I always get good results 13 35 18 39 Good. Usually I find something useful 106 215 97 231 Acceptable. 78 217 97 183 Bad. I seldom find anything useful 23 83 16 71 I have not tried it 44 91 50 91 No answer 1 3 2 7 Total 265 644 280 622 Per cent Very good. I always get good results 4,9 5,4 6,4 6,3 Good. Usually I find something useful 40,0 33,4 34,6 37,1 Acceptable. 29,4 33,7 34,6 29,4 Bad. I seldom find anything useful 8,7 12,9 5,7 11,4 I have not tried it 16,6 14,1 17,9 14,6 No answer 0,4 0,5 0,7 1,1 Total 100,0 100,0 100,0 100,0 7) Have you ever used the information under the tab quot;Information quot; 2004 2003 2002 Registered Non- Registered Non- Registered Non- users Registered users Registered users Registered Number Yes 136 223 156 218 227 81 No 126 417 123 394 276 213 No answer 3 4 1 10 4 4 Total 265 644 280 622 507 298 Per cent Yes 51,3 34,6 55,7 35,0 44,8 27,2 No 47,5 64,8 43,9 63,3 54,4 71,5 No answer 1,1 0,6 0,4 1,6 0,8 1,3 Total 100,0 100,0 100,0 100,0 100 100 7a) Is the documentation sufficient? 2004 2003 2002 Registered Non- Registered Non- Registered Non- users Registered users Registered users Registered Number Completely sufficient 29 45 18 42 32 9 More or less sufficient 84 145 112 149 154 53 Insufficient 22 29 23 22 36 16 11
- 12. Completely insufficient 0 2 2 2 2 2 No answer 1 2 1 3 3 1 Total 136 223 156 218 227 81 Per cent Completely sufficient 21,3 20,2 11,5 19,3 14,1 11,1 More or less sufficient 61,8 65,0 71,8 68,3 67,8 65,4 Insufficient 16,2 13,0 14,7 10,1 15,9 19,8 Completely insufficient 0,0 0,9 1,3 0,9 0,9 2,5 No answer 0,7 0,9 0,6 1,4 1,3 1,2 Total 100,0 100,0 100,0 100,0 100 100 8) How satisfied are you in general with the contents of StatBank Denmark? 2004 2003 2002 Registered Non- Registered Non- Registered Non- users Registered users Registered users Registered Number Very satisfied 45 93 54 84 72 34 Satisfied 167 401 164 382 320 171 Neither satisfied nor unsatisfied 43 115 44 117 86 70 Unsatisfied 10 33 14 27 24 15 Very unsatisfied 0 1 2 5 4 3 No answer 0 1 2 7 1 5 Total 265 644 280 622 507 298 Per cent Very satisfied 17,0 14,4 19,3 13,5 14,2 11,4 Satisfied 63,0 62,3 58,6 61,4 63,1 57,4 Neither satisfied nor unsatisfied 16,2 17,9 15,7 18,8 17 23,5 Unsatisfied 3,8 5,1 5,0 4,3 4,7 5 Very unsatisfied 0,0 0,2 0,7 0,8 0,8 1 No answer 0,0 0,2 0,7 1,1 0,2 1,7 Total 100,0 100,0 100,0 100,0 100 100 9) How do you in general find the functionality of StatBank Denmark? 2004 2003 2002 Registered Non- Registered Non- Registered Non- users Registered users Registered users Registered Number Very easy to use 48 105 75 102 94 39 Easy to use 183 388 179 373 340 182 Tiresome 32 135 24 129 69 57 Very tiresome 2 12 1 11 4 9 No answer 0 4 1 7 - 11 Total 265 644 280 622 507 298 Per cent Very easy to use 18,1 16,3 26,8 16,4 18,5 13,1 Easy to use 69,1 60,2 63,9 60,0 67,1 61,1 Tiresome 12,1 21,0 8,6 20,7 13,6 19,1 Very tiresome 0,8 1,9 0,4 1,8 0,8 3 No answer 0,0 0,6 0,4 1,1 0 3,7 Total 100,0 100,0 100,0 100,0 100 100 10) How did you reach the StatBank today? 2004 2003 Registered Non- Registered Non- users Registered users Registered Number By writing the url www.statbank.dk 114 255 106 228 From the homepage www.dst.dk 64 378 77 399 Via a saved favorite in my browser 77 82 89 110 Via link on another homepage 2 65 2 67 Via an external search engine 7 109 6 118 Via a link in an e-mail ( Datashooting) 4 3 3 Do not know 1 13 4 14 12
- 13. No answer 1 2 1 8 Total 270 907 285 947 Per cent By writing the url www.statbank.dk 42,2 28,1 37,2 24,1 From the homepage www.dst.dk 23,7 41,7 27,0 42,1 Via a saved favorite in my browser 28,5 9,0 31,2 11,6 Via link on another homepage 0,7 7,2 0,7 7,1 Via an external search engine 2,6 12,0 2,1 12,5 Via a link in an e-mail ( Datashooting) 1,5 0,3 0,0 0,3 Do not know 0,4 1,4 1,4 1,5 No answer 0,4 0,2 0,4 0,8 Total 100,0 100,0 100,0 100,0 11 Sex: 2004 2003 2002 Registered Non- Registered Non- Registered Non- users Registered users Registered users Registered Persons Man 153 472 182 531 349 331 Woman 116 432 100 408 168 272 No answer 1 3 3 8 1 4 Total 270 907 285 947 518 607 Per cent Man 56,7 52,0 63,9 56,1 67,4 54,5 Woman 43,0 47,6 35,1 43,1 32,4 44,8 No answer 0,4 0,3 1,1 0,8 0,2 0,7 Total 100,0 100,0 100,0 100,0 100 100 12) Age: 2004 2003 2002 Registered Non- Registered Non- Registered Non- users Registered users Registered users Registered Persons 17 years or less 0 75 4 84 5 74 18-29 years 149 494 115 464 197 249 30-49 years 93 259 123 294 244 202 50-64 years 24 70 40 88 67 69 65 years or more 3 6 2 12 3 6 No answer 1 3 1 5 2 7 Total 270 907 285 947 518 607 Per cent 17 years or less - 8,3 1,4 8,9 1 12,2 18-29 years 55,2 54,5 40,4 49,0 38 41 30-49 years 34,4 28,6 43,2 31,0 47,1 33,3 50-64 years 8,9 7,7 14,0 9,3 12,9 11,4 65 years or more 1,1 0,7 0,7 1,3 0,6 1 No answer 0,4 0,3 0,4 0,5 0,4 1,1 Total 100,0 100,0 100,0 100,0 100 100 13) In which group would you place your self? 2004 2003 Registered Non- Registered Non- users Registered users Registered Press, media Number 9 25 8 24 Students 113 488 90 461 Educational institution 16 38 13 55 13
- 14. Research institution 7 44 Private person 27 123 3 64 Enterprise 5 5 41 135 Library 46 55 59 7 Local authority 21 49 35 78 State administration 15 30 25 44 Organisation 1 6 2 34 Retired 9 20 7 4 Foreign enterprise .. .. 1 12 Other 1 23 1 22 No answer - 1 8 7 Total 270 907 293 947 Press, media Per cent 3,3 2,8 2,7 2,5 Students 41,9 53,8 30,7 48,7 Educational institution 5,9 4,2 4,4 5,8 Research institution 2,6 4,9 - - Private person 10,0 13,6 1,0 6,8 Enterprise 1,9 0,6 14,0 14,3 Library 17,0 6,1 20,1 0,7 Local authority 7,8 5,4 11,9 8,2 State administration 5,6 3,3 8,5 4,6 Organisation 0,4 0,7 0,7 3,6 Retired 3,3 2,2 2,4 0,4 Foreign enterprise - - 0,3 1,3 Other 0,4 2,5 0,3 2,3 No answer 0,0 0,1 2,7 0,7 Total 100,0 100,0 100,0 100,0 14) Any other comments concerning the contents or user interface of the StatBank Denmark? write::………………………………………………… ……………………………………………………….. Write your e-mail address if you would like to have a comment or answer from Statistics Denmark……………. 2004 2003 2002 Registered Non- Registered Non- Registered Non- users Registered users Registered users Registered Comments mentioned Number 45 138 69 179 140 118 No comments mentioned 225 769 216 768 378 489 Total 270 907 285 947 518 607 Comments mentioned Per cent 16,7 15,2 24,2 18,9 27,0 19,4 No comments mentioned 83,3 84,8 75,8 81,1 73,0 80,6 Total 100,0 100,0 100,0 100,0 100,0 100,0 Registered users among respondents compared to the registered users in the StatBank Registered users In StatBank Respondents % number % number County/municipality 10,6 975 11,9 35 No information 2,4 219 3 9 Library 1,2 111 20,1 59 Organizations 4 369 0,7 2 Press, Media 3 277 2,7 8 Private people 12,2 1124 3,4 10 State Institution 5 460 8,5 25 14
- 15. Students 20,8 1923 30,7 90 Education and Research 23,7 2191 4,6 13 Enterprises 17,2 1592 14,4 42 Total 100 9241 100 293 15