1. 1
CHAPTER I
INTRODUCTION
1.1. Introduction
The title of the project is “Technical Analysis” a Tool for Investment
Decision Making with Special Focuses on BLUECHIP AUTOMOBILE INDUSTRIES
in AUTO NIFTY on NSE” carried out in future investments for investors. It is done
mainly to analyze indices and the role of technical analysis in decision making. This
project aimed the researcher a lot in putting theoretical knowledge that the researcher had
gained through his academics, in to practical. And also the researcher has gain theoretical
as well as practical knowledge about share market and the activities undertaken in a share
broking company. Hence the researcher feels this project is definitely relevant to the
MBA degree that the researcher is pursuing.
A method of evaluating securities by analyzing statistics generated by
market activity, such as past prices and volume. Technical analysts do not attempt
to measure a security's intrinsic value, but instead use Figures and other tools to
identify patterns that can suggest future activity.
This is an important technique, which is used to predict the future
performance of the stocks. It is mainly concerned with the study of the historical price
movements of the stocks and on its volume of trade in the market to predict the future
trend movements of the stock. However, it does not consider any fundamental factors
of the company like earnings, dividends, growth rates etc.
This research aims at Technical analysis of the major Automobile four wheeler
blue chip companies listed in the National stock exchange and also to suggest the investor
to buy, sell or hold the shares and also to suggest the best investment alternative
using the RSI (Relative Strength Index), MFI (Money Flow Index), MACD
(Moving Average convergence / divergence), to study about the Risk factor of the
Automobile four wheeler blue chip companies stocks through the Beta calculation and
2. 2
also to study about the market trend of the three Automobile four wheeler blue
chip companies through the vortex Indicator. For this analysis three companies are
taken from the Automobile sector.
For this study the researcher has taken one year (January — December 2014)
solid data from the National Stock Exchange website and to predict the market trends of
bluechip companies.
1.2. STATEMENT OF THE PROBLEM
The investors have difficult to identify the Risk factor of the Blue
chip four wheeler Automobile Company's shares.
Investment timing plays a crucial role for trading in stock market trading.
The investors face difficulty while identifying the opportunities.
The investors have difficulty to identify the appropriate overbought and
oversold condition of the Blue chip four wheeler Automobile Company's
scripts.
1.3. OBJECTIVES OF THE STUDY
Primary objectives
• To study the relationship between the CNX AUTONIFTY and Blue chip
four wheeler Automobile company’s stocks.
Secondary objectives
• To study the strength of Blue chips four wheeler Automobile Company’s stocks.
• To know the risk factor in the selected automobile company’s shares.
• To know the buy and sell signal position in market trend of Blue chip
four wheeler Automobile company’s stocks.
• To find out the overbought and oversold condition of Blue Chip Automobile
Company’s share.
• To find out trend following the momentum of the selected automobile company’s
stocks.
3. 3
1.4. SIGNIFICANCE OF THE STUDY
This is the task of conducting a research on behavior of stocks in stock market.
The main aim of the study is to find out the relationship between blue-chip automobile
company’s and CNX AUTO and to suggest the investors about the price movements of
blue-chip stocks.
1.5. SCOPE OF THE STUDY
The study is related to technical analysis to predict the future price
movement of the stocks.
The analysis has been done on Blue chip four wheeler Automobile
companies of Auto Nifty.
This analysis is directed towards the use of different tools of Technical
analysis which help the investor to identify and decide when to buy or sell.
This study will help the investors to identify the strength of the Blue
chip four wheeler Automobile Company's stocks.
This study will also help the investors to identify the overbought
and oversold condition of selected Automobile company's stocks.
1.6. RESEARCH METHODOLOGY
Research is a systematic and continues method of defining a problem, collecting
the facts and analyzing them, reaching conclusion forming generalizations. Research
methodology is a way to systematically solve the problem. It may be understood has a
science of studying how research is done scientifically.
1.6.1. RESEARCH DESIGN
A research design is the arrangement of condition for collection and analysis of
data in a manner that aims to combine relevance to the research purpose with
economy in procedure. It is the conceptual structure within which research is
conducted. Analytical Research is used in this study.
4. 4
1.6.2. SOURCES OF DATA
The main sources of data for the present study used are secondary in
nature. Secondary data consists of information that already exists somewhere and has
been collected for specific purpose in the study. Secondary data has been obtained by the
national stock exchange website. For the purpose of this study the daily closing
prices of Three Blue chip four wheeler Automobile companies listed in National
stock exchange were taken and analysis them through the technical tools.
1.7.3. TOOLS FOR ANALYSIS
The following are the tools have been used in this research
Correlation
RSI (Relative Strength Index)
Beta
CORRELATION
In statistics, the Pearson product -moment correlation coefficient (r) is a common
measure of the correlation between two variables X and Y. When measured in a
population the Pearson Product Moment correlation is designated by the Greek letter rho
(?). When computed in a sample, it is designated by the letter "r" and is sometimes
called "Pearson's r." Pearson's correlation reflects the degree of linear relationship
between two variables. It ranges from +1 to -1. A correlation of +1 means that there
is a perfect positive linear relationship between variables. A correlation of - 1
means that there is a perfect negative linear relationship between variables. A
correlation of 0 means there is no linear relationship between the two variables.
Correlations are rarely if ever 0, 1, or -1. If you get a certain outcome it could indicate
whether correlations were negative or positive. The quantity r, called the linear
correlation coefficient, measures the strength and the direction of a linear
relationship between two variables. The linear correlation coefficient is sometimes
5. 5
referred to as the Pearson product moment correlation coefficient in honor of its
developer Karl Pearson.
The mathematical formula for computing r is:
Co-efficient of correlation r =
RELATIVE STRENGTH INDEX (RSI):
Calculation:
RS = Average Gain / Average Loss
To simplify the calculation explanation, RSI has been broken down into its
basic components:
RS, Average Gain and Average Loss. This RSI calculation is based on 14 periods,
which is the default suggested by Wilder in his book. Losses are expressed as
positive values, not negative values.
The very first calculations for average gain and average loss are simple 14
period averages.
First Average Gain = Sum of Gains over the past 14 periods / 14.
First Average Loss = Sum of Losses over the past 14 periods / 14
The second, and subsequent, calculations are based on the prior averages and the
current gain loss:
Average Gain = [(previous Average Gain) x 13 + current Gain] / 14.
Average Loss = [(Previous Average Loss) X 13 + Current Loss] / 14.
The broad rule is the RSI ranges from 0 to 100. An asset is deemed to be
overbought once the RSI approaches the 70 level, meaning that it may be getting
overvalued and is a good candidate for a pullback. Likewise, if the RSI
6. 6
approaches 30, it is an indication that the asset may be getting oversold and
therefore likely to become undervalued. RSI values above 70 are considered to
denote overbought condition and values below 30 are considered to denote
oversold condition. When the RSI has crossed the 30 line from below to
above and is rising, a buying opportunity is indicated. When it has crossed
70 line from above to below and is falling, a sell signal is indicated.
BETA
A measure of the volatility,or systematic risk, of a security or a portfolio in comparison to
the market as a whole. Beta is used in the capital asset pricing model (CAPM), a model
that calculates the expected return of an asset based on its beta and expected market
returns.. Also known as "beta coefficient"
Beta is calculated using regression analysis, and you can think of beta as the
tendency of a security's returns to respond to swings in the market. A beta of 1 indicates
that the security's price will move with the market. A beta of less than 1 means
that the security will be less volatile than the market. A beta of greater than 1
indicates that the security's price will be more volatile than the market. For example, if a
stock's beta is 1.2, it's theoretically 20% more volatile than market.
The beta calculated the following formula :
1.7. PERIOD OF THE STUDY
This study was done for the period from February 1st to April 30th.
1.8. AREA OF THE STUDY
The study has been done in Future Investments, Tuticorin. A channel partner of ICICI
securities, in the field of finance.
7. 7
1.9. LIMITATIONS OF THE STUDY
The study is only focused on three Automobile companies in CNX AUTO
NIFTY.
The study only focused on Technical Analysis but the Fundamental Analysis is
also an important study analysis for the determination of company's stock
price movement.
The limited Technical tools only have been used for this study.
Very short period of time for the study.
1.10. CHAPTER SCHEME
Chapter I
It covers the introduction about the topic, on technical analysis, the
problem statement, objectives, significance, scope, the research design, methods
and tools used, sampling design, period of the study, area of the study and
limitations.
Chapter II
It covers the literature review from the journals, books and reports.
Chapter III
It covers Industry and company profile and other criteria holding to
research methods.
Chapter IV
It covers the technical analysis and interpretation of data with tables and
charts.
Chapter V
It covers the summary of findings, suggestions and conclusions regarding
the analysis of Blue-chip Company’s on auto nifty to investors and employees.
8. 8
CHAPTER-II
REVIEW OF LITERATURE
Review of Literature
According to Achelis "Technical analysis is the process of analyzing a
security's historical prices in an effort to determine probable future prices"
According to Edwards, Magee and Bassetti "It refers to the study of the
action of the market itself as opposed to the study of the goods in which the market
deals. Technical Analysis is the science of recording, usually in graphic form, the actual
history of trading (price changes, volume of transaction, etc.) in a certain stock or in "the
Averages" and then deducing from that pictured history the probable future trend"
According to Murphy "Technical analysis is the study of market action, primarily
through the use of Figures, for the purpose of forecasting future price trends. The term
"market action" includes the three principal sources of information available to the
technician-price, volume, and open interest."
According to Ping "The art of technical analysis, for it is an art, is to
identify a trend reversal at a relatively early stage and ride on that trend until the weight
of the evidence shows or proves that the trend has reversed. Therefore, technical analysis
is based on the assumption that people will continue to make the same mistakes they have
made in the past."
According to Cory Janssen, Chad Langager and Casey Murphy "Technical
analysis is a method of evaluating securities by analyzing the statistics generated by
market activity, such as past prices and volume. Technical analysis do not attempt to
measure a security's intrinsic value, but instead use Figures and others tools to identify
patterns that can suggest the buy and sell of the stocks.
Fernando Fernandez-Rodriguez (1999) "Technical Analysis in the Madrid
Stock Exchange" The researcher assessed whether some simple forms of technical
analysis can predict stock price movement in the Madrid stock exchange, covering
9. 9
thirty-one-year period from Jan 1966 –Oct 1997.the results provide strong support
for profitability of those technical trading rules. By making use of bootstrap
techniques the author shows the returns obta ined from these trading rules are not
consistent with several null models frequently used in finance.
Rajesh, (2008) "A study on Technical Analysis to guide the investors for
forecasting future price from their investment from these scrip's in Religare
Enterprises Ltd" The main purpose of the study is how to analysis and guide the
investor for receiving benefits of investment from their scrip's. The analysis has been
done through RSI (Relative Strength Index), MFI (Money Flow Index), Moving
Averages (50days & 200days) on ten selected stocks. The
project period was 4months Period of the Study: 01-Mar-2007 to 31-Mar-2008. It
will give knowledge, where the investors going to invest. The study also protects
investor's investment from poorly performing company.
The study concludes that Technical analysis tools are used to the investor
to get knowledge about the future movement of scrip's; the technical analysis is
not understood and used in a single day. Investors get benefits from the technical
analysis were used to develop the market share and enjoy the project benefit.
Hemanth CR Patna (2010) "A study of Technical analysis in different sectors
stocks at Kotak Securities Limited" The study is related to technical analysis to
predict the future behaviour of the stocks. The analysis has been done on 5 selected
stocks of NIFTY in order to gain the practical knowledge of technical analysis. This
research helps the investor to know how Figuring techniques are useful to take buy or sell
decisions
According to RSI indications, it is better to take long position when RSI line
touches or goes near to oversold market condition i.e., near or less than 30 level. On the
other hand, It is better to take short position when RSI line touches or goes near to
overbought market co ndition i.e., near or more then 70 level. Secondly, according to
moving averages indications it is better to take long position when there is bullish
10. 10
divergence. On the other hand 't is better to take short position when there{ is bearish
divergence.
Paul Abbondante (2010) "Trading Volume and Stock Indices: A Test of
Technical Analysis" its emphasis on trading volume has been used to analyze
movements in individual stock prices and make investment recommendations to
either buy or sell that stock. Little attention has been paid to investigating the
relationship between trading volume and various stock indices.
Approach: Since stock indices track overall stock market movements, trends in
trading volume could be used to forecast future stock market trends. Instead of
focusing only on individual stocks, this study will examine movements in major
stock markets as a whole. Regression analysis was used to investigate the
relationship between trading volume and five popular stock indices using daily data
from Janu ary, 2000 to June. 2010. A lag of 5 days was used because this represents the
prior week of trading volume.
Narendra N. Patel (2010) "Trading through Technical Analysis" The objective
of this research is to find out appropriate time to buy and sell securities based on selected
indicator and oscillator and understanding the technical analysis theories and
methods to analyze Figures of the 5 companies using technical analysis.
The analysis has done through major indicators MACD (Moving Average
Convergence and divergence), RSI (Relative Strength Index) to help suggest
investment decision by suggesting buying and selling signals. Secondary data has
been collected for this research and the period of study was one year (2009-10).
Descriptive research design has been used for helps to find out (explore) meaning out of
the secondary data. From this research, the researcher found that it is really a nice
approach to estimate the future. It really helps to catch the small moves and gives the
opportunity to investor to get returns in the small and long run also.
Balaji (2010) "Technical Analysis of Cement Sector in India" The purpose of
this study is helps to predict or forecast the short, intermediate & long term price
movements and also helps to know when to buy and sell the stock by analyzing technical
11. 11
indicators. And helps to measure to the rate of change between the current price and
price in past and to identify overbought& oversold region. The art of technical
analysis for it is an art is to identify trend changes at an early stage and to maintain
an investment an investment posture until the weight of the evidence indicates that the
trend has been reversed.
Mahesh Giri (2011) "A Study on Technical Analysis With Reference to
Technical Indicators in Capital Market" The objective of this study understand the
concept of Technical analysis, to know about various indicators and tools used in
technical analysis, to study how the indicators help to predict the future of a stock, to
generate long and short positions using the indicators (RSI, MFI, SMA). This analysis
concludes that the various efforts carried out by stock market experts to predict the
market's movements. Such a tool is Technical analysis which helps the investors to
identify the right stocks at right time with right amounts.
Yuanyuan Zhao (2011) "Effectiveness of Technical Indicators in Singapore
Stock Market" in this paper author evaluates the effectiveness (profitability) of technical
analysis, in particular the use of indicators in combinations, in the Singapore context. He
benchmarking the annualized percentage returns on two groups of SGX-listed companies
against buy-and¬hold for a period of two years, as well as comparing between groups.
The focus of this study is to find out whether the use of technical indicators,
especially in combinations, is able to generate significantly higher returns than buy-
and-hold. As a result, he found out that technical analysis does not generate
significantly superior results than buy-and-hold strategy with respect to Singapore
securities market.
Sanket Dhanorkar (2011) "How to identify momentum stocks for quick short
term gains" investing involves buying and selling stocks that are likely to witness a
substantial jump in prices in a short span of time. In other words, the investor buys stocks
that a re about to soar and sells them at a much higher price. As a momentum investor,
one seeks to identify stocks that have the potential to yield spectacular returns within a
short to medium holding period, say, 1 -6 months. When the market rallies, momentum
stocks are usually better placed to lead the market and touch new highs.
12. 12
For those keen on making money from this strategy, there are several indicators or
tools that can help identify momentum stocks. They are ROC (Rate of Change),
Volume, MACD Hitesh Sheth, head, technical research, Prabhudas Lilladher, says,
"Momentum investing can be rewarding if you can master the use of the indicators
available. The strategy can work both ways—you can ride the bull markets as well as
benefit from market declines.
Krishnadev (2011) The project "study on stock movement using technical
analysis" was undertaken with a objective of how to make efficient buying and
selling decisions in stock markets. A study was conducted how effectively
technical analysis can be used for making trading and investment decisions. Some of
the import technical indicators like moving averages, MFI, RSI were covered in this
study. By comparing the indicator Figure with the price movement future stock
market movement can be identified.From this analysis it is revealed that an analysis of
Figures and indicators are enough to arriving at an accurate selling or buying
decisions. A conjunction of all this is required for making accurate decisions. So
technical analyst not only required knowledge but also good skills for perfection.
Cagan Deep Sharma (2011) "How useful is technical analysis in predicting
future stock trends" The study builds on the literature already available on financial data
of the companies in India. The study is conducted to test out the usefulness of the
technical analysis in predicting the future market trends therefore the author have taken
the 15 companies for the month of January. The author have taken their current price on
the recommended day and the target price given by the analysts on the recommended day
and then further taken the highest and the lowest months in the following two months that
is January and February and see the recommendations given by the analysts to the
investors to buy or to sell the securities is actually comes out to be true or not. The
researcher has used mean, regression and t- tailed test to prove the results.
13. 13
CHAPTER-III
INDUSTRY PROFILE AND COMPANY PROFILE
3.1. INDUSTRY PROFILE
AN OVERVIEW OF THE INDIAN SECURITIES MARKET
Securities market provides a channel for allocation of savings to those who have a
productive need for them. The securities market has two interdependent and inseparable
segments: (i) Primary market (ii) secondary market.
Primary market
Primary market provides opportunity to issuers of securities; government as well as
corporate, to raise resources to meet their requirements of investment and/or discharge
some obligation. They may issue the securities at face value, or at a discount/premium
and these securities 15may take a variety of forms such as equity, debt etc. They may
issue the securities in domestic market and/or international market. The primary market
issuance is done either through public issues or private placement. A public issue does
not limit any entity in investing while in private placement, the issuance is done to select
people. In terms of the Companies Act, 1956, an issue becomes public if i t results in
allotment to more than 50 persons.
The secondary market
The secondary market enables participants who hold securities to adjust their
holdings in response to changes in their assessment of risks and returns. Once new
securities are issued in the primary market, they are traded in the stock (secondary)
market. The secondary market operates through two mediums, namely, the over-the-
counter (OTC) market and the exchange traded market. The OTC markets are informal
markets where trades are negotiated. Most of the trades in government securities take
place in the OTC market. All the spot trades where securities are traded for immediate
delivery and payment occur in the OTC market.
14. 14
Key indicators of securities market
Index
An Index is used to give information about the price movements of products in
the financial, commodities or any other markets. Stock market indices are meant to
capture the overall behavior of the equity markets. The stock market index is created by
selecting a group of stocks that are representative of the whole market or a specified
sector or segment of the market. The bluechip index of NSE is CNX Nifty.
Market Capitalization
Market capitalization is defined as value of all listed shares on the country’s
exchanges. It is computed on a daily basis. Market capitalization of a particular company
on a particular day can be computed as product of the number of shares outstanding and
the closing price of the share. Here the number of outstanding shares refers to the issue
size of the stock.
Market Capitalization = Closing price of share * Number of outstanding shares
Similarly, to compute the market capitalization of all companies listed on an
Exchange we aggregate the market capitalization of all the companies traded on the
Exchange.
Market Capitalization Ratio
Turnover ratio = market capitalization of stocks
GDP
It is used as a measure of stock market size.
15. 15
Turnover
Turnover for a share is computed by multiplying the traded quantity with the price at
which the trade takes place. Similarly, to compute the turnover of the companies listed at
the Exchange we aggregate the traded value of all the companies traded on the Exchange.
Turnover Ratio
The turnover ratio is defined as the total value of shares traded on a country’s stock
Exchange for a particular period divided by market capitalization at the end of the
period. It is used as a measure of trading activity or liquidity in the stock markets.
Turnover Ratio = Turnover at Exchange / Market Capitalization at Exchange
SEBI (The Securities and Exchange Board of India)
It was officially established by The Government of India in the year 1988 and
given statutory powers in 1992 with SEBI Act 1992 being passed by the Indian
Parliament . SEBI has its Headquarters at the business district of Bandra Kurla
Complex in Mumbai, and has Northern,Eastern, Southern and Western Regional
Offices in NewDelhi, Kolkata, Chennai and Ahmadabad respectively.Controller of
Capital Issues was the regulatory authority before SEBI came into existence; it
derived authority from the Capital Issues (Control) Act, 1947.
Initially SEBI was a non statutory body without any statutory power. However in
the year of 1995, the SEBI was given additional statutory power by the
Government of India through an amendment to the Securities and Exchange Board of
India Act, 1992 . In April, 1988 the SEBI was constituted as the regulator of capital
markets in India under a resolution of the Government of India.
The SEBI is managed by its members, which consists of following: a) The
chairman who is nominated by Union Government of India. b) Two members, i.e.
Officers from Union Finance Ministry. c) One member from The Reserve Bank of
India. d) The remaining 5 members are nominated by Union Government of India,
out of them at least 3 shall be whole-time members.
16. 16
The office of SEBI is situated at SEBI Bhavan, Bandra Kurla Complex, Bandra East,
Mumbai-400051, with its regional offices at Kolkata, Delhi, Chennai &
Ahmadabad. It has recently opened local offices at Jaipur and Bangalore and is
planning to open offices at Guwahati, Bhubaneswar, Patna, Kochi and Chandigarh in
Financial Year 2013 - 2014.
FUNCTIONS AND RESPONSIBILITIES
The Preamble of the Securities and Exchange Board of India describes the basic
functions of the Securities and Exchange Board of India as "...to protect the interests of
investors in securities and to promote the development of, and to regulate the securities
market and for matters connected therewith or incidental there to" .SEBI has to be
responsive to the needs of three groups, which constitute the market:
The issuers of securities
The investors
The market intermediaries.
SEBI has three functions rolled into one body: quasi-legislative, quasi-judicial and quasi
executive. It drafts regulations in its legislative capacity, it conducts investigation
and enforcement action in its executive function and it passes rulings and orders
in its judicial capacity. Though this makes it very powerful, there is an appeal process
to create accountability. There is a Securities Appellate Tribunal which is a three-
member tribunal and is presently headed by Mr. Justice J P Devadhar, a former judge
of the Bombay High Court. A second appeal lies directly to the Supreme Court.
Powers
For the discharge of its functions efficiently, SEBI has been vested with the following
powers:
1. To approve by−laws of stock exchanges.
2. To require the stock exchange to amend their by−laws.
17. 17
3. Inspect the books of accounts and call for periodical returns from
recognized stock exchanges.
4. Inspect the books of accounts of financial intermediaries.
5. Compel certain companies to list their shares in one or more stock exchanges.
6. Levy fees and other charges on the intermediaries for performing its functions.
7. Grant license to any person for the purpose of dealing in certain areas.
8. Delegate powers exercisable by it.
9. Prosecute and judge directly the violation of certain provisions of the companies
Act.
10. Power to impose monetary penalties.
SEBI Committees
1. Technical Advisory Committee
2. Committee for review of structure of market infrastructure institutions
3. Members of the Advisory Committee for the SEBI Investor Protection and
4. Education Fund
5. Takeover Regulations Advisory Committee
6. Primary Market Advisory Committee (PMAC)
7. Secondary Market Advisory Committee (SMAC)
8. Mutual Fund Advisory Committee
9. Corporate Bonds Securitization Advisory Committee
10. Takeover Panel
11. SEBI Committee on Disclosures and Accounting Standards (SCODA)
12. High Powered Advisory Committee on consent orders and compounding of
13. Offences
14. Derivatives Market Review Committee
15. Committee on Infrastructure Funds
16. Regulation over Financial Terms of Various Authorities.
18. 18
NSE (NATIONAL STOCK EXCHANGE OF INDIA)
The National Stock Exchange (NSE) is India's leading stock exchange covering various
cities and towns across the country. NSE was set up by leading institutions to -provide a
modem, fully automated screen-based trading system with national reach. The
Exchange has brought about unparalleled transparency, speed & efficiency, safety
and market integr ity. It has set up facilities that serve as a model for the
securities industry in terms of systems, practices and procedures.
NSE has played a catalytic role in reforming the Indian securities market in terms
of microstructure, market practices and trading volumes. The market today uses state-
ofart information technology to provide an efficient and transparent trading, clearing and
settlement mechanism, and has witnessed several innovations in products &
services viz. demutualization of stock exchange governance, screen based trading,
compression of settlement cycles, dematerialization and electronic transfer of securities,
securities lending and borrowing, professionalization of trading members, fine-tuned
risk management systems,emergence of clearing corporations to assume counterparty
risks, market of debt and derivative instruments and intensive use of information
technology.
Purpose, Vision & Values
Purpose
Committed to improve the financial well-being of people.
Vision
To continue to be a leader, establish global presence; facilitate the financial well-
being of people.
Values
NSE is committed to the following core values:
19. 19
Integrity
Customer focused culture
Trust, respect and care for the individual
Passion for excellence
Teamwork
History & Milestones
NSE was promoted by leading Financial Institutions at the behest of the Government of
India and was incorporated in November 1992 as a tax - paying company unlike
other stock exchanges in the country. March 22, 2012 - NSE and India Post start
Unique Financial Inclusion Initiative "Jagruti" March 14, 2012 — NSE launches
"EMERGE" SME Platform. December 2011- NSCCL Rated "CCR AAA" for fourth
consecutive year - 28th Dec 2011 September 2011- Launch of derivatives on CNX
PSE and CNX Infrastructure Indices August 2011- Launch of derivatives on Global
Indices July, 2011- Commencement of trading in 91 Day GOI Treasury bill - Futures
January, 2011- NSE receives "Financial Inclusion" Award.
PRODUCTS AND PARTICIPANTS
Products
Financial markets facilitate reallocation of savings from savers to entrepreneurs. Savings
are linked to investments by a variety of intermediaries through a range of complex
financial products called "Securities". Under the Securities Contracts (Regulation)
Act [SC(R) A], 1956, "securities" include (i) shares, bonds, scrips, stocks or other
marketable securities of like nature in or of any incorporate company or body corporate,
(ii) government securities, (iii) derivatives of securities, (iv) units of collective
investment scheme, (v)interest and rights in securities, and security receipt or any other
instruments so declared by the central government. Broadly, securities can be of three
types — equities, debt securities and derivatives.
Participants
The securities market has essentially three categories of participants
20. 20
i) The investors,
ii) The issuers,
iii) The intermediaries.
These participants are regulated by the Securities and Exchange Board of India
(SEBI), Reserve Bank of India (RBI), Ministry of Corporate Affairs (MCA) and
the Department of Economic Affairs (DEA) of the Ministry of Finance.
Market Segments and their Products
The Exchange (NSE) provides trading in four different segments —
wholesale Debt Market, Capital Market, Futures and Options and Currency
Derivatives Segment.
1. Wholesale Debt Market (WDM) Segment: This segment at NSE commenced its
operations in June 1994. It provides the trading platform for wide range of debt securities
which includes State and Central Government securities, T-Bills, PSU Bonds, Corporate
debenture, Commercial Papers, Certificate of Deposits etc.
2. Capital Market (CM) Segment: This segment at NSE commenced its
operations in November 1994. It offers a fully automated screen based trading system,
known as the National Exchange for Automated Trading (NEAT) system. Various types
of securities e.g. equity shares, warrants, debentures etc. are traded on this system.
3. Futures & Options (F&O) Segment: This segment provides trading in
derivatives instruments like index futures, index options, stock options, and stock futures,
and commenced its operations at NSE in June 2000.
4. Currency Derivatives Segment (CDS) Segment: This segment at NSE commenced
its operations on August 29, 2008, with the launch of currency futures trading in US
Dollar-Indian Rupee (USD-INR). Trading in other currency pairs like Euro -INR,
Pound Sterling¬INR and Japanese Yen-INR was further made available for trading in
February 2010. `Interest rate futures' was another product made available for trading
on this segment with effect from August 31, 2009.
21. 21
BLUECHIP STOCKS
A nationally recognized, well-established and financially sound company. Blue chips
generally sell high-quality, widely accepted products and services. Blue chip
companies are known to weather downturns and operate profitably in the face of
adverse an economic condition, which helps to contribute to their long record of stable
and reliable growth. The name "blue chip" came about because in the game of poker the
blue chips have the highest value.
Blue chip stocks are seen as a less volatile investment than owning shares in
companies without blue chip status because blue chips have an institutional status in the
economy. Investors may buy blue chip companies to provide steady growth in their
portfolios. The stock price of a blue chip usually closely follows the S&P 500.
Risk in the Stock Market:
Stock prices keep fluctuating over a wide range unlike the bank
deposits or government bonds.
The efficient market hypothesis shows the effect of fundamental factors in
changing the price of the stock market.
The Efficient Market Hypothesis shows that all price movements are
random whereas there are plenty of studies that reflect the fact that there is a
specific trend in the stock market prices over a period of time.
Research has shown that there are certain psychological factors that
shape the stock market prices.
Sometimes the market behaves illogically to any economic news.
The stock market prices can be diverted in any direction in response to
press releases, rumours and mass panic.
The stock market prices are also subject to speculation. In the short run the
stock market prices may be very volatile due to the occurrences of the fast
market changing events.
22. 22
Indian Capital Market:
The Capital Market deals in the long-term (for time-periods more than one year) capital
Securities (Equity or Debt) offered by the private business companies and also
governmental undertakings of India.
Significance of Capital Markets:
A well-functioning stock market may help the development process in an economy
through the following channels:
1. Growth of savings,
2. Efficient allocation of investment resources,
3. Better utilization of the existing resources.
In market economy like India, financial market institutions provide the avenue
by which long-term savings are mobilized and channeled into investments.
Confidence of the investors in the market is imperative for the growth and
development of the market. For any stock market, the market Indices is the barometer
of its performance and reflects the prevailing sentiments of the entire economy. Stock
index is created to provide investors with the information regarding the average
share price in the stock market. The ups and downs in the index represent the
movement of the equity market. These indices need to represent the return obtained by
typical portfolios in the country.
The nature of capital market:
It has two segments
It deals in long-term securities
It performs trade-off function
It creates dispersion in business ownership
It helps in capital formation
It helps in creating liquidity
23. 23
Capital market investments in the stock market:
The stock market is basically the trading ground capital market investment
in the following:
i) Company's stocks
ii) Derivatives
iii) Other securities
The capital market investments in the stock market take place by:
i) Small individual stock investors
ii) Large hedge fund traders.
The capital market investments can occur either in:
i) The physical market by a method known as the open outcry.
ii) Trading can also occur in the virtual exchange where trading is
done in the computer network.
The investors in the stock market have the liberty to buy or sell the stock that they are
holding at their own discretion unlike the case of government securities, bonds or real
estate
The Capital Market deals in the long-term (for time-periods more than one year)
capital Securities (Equity or Debt) offered by the private business companies and
also governmental undertakings of India. All New Stocks or Bonds presented by
growth oriented business companies of diverse sectors are sold to the investors in
the Primary Capital Market through Underwriting. The further trading of these capital
market securities and bonds takes place in the Secondary Capital Market, commonly with
the help of Stock Exchanges. The Securities and Exchange Board of India (SEBI)
governs and regulates the Indian capital market.
The capital market of India is among the top ten biggest capital markets of the
world, and provides a variety of capital market instruments. There are 25 well-
organized Stock Markets in India among which the Bombay Stock Exchange
(BSE) and the National Stock Exchange hold the dominant positions. Indian
Economy ranks among the top five largest economies of the world.
24. 24
About Index
A stock market index is a measure of the relative value of a group of stocks in
numerical terms. As the stocks within an index change value, the index value
changes. An index is important to measure the performance of investments against a
relevant market index.
An Index is used to give information about the price movements of
products in the financial, commodities or any other markets. Financial indexes are
constructed to measure price movements of stocks, bonds, T-bills and other forms of
investments. Stock market indexes are meant to capture the overall behavior of
equity markets. A stock market index is created by selecting a group of stocks that
are representative of the whole market or a specified sector or segment of the market. An
Index is calculated with reference to a base period and a base index value.
S&P CNX NIFTY (NIFTY - National Stock Exchange's Fifty)
The Nifty is an indicator of all the major companies of the NSE. The CNX Nifty
covers 22 sectors of the Indian economy and offers investment managers exposure to the
Indian market in one portfolio. The CNX Nifty stocks represent about 67.27% of
the free float market capitalization of the stocks listed at National Stock Exchange
(NSE) as on September 30, 2012.
The CNX Nifty index is a free float market capitalization weighted index. The
index was initially calculated on full market capitalization methodology. From June
26, 2009, the computation was changed to free float methodology. The base period for
the CNX Nifty index is November 3, 1995, which marked the completion of one
year of operations of NSE's Capital Market Segment. The base value of the index has
been set at 1000, and a base capital of Rs 2.06 trillion. The CNX Nifty Index was
developed by Aja y Shah and Susan Thomas..
25. 25
CNX AUTO
The CNX Auto Index is designed to reflect the behavior and performance of the
Automobiles segment of the financial market. The CNX Auto Index comprises 15
tradable, exchange listed companies. The index represents auto related sectors like
Automobiles 4 wheelers, Automobiles 2 & 3 wheelers, Auto Ancillaries and Tyres.
CNX Auto Index is computed using free float market capitalization method, wherein the
level of the index reflects the total free float market value of all the stocks in the index
relative to particular base market capitalization value.
CNX Auto Index can be used for a variety of purposes such as benchmarking fund
portfolios, launching of index funds, ETF’s and structured products.
Eligibility Criteria for Selection of Constituent Stocks
Companies must rank within the top 500 companies ranked by average free-float
market capitalisation and aggregate turnover for the last six months.
Companies should form a part of the Automobiles sector.
The company’s trading frequency should be at least 90% in the last six months.
The company should have reported a positive net worth.
The company should have an investable weight factor (IWF) of at least 10%.
The company should have a listing history of 6 months. A company which comes
out with an IPO will be eligible for inclusion in the index, if it fulfills the normal
eligibility criteria for the index for a 3 month period instead of a 6 month period.
Final selection of 15 companies shall be done based on the free-float market
capitalization of the companies
Index Govenance:
A professional team at IISL manages CNX Auto Index. There is a three-tier governance
structure comprising the Board of Directors of IISL, the Index Policy Committee, and the
Index Maintenance Sub-Committee.
26. 26
List of companies in CNX AUTO
Top 10 constituents by weightage
Company’s Name Weight (%)
Tata Motors Ltd. 24.89
Mahindra & Mahindra Ltd. 15.91
Maruti Suzuki India Ltd. 12.31
Hero MotoCorp Ltd. 10.42
Bajaj Auto Ltd. 9.12
Bosch Ltd. 4.92
Eicher Motors Ltd. 4.18
Motherson Sumi Systems
Ltd. 3.88
Bharat Forge Ltd. 3.27
MRF Ltd. 2.6
Company Name Industry Symbol Series ISIN Code
Amara Raja Batteries Ltd. Automobile AMARAJABAT EQ INE885A01032
Amtek Auto Ltd. Automobile AMTEKAUTO EQ INE130C01021
Apollo Tyres Ltd. Automobile APOLLOTYRE EQ INE438A01022
Ashok Leyland Ltd. Automobile ASHOKLEY EQ INE208A01029
Bajaj Auto Ltd. Automobile BAJAJ-AUTO EQ INE917I01010
Bharat Forge Ltd.
Industrial
manufacturing BHARATFORG EQ INE465A01025
Bosch Ltd. Automobile BOSCHLTD EQ INE323A01026
Eicher Motors Ltd. Automobile EICHERMOT EQ INE066A01013
Exide Industries Ltd. Automobile EXIDEIND EQ INE302A01020
Hero MotoCorp Ltd. Automobile HEROMOTOCO EQ INE158A01026
MRF Ltd. Automobile MRF EQ INE883A01011
Mahindra & Mahindra Ltd. Automobile M&M EQ INE101A01026
Maruti Suzuki India Ltd. Automobile MARUTI EQ INE585B01010
Motherson Sumi Systems Ltd. Automobile MOTHERSUMI EQ INE775A01035
Tata Motors Ltd. Automobile TATAMOTORS EQ INE155A01022
27. 27
3.2. COMPANY PROFILE
Future investments is a channel partner for ICICI securities Future investments started in
2005 owned by S.Sankar Kumar . .Future investments using the ICICI securities domain
to trade Future investments are a provider of financial services and information provider
primarily to Institutional and Retail clients in India. The Company operates in three
segments: Capital Market (CM) segment, Depository Participant (DP) segment and
Merchant Banking (MB) segment. The Company is a member of the National Stock
Exchange of India Ltd. (NSE) and BSE Limited (BSE) in the Capital Market and
Dervatives (Futures & Options) segment. The Company has also acquired membership of
the currency derivatives segment with NSE, BSE, United Stock Exchange (USE) and
Multi Commodity Exchange Stock Exchange (MCX-SX). It is Depositary Participant
with Central Depository Services (India) Limited (CDSL) and National Securities
Depository Limited (NSDL). The Company also provides Merchant Banking facilities
and Market Maker Services.
QUALITY POLICY OF THE COMPANY:-
To achieve and retain leadership, shall aim for complete customer satisfaction, by
combining its human and technological resources, to provide superior quality financial
service, in the process, company will strive to exceed customer’s expectation.
QUALITY OBJECTIVES:-
Build-in-house processes that will insure transparent and harmonious relationship
with its clients and investor to provide high quality of services.
Establish a partner relationship with its investors service agent and vendors that
will help in keeping up it commitments to the customers.
Provide high quality of work life for all its employees and equip them with
adequate knowledge and skills so as to respond to customer’s needs.
28. 28
Continue to uphold the values of honesty and integrity and strive to establish
unparalleled standard and business ethics.
Use state-of-the art information technology in developing new and innovative
financial products and services to meet the changing needs of investors and
clients.
Strive to be a reliable source of value-edit products and services and constantly
guide the individuals and institutions in making judicious choices of same.
Strive to keep all stakeholders (shareholders, clients, investors, employees,
suppliers and regulatory authorities) proud and satisfy.
PRODUCT AND SERVICE PROFILE
Company is a service oriented company. Service rendered by Future investments ltd,
Tuticorin
Share Trading
Mutual Fund
PAN / TDS / TAN
Fixed Deposit
Commodities & Currency
SHARE TRADING
SHARE
Definition: The capital of a company is divided into shares. Each share forms a unit of
ownership of a company and is offered for sale so as to raise capital for the company.
29. 29
Trade Time
Preopen - 9.00 a.m. to 9.07 a.m. (Monday to Friday)
Market Time - 9.15 a.m. to 3.30 p.m. (Monday to Friday)
After market order - 5.30 p.m. to 8.00 a.m. (Monday to Friday)
Buying and selling of shares in both BSE and NSE mostly company is preferring nifty to
their Clients.
Trading Procedure
Saving Account
Trading Account
Demat Account
Saving
account
Trading
account
Demat
account
Trading
account
30. 30
DEMAT ACCOUNT:-
Demat account is very much similar to saving current account of a bank, with the only
difference being that it deals with securities in electronics form and not money .’’A
demat account is just polite farewell to paperwork and a warm welcome to greater
efficiency and for that matter, security. A Dmat account a unique, capital-market-
investor-oriented
Benefits of the Demat account:-
No loss of share certificates.
No delay in transfer of shares.
No possibility of forgery on various document dealing to bad deliveries, legal disputes.
No possibility of theft of share certificates.
No prevalence of fake certificates in the markets
No mutilation or loss of share certificates in transit.
You can also receive your bonuses and rights into your depository account as a direct
credit, thus eliminating risk of loss in transit.
You can also expect a lower interest charge for loan taken against demat shares as
compared to interest for loan against physical shares .this could result in a saving of about
0.25% to 1.5% some banks have already announced this .
RBI has also reduce the minimum margin to 25% for loans dematerialized securities as
against 50% for loans against physical securities
Mutual Funds:
An investment vehicle that is made up of a pool of funds collected from many
investors for the purpose of investing in securities such as stocks, bonds, money market
instruments and similar assets. Mutual funds are operated by money managers, who
invest the fund's capital and attempt to produce capital gains and income for the fund's
investors. A mutual fund's portfolio is structured and maintained to match the investment
objectives stated in its prospectus
31. 31
ICICI Securities
ICICI Securities Ltd is the largest equity house in the country providing end-to-end
solutions (including web-based services) through the largest non-banking
distribution channel so as to fulfil all the diverse needs of retail and corporate customers.
ICICI Securities (I-Sec) has a dominant position in its core segments of its operations -
Corporate Finance including Equity Capital Markets Advisory Services, Institutional
Equities, Retail and Financial Product Distribution.
With a full-service portfolio, a roster of blue-chip clients and performance second to
none, we have a formidable reputation within the industry. Today ICICI Securities is
among the leading Financial Institutions both on the institutional as well as retail side.
Headquartered in Mumbai, I-Sec operates out of several locations in India.
ICICI Securities Inc., the step down wholly owned US subsidiary of the company is a
member of the National Association of Securities Dealers, Inc. (NASD). As a result of
this membership, ICICI Securities Inc. can engage in permitted activities in the U.S.
securities markets. These activities include Dealing in Securities and Corporate Advisory
Services in the United States and providing research and investment advice to US
investors.
ICICI Securities Ltd is an integrated securities firm offering a wide range of services
including investment banking, institutional broking, retail broking, private wealth
management, and financial product distribution.
ICICI Securities sees its role as 'Creating Informed Access to the Wealth of the Nation'
for its diversified set of client that include corporates, financial institutions, high net-
worth individuals and retail investors.
Headquartered in Mumbai, ICICI Securities operates out of 66 cities and towns in India
and global offices in Singapore and New York.
ICICI Securities Inc., the stepdown wholly owned US subsidiary of the company is a
member of the Financial Industry Regulatory Authority (FINRA) / Securities Investors
32. 32
Protection Corporation (SIPC). ICICI Securities Inc. activities include Dealing in
Securities and Corporate Advisory Services in the United States.
ICICI Securities Inc. is also registered with the Monetary Authority of Singapore (MAS)
and operates a branch office in Singapore
Rewards and recognition
Franchisor of the year award 2014
ICICI Securities won the Award for Outstanding Social Impacts at the Global
Sustainability Leadership Awards 2014 These awards recognize institutions for
their contribution to the society in their domain as well as businesses that deliver
products and services in ways that takes full account of their responsibility
towards the communities they touch.
Ranked 2 at the THOMSON REUTERS STARMINE ANALYST AWARDS
2014 - TOP BROKERS
"MOST ADMIRED SERVICE PROVIDER IN FINANCIAL SECTOR" at the
BANKING FINANCIAL SERVICES & INSURANCE AWARDS 2014
presented by ABP News.
ICICIdirect.com, won the Outlook Money ' Best e- Brokerage Award' ninth time
in a row in 2013. Previously, the firm won the award in 2004, 2005, 2007, 2008,
2009, 2010, 2011, and 2012.
ICICIdirect.com won the Mobbys award for the "Best Mobile application in
Mobile Trading".
ICICI Securities Business Partners has been conferred the Franchise India Awards
2013, for being the 'Franchisor of the year' in the Financial Services category.
ICICIdirect.com, won the award for Innovation at Banking Frontiers Finnoviti
Awards 2013. The award was conferred on ICICIDirect' for its `Valid Till Cancel
Order' (VTC ) facility, which was awarded amongst the top 3 innovations in BFSI
industry by 'Peer Voting'.
ICICI Securities won the Outlook Smart use Technology eRetailer of the year
2013 conferred by FIHL in association with HomeShop18.com.
ICICIdirect.com won the 'Stock Broker of the Year' award at the Money Today
FPCIL Awards 2012
ICICI Securities Business Partners (Sub Broker channel) won the 'Franchisor of
the Year' at the Franchise Awards 2012 for the fourth time in a row.
33. 33
ICICI Securities won the 'BSE IPF D&B Equity Broking Awards 2012' under two
categories:
Best Equity Broking House - Cash Segment
Largest E-Broking House
ICICI Securities won the Chief Learning Officer Award from World HRD
Congress for Innovation in Learning category.
ICICI Securities won the Grand Jury Award for 'Commendable performance by
National Financial Advisor (Retail) - Online' at the CNBC TV 18 - Financial
Advisor Awards 2011. The awards recognises India's best Financial Advisors.
ICICI Securities Business Partners (Sub Broker channel) won the 'Franchisor of
the Year at the Franchise Awards 2011', third time in a row.
ICICI Securities was the winner of the'Smart use Technology eRetailer of the
year' 2012 award conferred by Franchise India in association with UTV
Bloomberg for the first time.
ICICIdirect.com, won the Outlook Money ' Best e- Brokerage Award' seventh
time in a row. Previously, the firm won the award in 2004, 2005, 2007, 2008,
2009 and 2010.
ICICI Securities' Business Partners (Sub Broker channel) won the 'Franchisor of
the Year 2011' for the third consecutive year.
Anup Bagchi, MD & CEO has been honoured with the Zee Business 'Industry
Newsmaker Award 2010' for his tremendous and unmatched contribution in the
field of Finance
Pankaj Pandey, Head- Research - ICICIdirect has won the Zee Business Best
Market Analyst 2010 award in the Equities Fundamental Category
CMO Asia Awards for Excellence in Branding and Marketing 2010:
Brand Leadership Award (overall)
'Campaign of the Year' for the Trade Racer Campaign
Brand Excellence in Banking and Financial Services for the store format
Award for Brand Excellence in the Internet Business
Franchisor of the year award 2009
Retail concept of the year awards 2009
Frost and Sullivan 2009 Award for Customer Service Leadership
34. 34
PROFILE OF THE BLUECHIP FOUR WHEELER AUTOMOBILE
COMPANIES
TATA MOTORS LIMITED
Tata Motors Limited is India's largest automobile company, with consolidated
revenues of INR 1,88,818 crores (USD 34.7 billion) in 2012-13. It is the leader in
commercial vehicles in each segment, and among the top in passenger vehicles with
winning produ cts in the compact, midsize car and utility vehicle segments. It is also the
world's fifth largest truck manufacturer and fourth largest bus manufacturer.
The Tata Motors Group's over 60,000 employees are guided by the mission "to be
passionate in anticipating and providing the best vehicles and experiences that excite our
customers globally."
Established in 1945, Tata Motors' presence cuts across the length and breadth of India.
Over 8 million Tata vehicles ply on Indian roads, since the first rolled out in
1954. The company's manufacturing base in India is spread across Jamshedpur
(Jharkhand), Pune (Maharashtra), Lucknow (Uttar Pradesh), Pantnagar (Uttarakhand),
Sanand (Gujarat) and Dharwad (Karnataka).
Following a strategic alliance with Fiat in 2005, it has set up an industrial joint venture
with Fiat Group Automobiles at Ranjangaon (Maharashtra) to produce both Fiat and
Tata cars and Fiat powertrains. The company's dealership, sales, services and spare
parts network comprises over 6,600 touch points.
Tata Motors, also listed in the New York Stock Exchange (September 2004), has
emerged as an international automobile company. Through subsidiaries and associate
companies, Tata Motors has operations in the UK, South Korea, Thailand, South Africa
and Indonesia . Among them is Jaguar Land Rover, acquired in 2008. In 2004, it
acquired the Daewoo Commercial Vehicles Company, South Korea's second largest
truck maker. The rechristened Tata Daewoo Commercial Vehicles Company has
launched several new products in the Korean market, while also exporting these
products to several international markets. Today two-thirds of heavy commercial vehicle
35. 35
exports out of South Korea are from Tata Daewoo. In 2006, Tata Motors formed a 51:49
joint venture with the Brazil-based, Marcopolo, a global leader in body-building for
buses and coaches to manufacture fully-built buses and coaches for India - the plant is
located in Dharwad. In 2006, Tata Motors entered into joint venture with Thonburi
Automotive Assembly Plant Company of Thailand to manufacture and market the
company's pickup vehicles in Thailand, and entered the market in 2008. Tata Motors
(SA) (Proprietary) Ltd., Tata Motors' joint venture with Tata Africa Holding (Pty) Ltd.
set up in 2011, has an assembly plant in Rosslyn, north of Pretoria. The plant can
assemble, semi knocked down (SKD) kits, light, medium and heavy commercial
vehicles ranging from 4 tonnes to 50 tonnes.
Tata Motors is also expanding its international footprint, established through exports
since 1961. The company's commercial and passenger vehicles are already being
marketed in several countries in Europe, Africa, the Middle East, South East Asia,
South Asia, South America, CIS and Russia. It has franchisee/joint venture assembly
operations in Bangladesh, Ukra ine, and Senegal.
The foundation of the company's growth over the last 68 years is a deep
understanding of economic stimuli and customer needs, and the ability to translate
them into customer -desired offerings through leading edge R&D. With over 4,500
engineers, scientists and technicians the company's Engineering Research Centre,
established in 1966, has enabled pioneering technologies and products. The
company today has R&D centres in Pune, Jamshedpur, Lucknow, Dharwad in India,
and in South Korea, Italy, Spain, and the UK.
It was Tata Motors, which launched the first indigenously developed Light Commercial
Vehicle in 1986. In 2005, Tata Motors created a new segment by launching the Tata
Ace, India's first indigenously developed mini-truck. In 2009, the co mpany
launched its globally benchmarked Prima range of trucks and in 2012 the Ultra
range of international standard light commercial vehicles. In their power, speed,
36. 36
carrying capacity, operating economy and trims, they will introduce new benchmarks
in India and match the best in the world in performance at a lower life-cycle cost.
Tata Motors also introduced India's first Sports Utility Vehicle in 1991 and, in 1998,
the Tata Indica, India's first fully indigenous passenger car.
In January 2008, Tata Motors unveiled its People's Car, the Tata Nano. The Tata Nano
has been subsequently launched, as planned, in India in March 2009, and subsequently in
2011 in Nepal and Sri Lanka. A development, which signifies a first for the global
automobile industry, the Nano brings the joy of a car within the reach of thousands of
families.
Tata Motors is equally focussed on environment-friendly technologies in emissions
and alternative fuels. It has developed electric and hybrid vehicles both for
personal and public transportation. It has also been implementing several
environment -friendly technologies in manufacturing processes, significantly enhancing
resource conservation.
Through its subsidiaries, the company is engaged in engineering and automotive
solutions, automotive vehicle components manufacturing and supply chain activities,
vehicle financing, and machine tools and factory automation solutions.
Tata Motors is committed to improving the quality of life of communities by working
on four thrust areas - employability, education, health and environment. The activities
touch the lives of more than a million citizens. The company's support on education and
employability is focused on youth and women. They range from schools to
technical education institutes to actual facilitation of income generation. In health, the
company's intervention is in both preventive and curative health care. The goal of
environment protection is achieved through tree plantation, conserving water and
creating new water bodies and, last but not the least, by introducing appropriate
technologies in vehicles and operations for constantly enhancing environment care. With
the foundation of its rich heritage, Tata Motors today is etching a refulgent future
37. 37
MAHINDRA& MAHINDRA LIMITED (M&M)
Indian multinational automobile manufacturing corporation headquartered in Mumbai.
It is one of the largest vehicle manufacturers by production in India and the largest
seller of tractors across the world. It is a part of Mahindra Group, an Indian
conglomerate.
It was ranked as the 10th most trusted brand in India, by The Brand Trust Report, India
Study 2014. It was ranked 21st in the list of top companies of India in Fortune India 500
in 2011.
Today the company operations span 18 key industries that form the foundations of
every modern economy.
Aerospace, aftermarket, agribusiness, automotive, components, construction
equipment, consulting services, defence, energy, farm equipment, finance and
insurance, industrial equipment, information technology, leisure and hospitality,
logist ics, real estate, retail, two wheelers.
Mahindra & Mahindra was set up as a steel trading company in 1945 in Ludhiana as
Mahindra & Mohammed by brothers K.C. Mahindra and J.C. Mahindra . After India
gained independence and Pakistan was formed, Mohammed emigrated to Pakistan. The
company changed its name to Mahindra & Mahindra in 1948. It eventually saw
business opportunity in expanding into manufacturing and selling larger MUVs, starting
with assembly under licence of the Willys Jeep in India. Soon established as the Jeep
manufacturers of India, the company later commenced manufacturing light commercial
vehicles (LCVs) and agricultural tractors. Today, Mahindra & Mahindra is a key player
in the utility vehicle manufacturing and branding sectors in the Indian automobile
industry with its flagship UV Scorpio and uses India's growing global market presence
in both the automotive and farming industries to push its products in other
countries.
38. 38
The Mahindra Group focuses on enabling people to rise through solutions that
power mobility, drive rural prosperity, enhance urban lifestyles and increase business
efficiency. A USD 16.5 billion multinational group based in Mumbai, India, Mahindra
provides employment opportunities to over 200,000 people in over 100 countries.
Mahindra operates in the key industries that drive economic growth, enjoying a
leadership position in tractors, utility vehicles, information technology, financial services
and vacation ownership. In addition, Mahindra enjoys a strong presence in the
agribusiness, aerospace, components, consulting services, defence, energy, industrial
equipment, logistics, real estate, retail, steel, commercial vehicles and two wheeler
industries. In 2014, Mahindra featured on the Forbes Global 2000, a comprehensive
listing of the world’s largest, most powerful public companies, as measured by revenue,
profit, assets and market value. The Mahindra Group also received the Financial Times
‘Boldness in Business’ Award in the ‘Emerging Markets’ category in 2013.
Awards and recognition
Bombay Chamber Good Corporate Citizen Award for 2006-07.
Business world FICCI-SEDF Corporate Social Responsibility Awards
The Brand Trust Report ranked M&M as India's 10th Most Trusted Brand in its
India Study 2014 survey (from 20,000 brands analyzed).
Its Farm Equipment division received the Deming Prize in 2003.
Its Farm Equipment division received the Japan Quality Medal in 2007.
The US based Reputation Institute ranked M&M amongst the top Ten Indian
companies in its 'Global 200: The World's Best Corporate Reputations' list for
2008.
Bluebytes News rated M&M as India's second Most Reputed Car Company
(reported in their study titled Reputation Benchmark Study) conducted for the
Auto (Cars) Sector in 2013.
39. 39
MARUTI SUZUKI INDIA LIMITED
Maruti Suzuki India Limited(msil) commonly referred to as Maruti and
formerly known as MarutiUdyog Limited, is an automobile manufacturer in India. It is
a subsidiary of Japanese automobile and motorcycle manufacturer Suzuki. As of
November 2012, it had a market share of 37% of the Indian passenger car market. Maruti
Suzuki manufactures and sells a complete range of cars from the entry level Alto, to
the hatchback Ritz, A-Star, Swift, WagonR, Zen and sedans DZire, Kizashi and SX4, in
the 'C' segment Eeco, Omni, Multi Purpose vehicle Suzuki Ertigaand Sports Utility
vehicle Grand Vitara.
The company's headquarters are on Nelson Mandela Road, New Delhi. In February
2012, the company sold its ten millionth vehicle in India.
Maruti's history begins in 1970, when a private limited company named 'Maruti
technical services private limited' (MTSPL) is launched on November 16, 1970. The
stated purpose of this company was to provide technical know-how for the design,
manufacture and assembly of "a wholly indigenous motor car". In June 1971, a
company called 'Maruti limited' was incorporated under the Companies Act and Sanjay
Gandhi became its first managing director. After a series of scandals, "Maruti Limited"
goes into liquidation in 1977. This is followed by a commission of inquiry headed by
Justice A. C. Gupta, which submits its report in 1978. On 23 June 1980 Sanjay Gandhi
dies when a private test plane he was flying crashes. A year after his death, and at the
behest of Indira Gandhi , the Indian Central government salvages Maruti Limited
and starts looking for an active collaborator for a new company: MarutiUdyog Ltd being
incorporated in the same year.
40. 40
Rewards and recognition
The Brand Trust Report published by Trust Research Advisory has ranked Maruti Suzuki
in the seventh position in 2011 and the sixth position in 2012 among the brands
researched in India.
Bluebytes News, a news research agency, rated Maruti Suzuki as India's Most
Reputed Car Company in their Reputation Benchmark Study conducted for the
Auto (Cars) Sector which launched in April 2012.
Achievements/ recognition:
The company takes great pride in sharing that customers have rated Maruti Suzuki
first once again in Customer Satisfaction Survey conducted by independent
body, J.D.Power Asia Pacific. It is 9th time in a row.
Maruti Suzuki wins 'Golden Peacock Eco-Innovation Award'
Maruti Suzuki Ranks Highest in Automotive Customer Satisfaction in India
For Ninth Consecutive Year.
Maruti Suzuki becomes the first Indian car company to export half a million cars
Other Accolades
During 2009-10, the company, its products and services received reputed awards and
accolades instituted by independent expert groups, media houses and research agencies.
These Include
Rated as No. 1 in J D Power Sales Satisfaction Index
Hatchback of the year - Ritz by Autocar
Car of the year - Ritz by Business Motoring
Manufacturer of the year by CNBC Overdrive
Ranked third amongst global car companies in the World's Most Reputed
Company Survey 2009
National Award for Excellence in Corporate Governance by ICSI
41. 41
CHAPTER IV
DATA ANALYSIS AND INTERPRETATION
INTRODUCTION
Data Analysis
Analysis of data in a general way involves a number of closely related operations which
are performed with the purpose of summarizing the collected data and organizing those in
such a manner that they answer the research.
Interpretation
Interpretation is the process of relating various bits of information to other existing
information. Interpretation attempts to answer, “What relationship exists between the
findings to the research objectives and hypothesis framed for the study in the beginning “
Correlation
In the world of finance, a statistical measure of how two securities move in relation to
each other. Correlations are used in advanced portfolio management.
Beta
A measure of the volatility, or systematic risk, of a security or a portfolio in comparison
to the market as a whole. Beta is used in the capital asset pricing model (CAPM), a model
that calculates the expected return of an asset based on its beta and expected market
returns.. Also known as "beta coefficient"
Relative Strength Index
A technical momentum indicator that compares the magnitude of recent gains to recent
losses in an attempt to determine overbought and oversold conditions of an asset.
43. 43
Where X = Auto Nifty Close price, Y = M&M Close price
𝑋 = ∑ 𝑋/𝑁 = 82865.50 / 12 = 6905.46
𝑌 = ∑ 𝑌/𝑁 = 14136.35 / 12 = 1178.02
𝜎𝑋2 = 1/N(X-𝑋)2 = 1/12 (16201937.70) = 1350161.47
𝜎𝑋 = √1350161.47 = 1161.96
𝜎𝑌2 = 1/N(Y-𝑌)2 = 1/12 (305570.41) = 25464.20
𝜎𝑌 = √25464.20 = 159.58
Co-efficient of correlation r =
∑(𝑋−𝑋)
𝑁𝜎𝑋𝜎𝑌
(𝑌−𝑌)
=
1985621.61
12∗1161.96∗159.58
=
1985621.61
2225106.92
= 0.89.
INTERPRETATION
The value 0.89 lies between -1 and +1 and indicates a higher degree of positive
correlation between Auto Nifty and Mahindra & Mahindra stocks.
“There is a relationship between Auto Nifty and Mahindra & Mahindra stocks”.
45. 45
Where X = Auto Nifty Close price, Y = Maruti suzuki Close price
𝑋 = ∑ 𝑋/𝑁 = 82865.50 / 12 = 6905.46
𝑌 = ∑ 𝑌/𝑁 = 30215.80 / 12 = 2517.98
𝜎𝑋2 = 1/N(X-𝑋)2 = 1/12 (16201937.70) = 1350161.47
𝜎𝑋 = √1350161.47 = 1161.96
𝜎𝑌2 = 1/N(Y-𝑌)2 = 1/12 (4743763.80) = 395313.65
𝜎𝑌 = √395313.65 = 628.74
Co-efficient of correlation r =
∑(𝑋−𝑋)
𝑁𝜎𝑋𝜎𝑌
(𝑌−𝑌)
=
8684842.
12∗1161.96∗628.74
=
8684842
8766848.76
= 099.
INTERPRETATION
The value 0.99 lies between -1 and +1 and indicates a higher degree of positive
correlation between Auto Nifty and Maruti suzuki stocks.
“There is a relationship between Auto Nifty and Maruti suzuki stocks”
47. 47
Where X = Auto Nifty Close price, Y = M&M Close price
𝑋 = ∑ 𝑋/𝑁 = 82865.50 / 12 = 6905.46
𝑌 = ∑ 𝑌/𝑁 = 5465.10 / 12 = 455.42
𝜎𝑋2 = 1/N(X-𝑋)2 = 1/12 (16201937.70) = 1350161.47
𝜎𝑋 = √1350161.47 = 1161.96
𝜎𝑌2 = 1/N(Y-𝑌)2 = 1/12 (41059.88) = 3421.65
𝜎𝑌 = √3421.65 = 58.49
Co-efficient of correlation r =
∑(𝑋−𝑋)
𝑁𝜎𝑋𝜎𝑌
(𝑌−𝑌)
=
776352.57
12∗1161.96∗58.49
=
776352.57
815556.48
= 0.95
INTERPRETATION
The value 0.95 lies between -1 and +1 and indicates a higher degree of positive
correlation between Auto nifty and Tata motors stocks.
“There is a relationship between Auto Nifty and Tata motors stocks”
49. 49
CHART 4.1
SHOWS THE BETA OF MAHINDRA & MAHINDRA INDIA LTD
JAN TO DEC -2013
INTERPRETATION
The 𝛽 value for Mahindra & Mahindra limited 2014 is found to be 1.23. The market
portfolio 𝛽 will always be 1.Mahindra & Mahindra stocks are positive valued. Therefore
it can be said the risk is more than auto nifty’s risk. Because, beta describes the
relationship between the Mahindra & Mahindra stocks and an auto nifty return.
-0.1
-0.05
0
0.05
0.1
0.15
0.2
1 2 3 4 5 6 7 8 9 10 11 12
X (Auto nifty close price )
Y (close proce of M&M )
51. 51
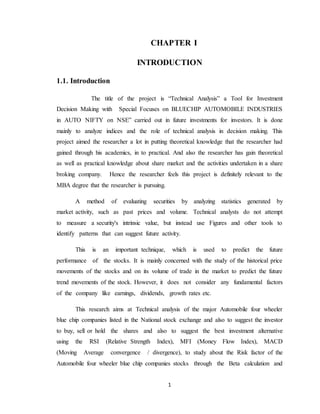
CHART 4.2
SHOWS THE BETA OF MARUTHI SUZUKI INDIA LTD –JAN TO DEC -2014
INTERPRETATION
The 𝛽 value for Maruti Suzuki limited 2014 is found to be 0.96. The market portfolio 𝛽
will always be 1. Maruti Suzuki stocks are positive valued. Therefore it can be said the
risk is more than auto nifty’s risk. Because, beta describes the relationship between the
Maruti Suzuki stocks and an auto nifty return.
-5
0
5
10
15
20
25
30
1 2 3 4 5 6 7 8 9 10 11 12
X (Auto nifty close price )
Y (close proce of Maruti )
53. 53
CHART 4.3
SHOWS THE BETA OF TATA MOTORS INDIA LTD –JAN TO DEC -2014
INTERPRETATION
The 𝛽 value for Tata Motors limited 2014 is found to be 1.31. The market portfolio 𝛽
will always be 1. Tata Motors stocks are positive valued. Therefore it can be said the risk
is more than auto nifty’s risk. Because, beta describes the relationship between the Tata
Motors stocks and an auto nifty return.
-10
-5
0
5
10
15
20
25
1 2 3 4 5 6 7 8 9 10 11 12
X (Auto nifty close price )
Y (close price of TATA motors )
60. 60
CHART 4.4
TECHNICAL ANALYSIS FOR M&M INDIA LTD DURING JAN-DEC2014
INTERPRETATION
In the month of February and October the RSI reached the level 30. So it indicates
oversold condition. The RSI crossing the level of above 70 in the period of March, May,
June, August and September which is clearly signaling that the stock had the overbought
condition.