

Recomendados
Más contenido relacionado
La actualidad más candente
La actualidad más candente (20)
Destacado
Destacado (20)
Similar a electronic waste management
Similar a electronic waste management (20)
Más de Arvind Kumar
Más de Arvind Kumar (20)
Último
Último (20)
electronic waste management
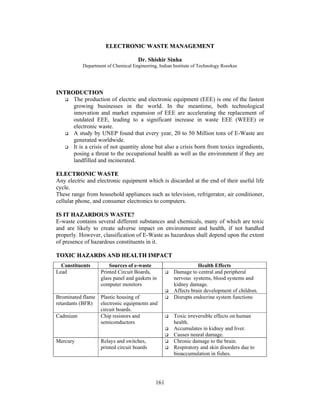
- 1. ELECTRONIC WASTE MANAGEMENT Dr. Shishir Sinha Department of Chemical Engineering, Indian Institute of Technology Roorkee 161 INTRODUCTION The production of electric and electronic equipment (EEE) is one of the fastest growing businesses in the world. In the meantime, both technological innovation and market expansion of EEE are accelerating the replacement of outdated EEE, leading to a significant increase in waste EEE (WEEE) or electronic waste. A study by UNEP found that every year, 20 to 50 Million tons of E-Waste are generated worldwide. It is a crisis of not quantity alone but also a crisis born from toxics ingredients, posing a threat to the occupational health as well as the environment if they are landfilled and incinerated. ELECTRONIC WASTE Any electric and electronic equipment which is discarded at the end of their useful life cycle. These range from household appliances such as television, refrigerator, air conditioner, cellular phone, and consumer electronics to computers. IS IT HAZARDOUS WASTE? E-waste contains several different substances and chemicals, many of which are toxic and are likely to create adverse impact on environment and health, if not handled properly. However, classification of E-Waste as hazardous shall depend upon the extent of presence of hazardous constituents in it. TOXIC HAZARDS AND HEALTH IMPACT Constituents Sources of e-waste Health Effects Lead Printed Circuit Boards, glass panel and gaskets in computer monitors Damage to central and peripheral nervous systems, blood systems and kidney damage. Affects brain development of children. Brominated flame retardants (BFR) Plastic housing of electronic equipments and circuit boards. Disrupts endocrine system functions Cadmium Chip resistors and semiconductors Toxic irreversible effects on human health. Accumulates in kidney and liver. Causes neural damage. Mercury Relays and switches, printed circuit boards Chronic damage to the brain. Respiratory and skin disorders due to bioaccumulation in fishes.
- 2. 162 Hexavalent chromium (Cr) VI Corrosion protection of untreated and galvanized steel plates, decorator or hardner for steel housings Asthmatic bronchitis. DNA damage. Beryllium (Be) Motherboard Carcinogenic (lung cancer) Inhalation of fumes and dust. Causes chronic beryllium disease or beryllicosis. Skin diseases such as warts. Plastics including PVC Cabling and computer housing Burning produces dioxin. It causes Reproductive and developmental problems; Immune system damage; Interfere with regulatory hormones. Barium (Ba) Front panel of CRTs Short term exposure causes: Muscle weakness; Damage to heart, liver and spleen. BASIC MATERIAL COMPOSITION OF E-WASTE 9% SOURCES OF E-WASTE Individuals and small businesses: discarded, not because they are broken but simply because new technology. Large businesses, institutions, and governments: Upgrade employee computers regularly, say every 3-4 years. ( over 70% discards) Original Equipment Manufacturers (OEMs): OEMs generates e-waste when production line don’t meet quality standards. Imports: About 80 % of the e-waste generated in the US is exported to India, China and Pakistan. E-WASTE: IT’’S GRAVITY (SOURCE: INFOTREK SYSCOM LTD.) The problem is severe : Do you know that in USA alone? Between 1997 and 2007, nearly 500 million personal computers will become obsolete-almost two computers for each person. 57% 22% 3% 9% Metals Plastics Glass Electronics Others
- 3. 15,000,000 PCs become obsolete every year. 7,000,000 computers will end up stockpiled for at least 3 years. 750,000 computers will end up in landfills this year alone. WASTE IN 500 MILLION COMPUTERS Plastic 6.32 Billion Pounds Lead 1.58 Billion Pounds Cadmium 3 Million Pounds Chromium 1.9 Million Pounds Mercury 632,000 Pounds INDIAN SCENARIO According to a survey by IRG Systems, South Asia, the total e-waste in India has been estimated to be 1,46,180 tons per year based on selected EEE tracers’ items. This figure does not include WEEE imports. Obsolescence Rate S. EEE No. 1. Computer 7 Years 2. Television 15 Years 3. Refrigerator 15 Years Washing 15 Years Machine 4. Toxics Link, a Delhi based NGO, says that India annually generates $ 1.5 billion 163 worth of e-waste. In Delhi alone 10,000 to 20,000 tons of e-waste is handled every year, of which, computers account for 25 %. As per a study done by Bangalore based NGO, Saahas, Bangalore generates around 8,000 tons of e-waste annually. The Industry is growing at 36 % annually. E-waste are generated from computer and related products(33.9%), large household appliances(42.1%), consumer electronics(13.7%) (source: Green business opportunities, CII, Jan-Mar 2006)
- 4. IT companies are the single largest contributors to the e-waste. Of the nearly 8 million PCs in India, 2 million are either of the generation represented by the chip Intel 486 or lower. (Toxics Link) Bangalore houses over 1,300 software companies, 36 hardware units churns out around 30,000 obsolete computers every year. (source: Saahas) WEEE Generation Top Ten States (Source: IRG Systems) S. No. STATES WEEE (Tonnes) 1 Maharashtra 20270.59 2 Tamil Nadu 13486.24 3 Andhra Pradesh 12780.33 4 Uttar Pradesh 10381.11 5 West Bengal 10059.36 6 Delhi 9729.15 7 Karnataka 9118.74 8 Gujarat 8994.33 9 Madhya Pradesh 7800.62 10 Punjab 6958.46 WEEE Projections (Source: IRG Systems) 164
- 5. HAZARDS OF DISPOSAL (CONVENTIONAL METHODS) Landfill: Wastes that are landfilled produces contaminated leachates which eventually pollute the groundwater. 165 Open landfills expose lead and mercury to wildlife Closed landfills vent airborne mercury Incineration: Incineration of e-wastes can emit toxic fumes and gases, thereby polluting the surrounding air. Plastics in cables Lead in solder joints Cadmium in batteries
- 6. OPEN AIR BURNING / ACID WASHING Prevalent in Asian countries Plastics burned in order to recover copper and other metals. Predominantly PVC forms dioxins and furans. High levels of cadmium, copper, lead and zinc from ashes collected from waste (Circuit Board) burning operations. Extracted acid water contain highly toxic metals and other chemicals. Its dumping causes pollution of soil and water resources. 166 RECYCLING Poorly regulated operations have resulted in toxic hazards and expensive cleanup. Workers exposed to toxins in countries where regulation is lax. MANAGEMENT OF E-WASTE In industries management of e-waste should begin at the point of generation. This can be done by waste minimization techniques and by sustainable product design. Waste minimization in industries involves adopting: inventory management, production-process modification, volume reduction, recovery and reuse. Four Basic Principles – Reduce, Reuse, Recycle Respond Waste Prevention: Minimize the Volume Reduce waste and pollution Reuse as many things as possible Recycle and compost as much waste as possible Chemically or biologically treat or incinerate Bury what is left Re-use: Reuse is the environmentally preferable option for managing older electronic equipment. Extending the life of old products minimizes the pollution and resource consumption associated with making new products. ( MAXIMIZE RE-USE) Electronic equipments which are too old and commercially practically not viable for reuse or is broken beyond repair, may be sent for disassembly i.e. salvaging parts, and selling reclaimed materials. Several electronic equipment, such as computers, monitors, printers, and scanners, contain materials suitable for reclamation and use in new products. These may include plastic, glass, copper, gold, silver, and other metals.
- 7. Inputs Process Gold Plated Connectors 167 E-WASTE RECYCLING Equipment refurbishment and resale De-manufacturing and disassembly Recovering valuable components Hazardous and base metal recovery Hazardous component management Precious Metal Recovery (Gold) Product collection Test/Sort Resale/Reuse (Product) Resale/Reuse (Parts) Disassembly Size Reduction Separation by materials Market Disposal Cathode Ray tubes Repeated 2 or 3 times Metal Components Immersion Heating Stripping Washing Filtering Nitric Acid Fuel (Coke, Coal etc) Nitric Acid Gold Flakes Used Nitric acid Water Furnace Smoke
- 8. Precious Metal Recovery (With Mercury) Inputs Process Gold Flakes Amalgam Re used 2 or 3 times Squeezing Mercury Gold Purifying Gold (70%) 168 Mercury Nitric Acid PWB –– ACID WASHING / BURNING Used Nitric acid Vapours Water Inspecting raw material: PWB with varnish or multilayer Remove varnish manually with spate and water. Residues washed away! PWBs submerged in sulphuric acid to remove Cu layer(12 hrs) Pouring acid to stainless steel tub and boil (firing with PWBs). Remove Cu - Sulphate crystals for selling. remaining acid solution is poured into plastic drums and iron scrap is added to fallout Cu. the solution is poured in drums for settling. Cu sludge is recovered. Solution is thrown. Cu is sold. Dissembling of CRT and Extraction of Components Monitors are much sought after by scrap dealers as they contain good quantity of copper yoke, besides circuit board and picture tube. Monitor recycling involves physical removal of plastic casing, picture tube (cathode ray tube), copper yoke and plates. Unscrewing the Opening the CRT With PMB Casing Plastic Body Plastic Case With Casing Plastic Casing CRT for Regunning Yoke for core and copper Extraction Separated PMB
- 9. EXTENDED PRODUCER RESPONSIBILITY (EPR) EPR extends the traditional environmental responsibilities that producers and distributors had in the past (e.g. safety of production, prevention and treatment of emissions from production) to also include management at the post-consumer stage. requires continuing accountability on producers over the entire life cycle of 169 their products producers must be financially, physically or legally responsible for their products Integral Components of EPR: Product take-back programs - The producer should own the responsibility of the product when it is discarded, either directly or through a third party. Remanufacturing - The procured E-Waste should be used as an effective resource base so that the maximum recoverable enter the manufacturing process, thus reducing the dependence on raw materials. Design - Redesigning the computer and its components as a front end solution to the E-Waste problem. The potential benefits of EPR include Efficient use of resources Cleaner products and technologies Efficient reduction in manufacturing Banning of hazardous substances used in production Less heavy metals Less harmful plastics Increased recycling e-WASTE MANAGEMENT Suffer from drawbacks like- Inadequate legislations, lack of funds, poor awareness and reluctance on part of the governments and the corporates to address the critical issues. A plan of action for e-waste management has to address the above mentioned issues in order to come up with a sustainable solution PLAN OF ACTION The most important participants/stake holders in any action plan would be: The society, represented by NGOs and Environmental activists/scientists Government - policy makers Corporates - RD teams Media - for awareness and public education
- 10. 170 LEGISLATIONS Covered under the “ Hazardous Waste Amended Rules, 2003 “ in List A and B of Schedule 3. Basel Convention: A global agreement regulating transboundary movements of hazardous wastes including E-waste between countries. An onus is put on exporting countries to ensure that hazardous wastes are managed in an environmentally sound manner in the country of import. Basel Ban: It calls for prohibiting the export of hazardous waste from Developed to Developing countries. RECOMMENDATIONS FOR ACTION Total ban on e-waste imports. Move solutions to product design – toxics and hazard free. Design for Longevity, Upgrade, Repair and Reuse. Minimize toxics in production. Tie recycling in with take-back product responsibility. Bring awareness among the informal recycling units about the hazards involved in processing of waste. Promote adequate ESM technologies for recycling.